File:Example of Plot for Across Countries.png: Difference between revisions
Jump to navigation
Jump to search
No edit summary |
(No difference)
|
Latest revision as of 18:12, 3 September 2025
An example of the Plot option from the Analyze Across Countries page. This example is for Education Years of 25 plus and GDP per capita, with a linear relationship chosen.
File history
Click on a date/time to view the file as it appeared at that time.
| Date/Time | Thumbnail | Dimensions | User | Comment | |
|---|---|---|---|---|---|
| current | 18:12, 3 September 2025 | 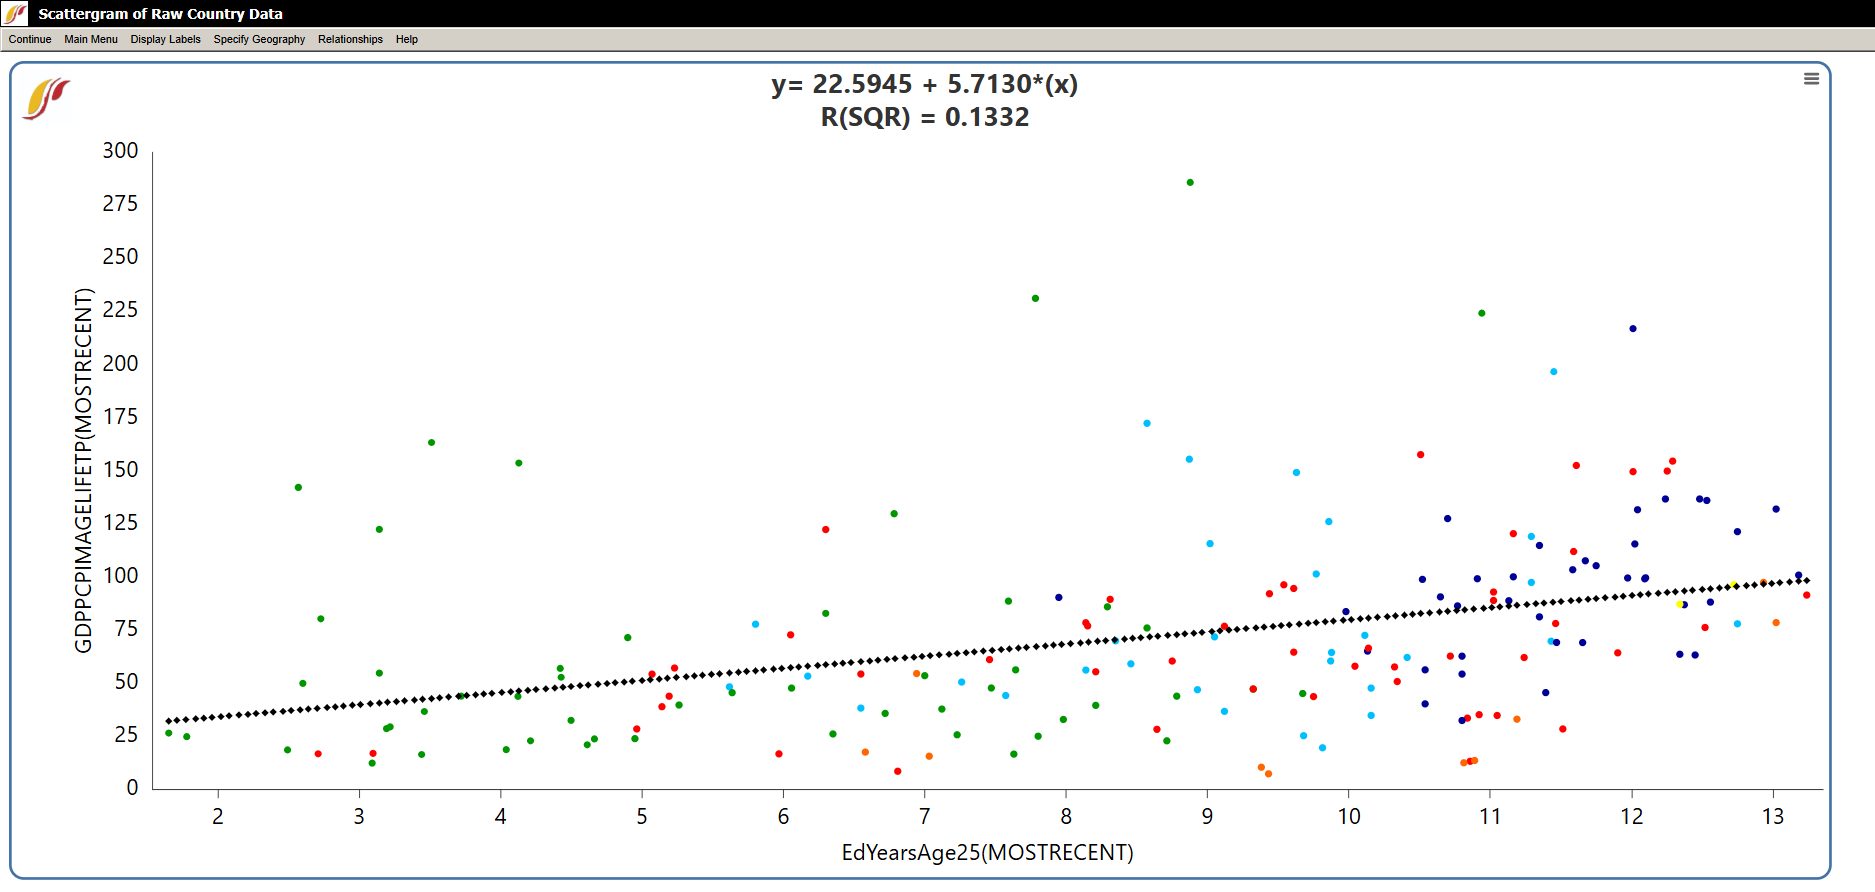 | 1,875 × 892 (105 KB) | Ethan.Sullivan (talk | contribs) |
You cannot overwrite this file.
File usage
The following page uses this file: