Validation
Many users will be interested in looking at issues of model validation. Validation is the process of examining how well the model’s historically forecasted data compares with actual empirical data.
The current process of model validation happens through specific display features, through accessing Self-Managed Display. This display feature, which can be found at the bottom of the list of display features found on the main menu of IFs, can then be used to access the historical run of the model. This historical run takes empirical data from 1960, runs it through the model, and then produces historically forecasted data up to the year 2000.
In order to validate the model, the first thing users must do is to open the IFsBaseHist, located at the top of the Self Managed Display Full Set of Variables/Parameters. Once this is opened, a new menu option becomes available called History Variable Options. Open this menu and click on the Select for Validation option.
When this option is selected, the Files Available for Display box now shows empirical data sets incorporated in IFs from 1960-2000. Users can identify these sets as empirical data by numeric label of -1. From heare, users must choose a variable to validate. For the purposes of this exercise, choose GDP2000. Users are then prompted to choose a country/region or group for validation. For this process, choose Kenya.
IFs then displays that you have chosen GDP2000 for Kenya. Users are then prompted to choose a historically forecasted variable to compare with the empirical data. Users can note that the numeric label of the different files in the Files Available for Display box is now 0 and 1 respectively. These numbers denote historically forecasted data sets. Choose the same variable, GDP for Kenya, to validate the model.
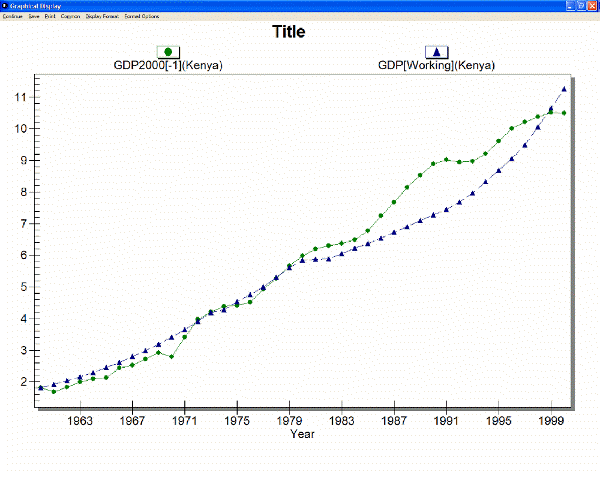
Click Go to Display, Graph and then Line graph. What you produce may look similar to the graph produced below:
Another opportunity for validating the IFs model also involves opening the IFsBaseHist file from Self Managed Display Full Variable/Parameter. After that file has been opened, return to the main menu of IFs and open the Display feature. From there, two display features have validation options.
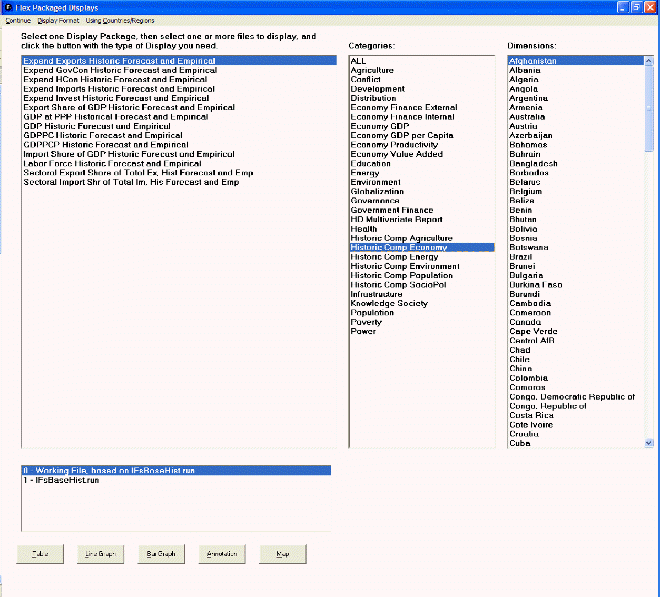
Users can open either the Flex Packaged Display or the Packaged Display. In both of these display features, under the Categories box, the Historical Comparison option becomes available. Click on that (under Flex Packaged Display, more than one Historical Comparison option becomes available), and a list of pre-packaged variables becomes available for display.
Below is an image taken from Flex Packaged Display after IFsBaseHist has been opened. The Historic Comp Economy category has been highlighted and all available pre-packaged displays are shown in the left-most box:

