File:Figure 6.3 Percentage of population skilled as function of GDP per capita Source- Barry Hughes.png
Jump to navigation
Jump to search
No higher resolution available.
Figure_6.3_Percentage_of_population_skilled_as_function_of_GDP_per_capita_Source-_Barry_Hughes.png (714 × 398 pixels, file size: 81 KB, MIME type: image/png)
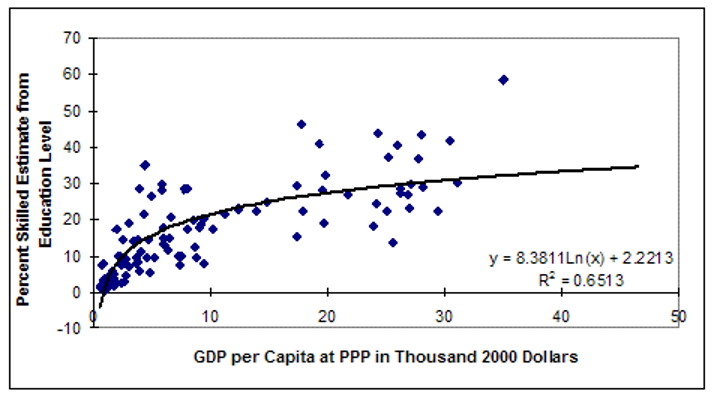
There are some obvious problems with Figure 6.2. One of the most significant is that better fits are achieved by other functional forms, including the logarithmic one in Figure 6.3. Unfortunately, those forms tend to suggest that the poorest countries have absolutely no skilled labor, clearly an exaggeration.
File history
Click on a date/time to view the file as it appeared at that time.
| Date/Time | Thumbnail | Dimensions | User | Comment | |
|---|---|---|---|---|---|
| current | ★ Approved revision 19:10, 10 May 2023 | | 714 × 398 (81 KB) | Julia.Detar (talk | contribs) |
You cannot overwrite this file.
File usage
The following page uses this file: