IHME Institute for Health Metrics and Evaluation Population: Difference between revisions
(summary) |
m (Added Contents) |
||
| (2 intermediate revisions by the same user not shown) | |||
| Line 1: | Line 1: | ||
SUMMARY | __FORCETOC__ | ||
<div style="display:flex; flex-flow: column wrap; text-align: left;"> | |||
==SUMMARY== | |||
The IHME dataset is from the [https://vizhub.healthdata.org/gbd-results/ GBD Results Tool], which is provided by the Institute for Health Metrics and Evaluation (IHME). IHME is an independent global health research center at the University of Washington. IHME gathers and provides many types of health-related data. Such as administrative data, census, demographic surveillance, disease registry, environmental monitoring, etc. The Global Burden of Disease (GBD) is a tool that provides a comprehensive picture of mortality and disability across countries, time, age, and sex. It quantifies health loss from hundreds of diseases, injuries, and risk factors worldwide. Because it's pulled from a free data source, it's imperative that the puller pay attention to the year of release, who the source uploader is, and what diseases cause death. These points are significant in ensuring that the calculation for the output of each country is accurate. GBD research incorporates both the prevalence of a given disease or risk factor and the relative harm it causes. The GBD is regularly updated with new data. | |||
In particular, the data team uses this dataset in order to calculate for a couple indicators: | |||
- GBD Estimate | |||
- Measure | |||
- Metric | |||
- Cause | |||
- Location | |||
- Age | |||
- Sex | |||
- Year | |||
By using these indicators, we calculate the death count of each cause of each gender group of a country across multiple age groups. | |||
To pull data into IFs, please follow the instructions found in the Data Pull instructions below. | |||
==GENERAL STEPS TO PULL DATA FROM IHME== | |||
{{Inline block | width = 38 cm| style = border: 1px solid #a2a9b1; padding: 0.5em; margin: 0.5em; flex = 38em; |2 = div|<br> | |||
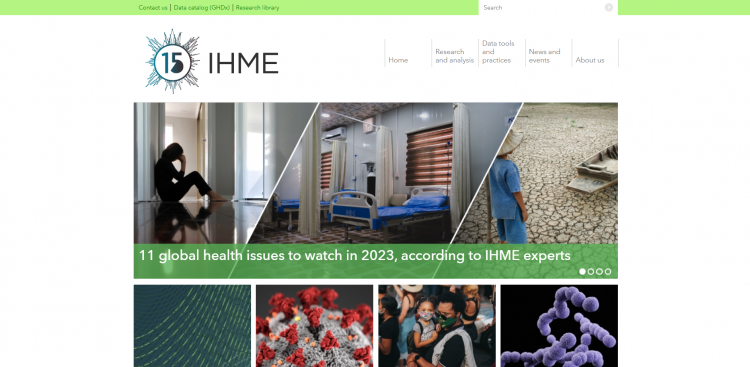
Step 1.) To pull from IHME, first navigate to https://www.healthdata.org/ | |||
[[File:Step01.png|thumb|750px|center|IHME Webpage]] | |||
}} | |||
{{Inline block | width = 38 cm| style = border: 1px solid #a2a9b1; padding: 0.5em; margin: 0.5em; flex = 38em; |2 = div|<br> | |||
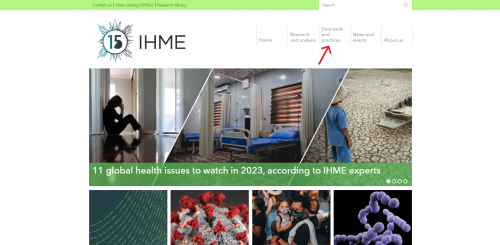
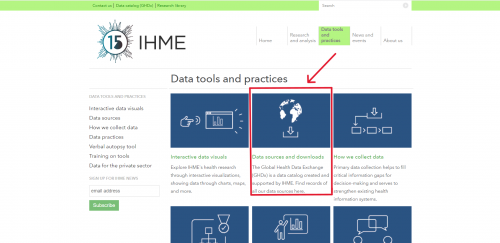
Step 2.) Click <nowiki><Data tools and practices></nowiki> at the top menu. Then, click <nowiki><Data sources and downloads></nowiki> will lead to a new page. | |||
[[File:Step02--Data tools and practices button.png|thumb|500px|center]] | |||
[[File:Step02-middle button1.png|thumb|500px|center]] | |||
}} | |||
{{Inline block | width = 38 cm| style = border: 1px solid #a2a9b1; padding: 0.5em; margin: 0.5em; flex = 38em; |2 = div|<br> | |||
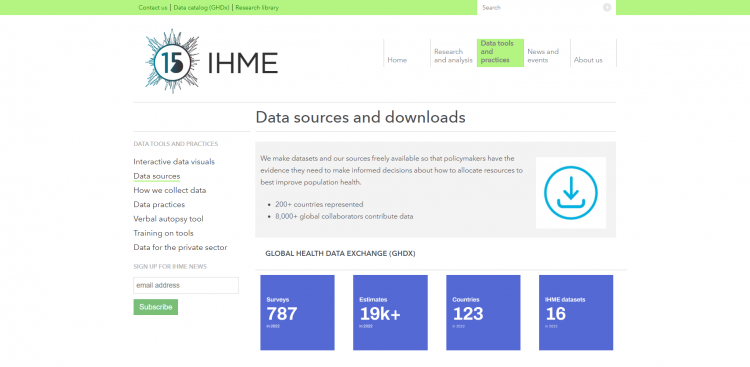
Step 3.) The following page will formulate. | |||
[[File:Step03.png|thumb|750px|center]] | |||
}} | |||
{{Inline block | width = 38 cm| style = border: 1px solid #a2a9b1; padding: 0.5em; margin: 0.5em; flex = 38em; |2 = div|<br> | |||
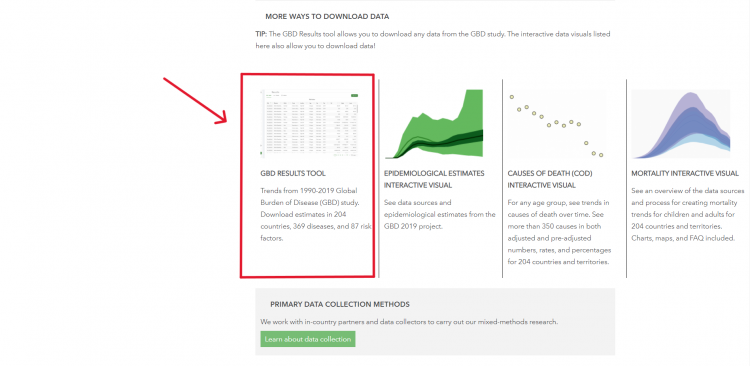
Step 4.) Scroll down and click <GBD RESULTS TOOL> | |||
[[File:Step04-01.png|thumb|750px|center]] | |||
}} | |||
{{Inline block | width = 38 cm| style = border: 1px solid #a2a9b1; padding: 0.5em; margin: 0.5em; flex = 38em; |2 = div|<br> | |||
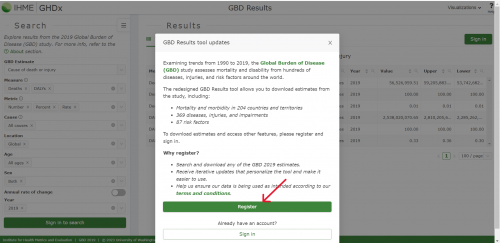
Step 5.) The following page will formulate. | |||
[[File:Step05-registe reminder1.png|thumb|500px|center]] | |||
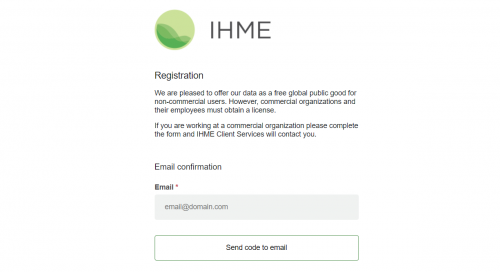
Before pulling IHME data, you need to register for an account to access it. Click "Register" and the following page will formulate. | |||
[[File:Step05-registration page1.png|thumb|500px|center]] | |||
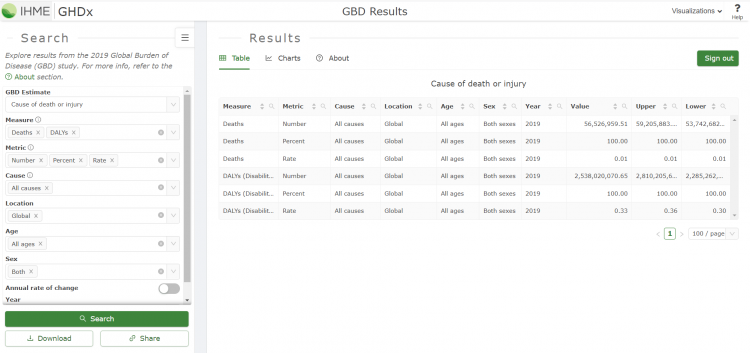
After finishing the registration and signing in to your account. The main page will formulate. | |||
[[File:Step04.png|thumb|750px|center|GBD Results Page]] | |||
}} | |||
==VARIABLE EXAMPLE: SeriesInfMortRateIHME== | |||
{{Inline block | width = 38 cm| style = border: 1px solid #a2a9b1; padding: 0.5em; margin: 0.5em; flex = 38em; |2 = div|<br> | |||
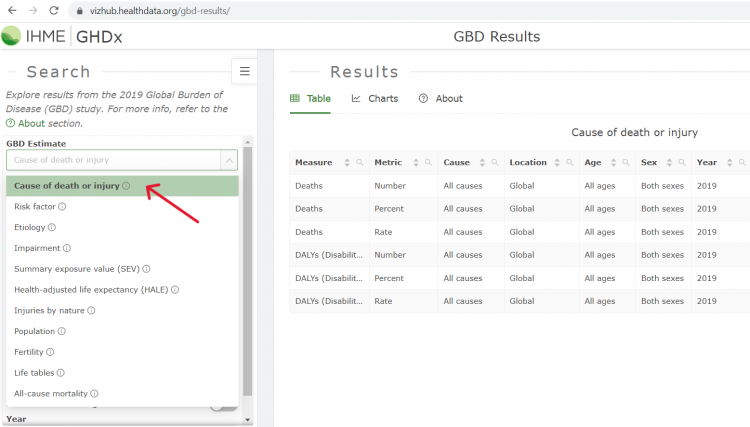
Step 6.) Click the arrow below the indicator <GBD Estimate> on the left side. You will then have the option to click "Cause of Death or Injury", "Risk Factor", "Etiology", etc. To narrow down the indicator, select the options you are looking for. As an example, click the option (e.g., "Cause of Death or Injury") of GBD Estimate and the table will formulate on the right side. | |||
[[File:Step05-GBD Estimate.png|thumb|750px|center]] | |||
}} | |||
{{Inline block | width = 38 cm| style = border: 1px solid #a2a9b1; padding: 0.5em; margin: 0.5em; flex = 38em; |2 = div|<br> | |||
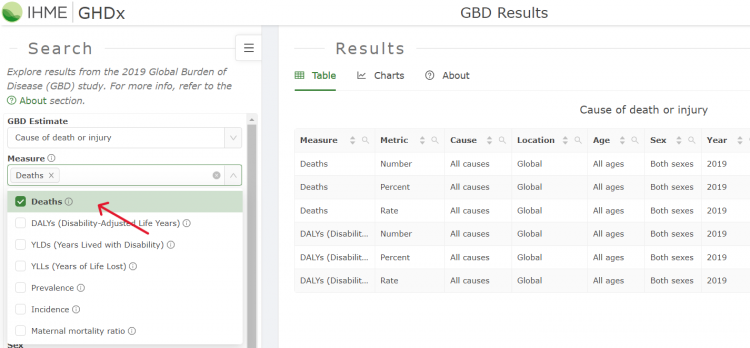
Step 7.) To adjust the indicator <Measure> you are pulling, click the arrow below the indicator <Measure> on the left side. You will then have multiple options to choose. As an example, click the option "Deaths". | |||
[[File:Step05-GBD Measure.png|thumb|750px|center]] | |||
}} | |||
{{Inline block | width = 38 cm| style = border: 1px solid #a2a9b1; padding: 0.5em; margin: 0.5em; flex = 38em; |2 = div|<br> | |||
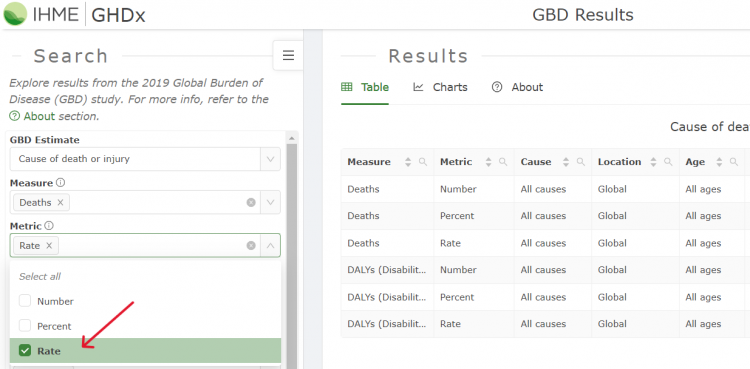
Step 8.) To adjust the indicator <Metric>, click the arrow below the indicator <Metric> on the left side. You will then have multiple options to choose. As an example, click the option "Rate". | |||
[[File:Step05-GDB Metric.png|thumb|750px|center]] | |||
}} | |||
{{Inline block | width = 38 cm| style = border: 1px solid #a2a9b1; padding: 0.5em; margin: 0.5em; flex = 38em; |2 = div|<br> | |||
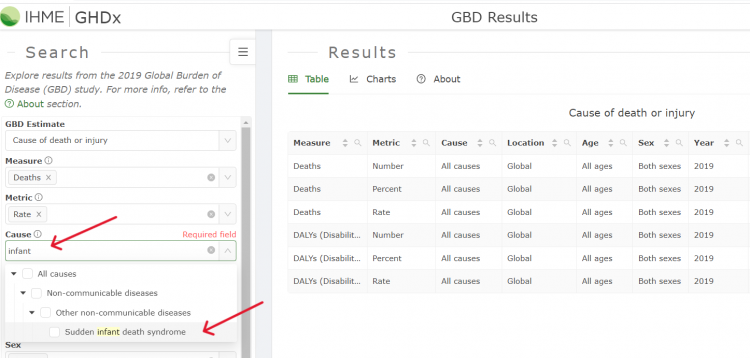
Step 9.) To adjust the indicator <Cause>, type in "infant" in the box below the <Cause> option. Then, you will have multiple options to choose from. Click the option "Sudden infant death syndrome". | |||
[[File:Step9 Population.png|thumb|750px|center]] | |||
}} | |||
{{Inline block | width = 38 cm| style = border: 1px solid #a2a9b1; padding: 0.5em; margin: 0.5em; flex = 38em; |2 = div|<br> | |||
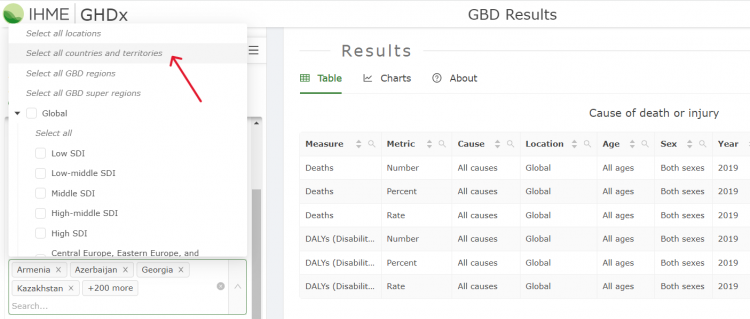
Step 10.) To adjust the indicator <Location>, click the arrow below the indicator <Location> on the left side. You will then have multiple options to choose. Click the option "Select all countries and territories". | |||
[[File:Step10-GBD Location.png|thumb|750px|center]] | |||
}} | |||
{{Inline block | width = 38 cm| style = border: 1px solid #a2a9b1; padding: 0.5em; margin: 0.5em; flex = 38em; |2 = div|<br> | |||
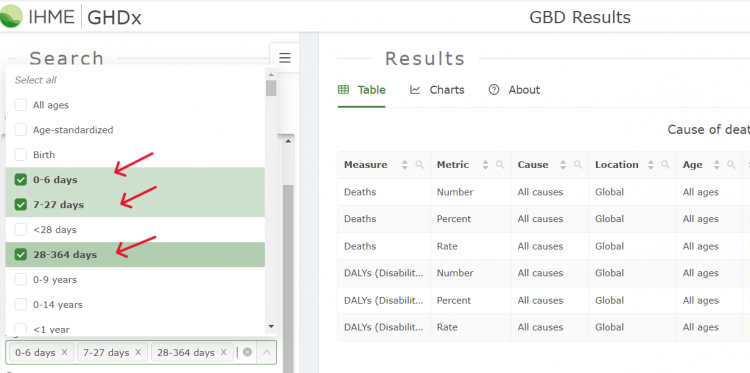
Step 11.) To adjust the indicator <Age>, click the arrow below the indicator <Age> on the left side. You will then have multiple options to choose from. Then, select three options: "0-6 days", "7-27 days", and "28-364 days". | |||
[[File:Step11 Population.png|thumb|750px|center]] | |||
}} | |||
{{Inline block | width = 38 cm| style = border: 1px solid #a2a9b1; padding: 0.5em; margin: 0.5em; flex = 38em; |2 = div|<br> | |||
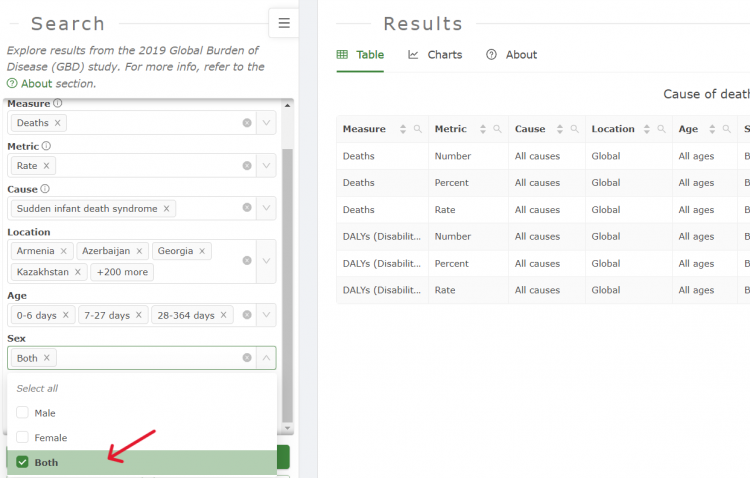
Step 12.) To adjust the indicator <Sex>, click the arrow below the indicator <Sex> on the left side. You will then have three options to choose from. Click the last option "Both". | |||
[[File:Step12 Population.png|thumb|750px|center]] | |||
}} | |||
{{Inline block | width = 38 cm| style = border: 1px solid #a2a9b1; padding: 0.5em; margin: 0.5em; flex = 38em; |2 = div|<br> | |||
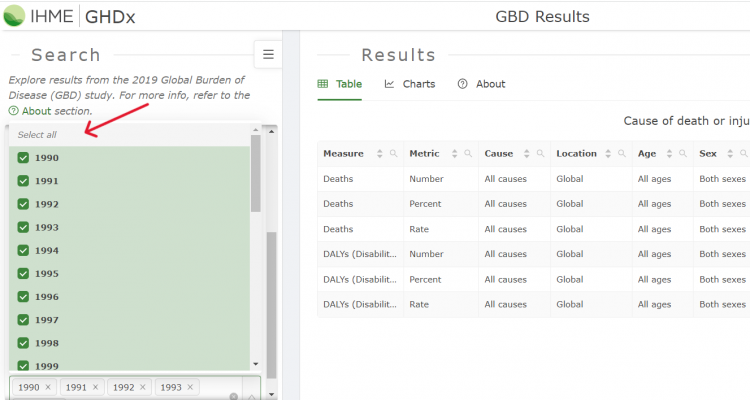
Step 13.) To adjust the indicator <Year> you are pulling, click the arrow below the indicator <Year> on the left side. You will then have multiple options to choose from. Click the option "Select all" will select all years' records. | |||
[[File:Step13-GBD Year.png|thumb|750px|center]] | |||
}} | |||
{{Inline block | width = 38 cm| style = border: 1px solid #a2a9b1; padding: 0.5em; margin: 0.5em; flex = 38em; |2 = div|<br> | |||
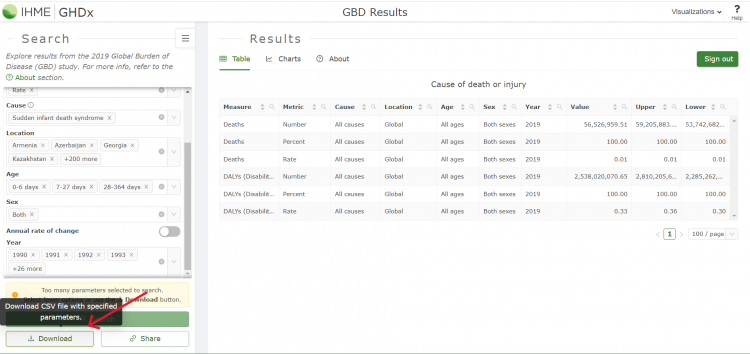
Step 14.) To download all CSV files with those specified parameters, click <Download> in the left bottom corner. | |||
[[File:Step14-0 Population.png|thumb|750px|center]] | |||
}} | |||
{{Inline block | width = 38 cm| style = border: 1px solid #a2a9b1; padding: 0.5em; margin: 0.5em; flex = 38em; |2 = div|<br> | |||
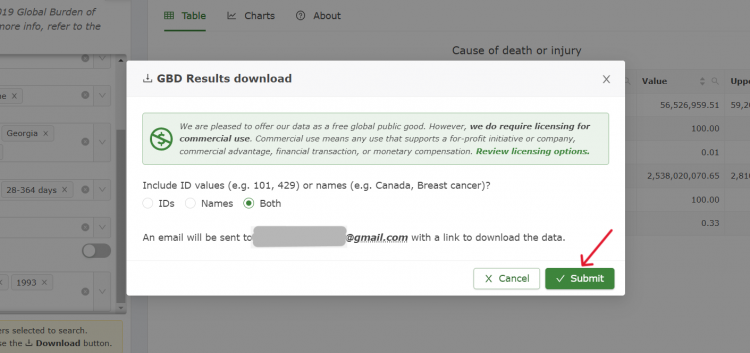
Step 15.) The following page will formulate. Next, you will have three included options: "IDs", "Names" and "Both". As an example, select "Both" and click "Submit". | |||
[[File:Step14-1 Population.png|thumb|750px|center]] | |||
}} | |||
{{Inline block | width = 38 cm| style = border: 1px solid #a2a9b1; padding: 0.5em; margin: 0.5em; flex = 38em; |2 = div|<br> | |||
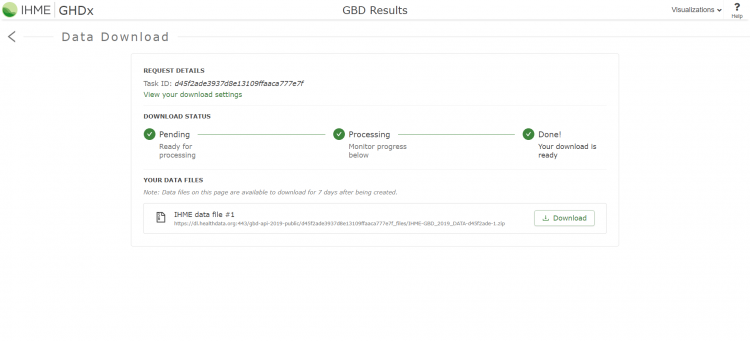
Step 16.) After system processing, you will receive a notification email and a link to access all pulled files through the registered email account. Clicking that link, a new webpage will formulate as below: | |||
[[File:Step15 Population.png|thumb|750px|center]] | |||
}} | |||
Latest revision as of 20:40, 8 February 2023
SUMMARY
The IHME dataset is from the GBD Results Tool, which is provided by the Institute for Health Metrics and Evaluation (IHME). IHME is an independent global health research center at the University of Washington. IHME gathers and provides many types of health-related data. Such as administrative data, census, demographic surveillance, disease registry, environmental monitoring, etc. The Global Burden of Disease (GBD) is a tool that provides a comprehensive picture of mortality and disability across countries, time, age, and sex. It quantifies health loss from hundreds of diseases, injuries, and risk factors worldwide. Because it's pulled from a free data source, it's imperative that the puller pay attention to the year of release, who the source uploader is, and what diseases cause death. These points are significant in ensuring that the calculation for the output of each country is accurate. GBD research incorporates both the prevalence of a given disease or risk factor and the relative harm it causes. The GBD is regularly updated with new data.
In particular, the data team uses this dataset in order to calculate for a couple indicators:
- GBD Estimate
- Measure
- Metric
- Cause
- Location
- Age
- Sex
- Year
By using these indicators, we calculate the death count of each cause of each gender group of a country across multiple age groups.
To pull data into IFs, please follow the instructions found in the Data Pull instructions below.
GENERAL STEPS TO PULL DATA FROM IHME
Step 2.) Click <Data tools and practices> at the top menu. Then, click <Data sources and downloads> will lead to a new page.
Step 5.) The following page will formulate.
Before pulling IHME data, you need to register for an account to access it. Click "Register" and the following page will formulate.
After finishing the registration and signing in to your account. The main page will formulate.
VARIABLE EXAMPLE: SeriesInfMortRateIHME
Step 6.) Click the arrow below the indicator <GBD Estimate> on the left side. You will then have the option to click "Cause of Death or Injury", "Risk Factor", "Etiology", etc. To narrow down the indicator, select the options you are looking for. As an example, click the option (e.g., "Cause of Death or Injury") of GBD Estimate and the table will formulate on the right side.
Step 7.) To adjust the indicator <Measure> you are pulling, click the arrow below the indicator <Measure> on the left side. You will then have multiple options to choose. As an example, click the option "Deaths".
Step 8.) To adjust the indicator <Metric>, click the arrow below the indicator <Metric> on the left side. You will then have multiple options to choose. As an example, click the option "Rate".
Step 9.) To adjust the indicator <Cause>, type in "infant" in the box below the <Cause> option. Then, you will have multiple options to choose from. Click the option "Sudden infant death syndrome".
Step 10.) To adjust the indicator <Location>, click the arrow below the indicator <Location> on the left side. You will then have multiple options to choose. Click the option "Select all countries and territories".
Step 11.) To adjust the indicator <Age>, click the arrow below the indicator <Age> on the left side. You will then have multiple options to choose from. Then, select three options: "0-6 days", "7-27 days", and "28-364 days".
Step 12.) To adjust the indicator <Sex>, click the arrow below the indicator <Sex> on the left side. You will then have three options to choose from. Click the last option "Both".
Step 13.) To adjust the indicator <Year> you are pulling, click the arrow below the indicator <Year> on the left side. You will then have multiple options to choose from. Click the option "Select all" will select all years' records.
Step 14.) To download all CSV files with those specified parameters, click <Download> in the left bottom corner.
Step 15.) The following page will formulate. Next, you will have three included options: "IDs", "Names" and "Both". As an example, select "Both" and click "Submit".
