June 2016 consolidation: Difference between revisions
No edit summary |
No edit summary |
||
| (One intermediate revision by the same user not shown) | |||
| Line 193: | Line 193: | ||
=== Military spending === | === Military spending === | ||
The biggest change in military spending (in absolute terms) after updating the SIPRI data is in the US. US military spending decreases from an initialized value of 4.4% to 3.51% (in 2014).[[File:USAMilSpending.jpg|frame|right|text-bottom|445x222px|Figure 1: US military spending in the Base Case and after adding SIPRI data.]] | The biggest change in military spending (in absolute terms) after updating the SIPRI data is in the US (Figure 1). US military spending decreases from an initialized value of 4.4% to 3.51% (in 2014).[[File:USAMilSpending.jpg|frame|right|text-bottom|445x222px|Figure 1: US military spending in the Base Case and after adding SIPRI data.]] | ||
=== Health spending === | === Health spending === | ||
| Line 205: | Line 205: | ||
== Education == | == Education == | ||
Papua New Guinea has a dramatic difference in its net intake rate at the primary level, the old 2014 value was 97.43. The new value is 29.64 in 2014. This is a decline from our 2012 data point of 54.79. There are a few other countries that show similar behavior (DRC, Madagascar, Vanuatu).[[File:PapuaPriIR.jpg|frame|right|text-bottom|445x222px|Figure 2: Change in primary intake rates in Papua New Guinea (June consolidation - Base Case)]] | Papua New Guinea has a dramatic difference in its net intake rate at the primary level, the old 2014 value was 97.43 (see Figure 2). The new value is 29.64 in 2014. This is a decline from our 2012 data point of 54.79. There are a few other countries that show similar behavior (DRC, Madagascar, Vanuatu).[[File:PapuaPriIR.jpg|frame|right|text-bottom|445x222px|Figure 2: Change in primary intake rates in Papua New Guinea (June consolidation - Base Case)]] | ||
== Infrastructure == | == Infrastructure == | ||
Latest revision as of 23:50, 1 July 2016
64 series were pulled into the IFs database in June 2016, 47 of which are preprocessor series. 42 of the series are education data, and were pulled directly from the UIS. Government consumption data for R&D, health, and military were all updated as well.
New data series
AQUASTAT - 10 series, 1 preprocessor (though many are useful in the agricultural water demand analysis and some may be read into the preprocessor in the future) - pulled by Kristen, vetted by Joel
| Variable |
|---|
| LandIrActual%Equip |
| LandIrAreaEquip |
| LandIrEquip%Cultivated |
| LandIrEquip%Potential |
| LandIrEquip%WaterManaged |
| LandIrEquipActual |
| LandIrEquipMixed |
| LandIrEquipSurface |
| LandIrPotential |
| WaterTotalAgManagedArea |
UIS - 42 series, some preprocessor - pulled by Mohammod, vetted by Kristen
| Variable |
|---|
| EdExpPri%GDPPC |
| EdExpSec%GDPPC |
| EdExpSecLowr%GDPPC |
| EdExpSecUppr%GDPPC |
| EdExpTer%GDPPC |
| EdPriAIRFemale% |
| EdPriAIRMale% |
| EdPriAIRTotal% |
| EdPriCompletionFemale% |
| EdPriCompletionMale% |
| EdPriCompletionTotal% |
| EdPriEnrollGrossFemalePcnt |
| EdPriEnrollGrossMalePcnt |
| EdPriEnrollGrossTotalPcnt |
| EdPriEnrollNetFemalePcnt |
| EdPriEnrollNetMalePcnt |
| EdPriEnrollNetTotalPcnt |
| EdPriNIRFemale% |
| EdPriNIRMale% |
| EdPriNIRTotal% |
| EdPriSurvivalFemale% |
| EdPriSurvivalMale% |
| EdPriSurvivalTotal% |
| EdPriTransition2Sec%Female |
| EdPriTransition2Sec%Male |
| EdPriTransition2Sec%Total |
| EdSecEnrollNet |
| EdSecEnrollNetFemale |
| EdSecEnrollNetMale |
| EdSecLowerEnrollGross%Female |
| EdSecLowerEnrollGross%Male |
| EdSecLowerEnrollGross%Total |
| EdSecUpperEnrollGross%Female |
| EdSecUpperEnrollGross%Male |
| EdSecUpperEnrollGross%Total |
| EdTerEnrollGross%Female |
| EdTerEnrollGross%Male |
| EdTerEnrollGross%Total |
| EdTerGradRate1stDegreeFemale% |
| EdTerGradRate1stDegreeMale% |
| EdTerGradRate1stDegreeTotal% |
| GovtEdPub%GDP |
WHO_Global_Health_Expenditure_Database - 3 series, preprocessor - Julianna pulled, Kristen vetted
| Variable |
|---|
| HealthExpGov%Tot |
| HealthExpPriv%Tot |
| HealthExpTot%GDP |
ITU - 3 series - pulled by Joel, vetted by Caleb
| Variable |
|---|
| ICTBroadbandSubscribersPer100ITU |
| ICTTelephoneCellSubscribersPer100 |
| ICTTelephoneLinesPer100 |
UNESCO - 1 series - pulled by Julianna, vetted by Kristen
| Variable |
|---|
| R&DGovt%GDP |
SIPRI - 3 series, some preprocessor - pulled by Caleb, vetted by Joel
| Variable |
|---|
| GovtMil%GDPBlendACDASIPRI |
| GovtMil%GDPBlendACDASIPRIwEstimates |
| GovtMil%GDPSIPRI |
WHO_Tobacco_Free_Initiative_(TFI) - 2 series - pulled by Joel, vetted by Caleb
| Variable |
|---|
| HealthSmokingPrevalenceWHOFemales% |
| HealthSmokingPrevalenceWHOMales% |
Affected modules
Government finance
Military spending
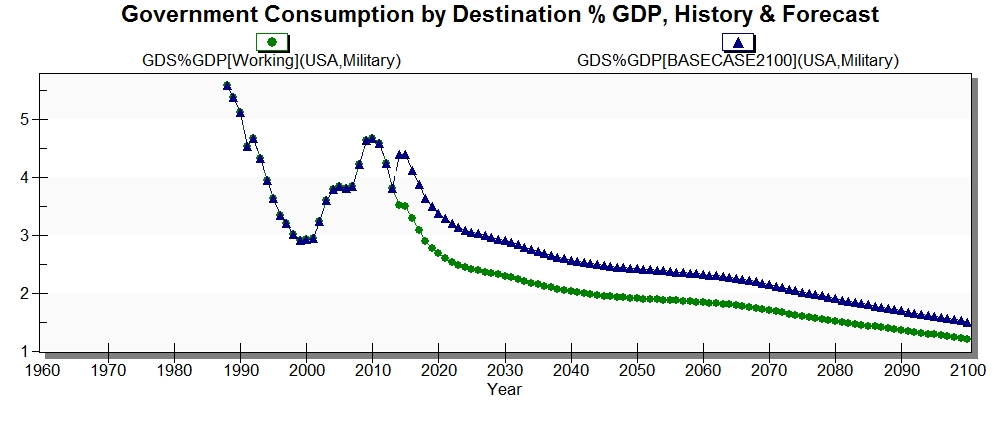
The biggest change in military spending (in absolute terms) after updating the SIPRI data is in the US (Figure 1). US military spending decreases from an initialized value of 4.4% to 3.51% (in 2014).
Health spending
The largest change in health spending (as a percent of GDP) is in UAE. This also leads to one of the largest changes in absolute health spending. Total health spending in UAE increases from 249 to 326 billion USD in 2100.
Education spending
The largest change in total education costs (as a percent of GDP) at any point in the timeline occurs in Lithuania. It occurs in 2019 and appears to be driven by a decrease in enrollment. Specifically, tertiary enrollment is significantly lower in the new forecast due to data.
Education
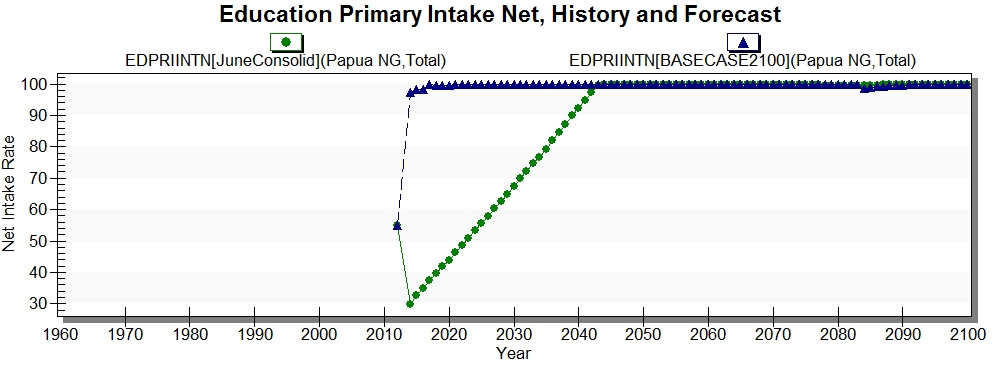
Papua New Guinea has a dramatic difference in its net intake rate at the primary level, the old 2014 value was 97.43 (see Figure 2). The new value is 29.64 in 2014. This is a decline from our 2012 data point of 54.79. There are a few other countries that show similar behavior (DRC, Madagascar, Vanuatu).
Infrastructure
The Central African Republic sees one of the most extreme and sustained differences between the previous version and this one in ICT mobile broadband subscriptions. At its peak, the values in 2030 are almost 30 subscriptions lower per 100. The difference starts in 2022.
Bugs and issues
Previous Issues
- All fish dimensions seem to be missing formulas when trying to view "history and forecast"
- Still seems to be a problem for "Agricultural production, history and forecast - million metric tons"
- Many agricultural series have a gap in the data because the food balance sheets end in 2011/12 and the new base year is 2014.
- There is no historical analog (for Indonesia) for "population per hectare of crop land (urban)"
- Still an issue
- Transient in 1998 in GDP (both MER and PPP) for Indonesia
- No historical analog for VADD of energy and materials for Indonesia
- VADD for Indonesia for all sectors jumps around
- Transient in initial year of HDI(new) for Indonesia
- Transient in initial year of GINIDOM for Indonesia
- No historical analog for government consumption by destination as a percent of GDP for InfraOther for Indonesia
- No historical analog for GovRev%GDP for Indonesia
- Transient in initial year of INCOMELT200LN2005 for Indonesia
- Transients in inital year of primary intake in Indonesia
- Gaps in ENDEM because data not up-to-date
- No historical analog for reserve to production ratio for Indonesia for hydro
- No historical analog for ICTCONSURPLUS for Indonesia
- Transients for intialized values of HIVRATE, AIDS death rate, and AIDSDTHS for Indonesia
- "Invalid dimension 2 parameters" for "HD Multivariate Report with Land" for Indonesia
- The "infrastructure overview" category produces a "Run-time error 3021: No current record" error when clicked
- Seems to be fixed
- Equation used to estimate solid fuel use should be updated with new electricity access data (see above)
- Diabetes and IGT hole filling equations should be updated with new data (see above)
- HIV issues raised in previous consolidation
Issues raised during Indonesia training (from Dave)
- All source names in DataDict need to be more explicit
- Some links in Block Diagram are broken
- Update corruption to use new CPI (chain and/or re-specify)
- Selecting Display Categories: Infrastructure Assumptions causes failure.
- GOVSEC has some counter-intuitive initializations (probably estimation issue for missing data)
- Radial Graph does not advance and does not properly show more than 4 counties (was using security, capacity, inclusions) — changing number of variables did not help.
- Agricultural Investment doesn’t impact Crop Land
- ENP only seems to initialize with EnProdGeothermalIEA
- Indonesia less than $2 per day is higher than $3.10 historically (IncBelow2DWDI2011 and IncBelow3DWDI). Large transient with INCLT200LN2005
- HDI transient in 2014
- Malnourished population transient in 2014
- Category Infrastructure Overview and Infrastructure Something break the model if you select display lists within them (maybe just certain display lists?)
- Takes hours to break out into subregions
- Window’s regionalization (not just language) must be set to USA or else the model encounters a number of issues with the GUI (I believe this is related to how the computer reads and displays dates.
- GDPGR transients after it goes endogenous
- Drop the number 2 in the Severe Acute Malnutrition Display Category
- WATSAFE Piped and OthImproved forecast trend is quite different from data (for Indonesia)
- Display variable "FDI Inflows as Percent of GDP, Hist & Fore” doesn't show a historical analog
- "Health costs" in specialized displays spelt incorrectly
- WORKAGERETIREND is initalized at 70 rather than 65

