Version 8.01 (June 12th, 2023): Difference between revisions
Jump to navigation
Jump to search
Norah.Shamin (talk | contribs) No edit summary |
Norah.Shamin (talk | contribs) No edit summary |
||
| Line 1: | Line 1: | ||
[[Version 8. | [[Version 8.00 (June 1st, 2023)|PREVIOUS VERSION]] | [[Index Page For All Other Version Notes|INDEX PAGE]] | [[Version 8.02 (June 29th, 2023)|NEXT VERSION]] | ||
You can download IFs Version 8.01 at [https://ifs02.du.edu/IFs%20with%20Pardee%208_01%20June%2012%202023.zip 8.01]. | You can download IFs Version 8.01 at [https://ifs02.du.edu/IFs%20with%20Pardee%208_01%20June%2012%202023.zip 8.01]. | ||
Revision as of 20:49, 2 April 2024
PREVIOUS VERSION | INDEX PAGE | NEXT VERSION
You can download IFs Version 8.01 at 8.01.
Interface Updates
- Fix on Drivers diagram
- Saving tab open option
- Updating Earliest and Most Recent from .NET
Model Updates
- Saving new formulations for Labor Tables in TablFunc.db
- Saving results to ifsHistSeries for Smoking Impact and Conflict from .NET
- Fix on handling groups with 2 dimensions in ifs.dat
- Handle clpcm impacts before hunger elimination impacts.
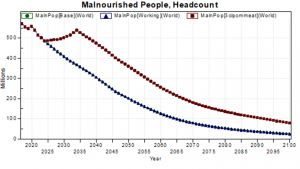
- Below is the problem identified by Jonathan in behavior of IFs to an effort to decrease meat consumption using clpcm, meat. It was causing a bulge in malnourished people. Red is the result of Jonathan’s .sce file, green is base, and blue overlapping green is my own run of the scenario after my code fix.
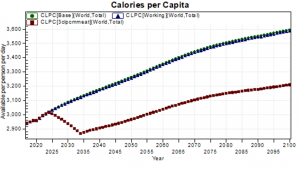
- The problem I [Jonathan] identified was that the decrease in calories from meat was causing a decrease overall (see below), rather than a shift from meat to crops and fish. In the code I attach, added a normalization of total calories back to the level before application of the multiplier, therefore causing that shift. José, I also added commented out code referencing clpcm category 4 (total). When clpcm is re-dimensioned to 4 from current 3, that code can be activated allowing the user control over total calories, not just the distribution by source.
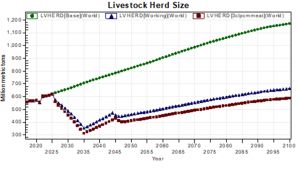
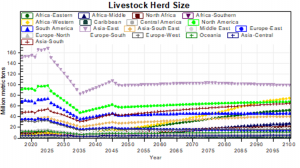
- So what are the forward effects of the intervention. One is change in the livestock herd size, below. The pattern of change is messy because mostly I think of the pattern of introduction of the multiplier in the .sce file (at least for the first leg down; the bubble about 2045 I am not so sure about, but suspect is the same issue, reinforced by the fact that the bubble pattern shows up in all regions).
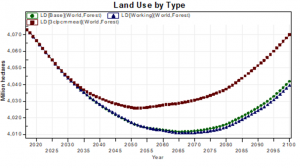
- One environmental effect that would be expected, is that less livestock need for grazing land and livestock feed from crop land would allow some forest increase. We can see that in the graph below.
- So in combination with the message I sent earlier about how to address the problem of malnutrition surge in late century due to an overly aggressive parameter change in the direct multiplier on forest area (forestm), I think I have addressed the elements of the emerging GEO7 scenario set around gross problems in malnutrition forecasts.
