Use IFs (Download): Education: Difference between revisions
No edit summary |
(additional edits) |
||
| (One intermediate revision by the same user not shown) | |||
| Line 1: | Line 1: | ||
= <span style="font-size:xx-large;">Education by Age, Sex, and Level</span> = | = <span style="font-size:xx-large;">Education by Age, Sex, and Level</span> = | ||
Learn more about the [https://pardeewiki.du.edu/index.php?title=Education Education] model on IFs. | |||
Education by Age, Sex | To access the ''Education by Age, Sex and Level'' option, select Display from the Main Menu, then select sub-option Specialized Display and then ''Education by Age, Sex and Level''. It is also accessible through the [[Main Menu Map]] options. | ||
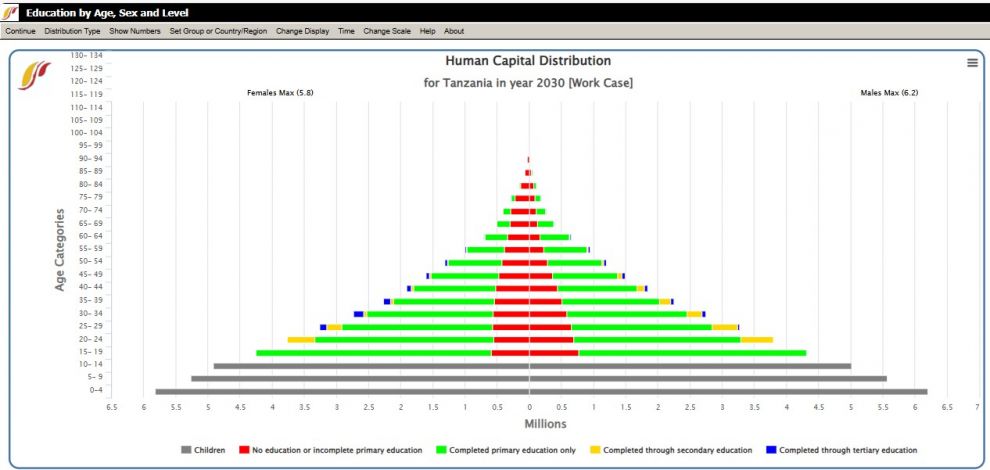
''Education by Age, Sex and Level'' display is broken down into levels of educational attainment with each level of attainment being distinguished by a different color. Educational attainment is broken down as follows: no formal education, primary education, secondary education, tertiary education and those too young to achieve formal education. Check with the legend at the bottom of the graph to see what colors represent each level of educational attainment. | |||
From this display there are several features and options that can be accessed using the menu bar at the top of the screen. | |||
[[File:Tanzania 2030 Education by Sex.jpg|center|thumb|990x990px|Projected educational attainment in Tanzania in 2020]] | |||
These options and features include: | |||
* '''[[Repeated Features#General%20Display%20Options|Continue]]:''' To go back to the previous menu or to the Main Menu of IFs. | |||
* '''Distribution Type:''' Select other types of Education charts to be displayed through clicking on one of the following sub-options. | |||
** All levels of education for all age cohorts | |||
** No completed formal education | |||
** Primary, Secondary or Tertiary education levels | |||
** Labor cohorts by level of education disaggregated by male, female or both | |||
** '''Compare Countries:''' Compares four charts for different countries, years, or scenarios; or any combination of the three. This option will initially bring up four charts for the country and distribution type most recently displayed for the next four 5-year increments for example 2030, 2035, 2040 and 2045. At the bottom of the compare countries screen, select which country, year and scenario desired to be displayed for each of the four graphs; after adjusting click Refresh to change the displays. To switch to a different type of education chart to compare, click Distribution Type from the menu bar and click the desired distribution. | |||
* '''Show Numbers:''' Displays the underlying data for the graph in the table format, broken down by educational level, gender, and age cohort. This gives a detailed view of the exact values represented visually. Users can export or print the data through Print Numbers and Save Numbers features. | |||
* '''Set Group or Country/Regions:''' Select one of the following categories: | |||
** Countries/Regions | |||
** Groups | |||
** Hide Non Core Groups | |||
* '''Change Display:''' Select type of display through clicking on one of the following sub-options | |||
** Countries/Regions: A list will appear; scroll down and then click on the country of interest. | |||
** Set Year: A list will appear; scroll down and then click on the year of interest | |||
** Change Scenario: Analyze how alternative pathways impact educational attainment, and select different scenarios, including Base Case, Working Case, and pre-defined scenarios such as SSP1 to SSP5 or SDG Push. | |||
* '''Time''': Project graphs through time using the Advance and Regress options | |||
* '''Change Scale:''' Customize the graph’s scale with following options: | |||
** Fix Constant Scale across Time and Regions to standardize comparisons | |||
** Fix Constant Scale across Time to track changes within a single region over time | |||
** Fix Constant Scale Manually for user-defined scale adjustment | |||
** Use Percent of Population | |||
* '''Help:''' Brings the user to the corresponding page in the [[Main Page|Pardee Wiki]] with the current feature or display they are on. | |||
* '''About:''' Not functioning in current version of IFs | |||
= <span style="font-size:xx-large;">Costs of Education Goals</span> = | = <span style="font-size:xx-large;">Costs of Education Goals</span> = | ||
This Specialized Display feature can be | This Specialized Display feature can be accessed from the Display option on the main menu of IFs, followed by Specialized Display, and then Costs of Education Goals. | ||
From here, users can identify the costs of achieving selected educational attainment goals for different units of countries or groups. On the left hand side of the display, users can select a country to examine. Change this list to a list of Groups, G-Lists (custom group lists created for specific analysis) or Decomposed groups by toggling the '''Group Options''' at the top of this menu. After selecting a country, choose one of the Scenarios that are pre-loaded into IFs. | |||
After choosing a country or group as well as a run-file, next define educational attainment goals by specifying the percentage of total enrollment for primary, secondary or tertiary education and set the Start and Target years. | |||
The '''Use Constant Cost''' option fixes the per-student cost at the base year level throughout the analysis period and prevents cost changes over time from influencing the results. Similarly, the '''Use Constant Enrollment''' option holds enrollment levels constant, regardless of other scenario adjustments. These features help to isolate specific variables, such as population growth or spending priorities, without the results being affected by cost or enrollment fluctuations. | |||
The '''Display Format''' tool on the menu offers further customization, such as editing graph titles, selecting the display year or time intervals, and configuring axes or gridlines. Users can also adjust the currency for cost analysis and modify the time horizon for scenarios. | |||
[[File: | Once parameters are set, click any of the boxes at the bottom of this display option and these variables will be loaded into the variable display box. Finally, choose your output: either a table, line graph or bar graph to visualize your results. | ||
[[File:Scale-up Cost Display Window.png|center|thumb|973x973px|Scale-up Cost Display Window]] | |||
Latest revision as of 00:15, 14 February 2025
Education by Age, Sex, and Level
Learn more about the Education model on IFs.
To access the Education by Age, Sex and Level option, select Display from the Main Menu, then select sub-option Specialized Display and then Education by Age, Sex and Level. It is also accessible through the Main Menu Map options.
Education by Age, Sex and Level display is broken down into levels of educational attainment with each level of attainment being distinguished by a different color. Educational attainment is broken down as follows: no formal education, primary education, secondary education, tertiary education and those too young to achieve formal education. Check with the legend at the bottom of the graph to see what colors represent each level of educational attainment.
From this display there are several features and options that can be accessed using the menu bar at the top of the screen.
These options and features include:
- Continue: To go back to the previous menu or to the Main Menu of IFs.
- Distribution Type: Select other types of Education charts to be displayed through clicking on one of the following sub-options.
- All levels of education for all age cohorts
- No completed formal education
- Primary, Secondary or Tertiary education levels
- Labor cohorts by level of education disaggregated by male, female or both
- Compare Countries: Compares four charts for different countries, years, or scenarios; or any combination of the three. This option will initially bring up four charts for the country and distribution type most recently displayed for the next four 5-year increments for example 2030, 2035, 2040 and 2045. At the bottom of the compare countries screen, select which country, year and scenario desired to be displayed for each of the four graphs; after adjusting click Refresh to change the displays. To switch to a different type of education chart to compare, click Distribution Type from the menu bar and click the desired distribution.
- Show Numbers: Displays the underlying data for the graph in the table format, broken down by educational level, gender, and age cohort. This gives a detailed view of the exact values represented visually. Users can export or print the data through Print Numbers and Save Numbers features.
- Set Group or Country/Regions: Select one of the following categories:
- Countries/Regions
- Groups
- Hide Non Core Groups
- Change Display: Select type of display through clicking on one of the following sub-options
- Countries/Regions: A list will appear; scroll down and then click on the country of interest.
- Set Year: A list will appear; scroll down and then click on the year of interest
- Change Scenario: Analyze how alternative pathways impact educational attainment, and select different scenarios, including Base Case, Working Case, and pre-defined scenarios such as SSP1 to SSP5 or SDG Push.
- Time: Project graphs through time using the Advance and Regress options
- Change Scale: Customize the graph’s scale with following options:
- Fix Constant Scale across Time and Regions to standardize comparisons
- Fix Constant Scale across Time to track changes within a single region over time
- Fix Constant Scale Manually for user-defined scale adjustment
- Use Percent of Population
- Help: Brings the user to the corresponding page in the Pardee Wiki with the current feature or display they are on.
- About: Not functioning in current version of IFs
Costs of Education Goals
This Specialized Display feature can be accessed from the Display option on the main menu of IFs, followed by Specialized Display, and then Costs of Education Goals.
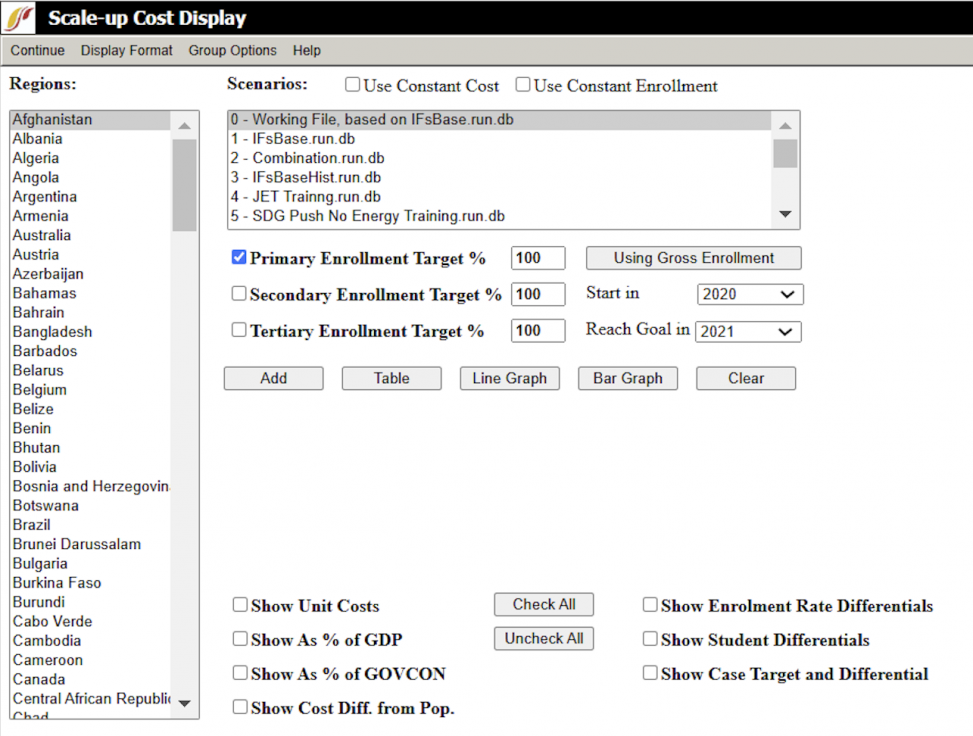
From here, users can identify the costs of achieving selected educational attainment goals for different units of countries or groups. On the left hand side of the display, users can select a country to examine. Change this list to a list of Groups, G-Lists (custom group lists created for specific analysis) or Decomposed groups by toggling the Group Options at the top of this menu. After selecting a country, choose one of the Scenarios that are pre-loaded into IFs.
After choosing a country or group as well as a run-file, next define educational attainment goals by specifying the percentage of total enrollment for primary, secondary or tertiary education and set the Start and Target years.
The Use Constant Cost option fixes the per-student cost at the base year level throughout the analysis period and prevents cost changes over time from influencing the results. Similarly, the Use Constant Enrollment option holds enrollment levels constant, regardless of other scenario adjustments. These features help to isolate specific variables, such as population growth or spending priorities, without the results being affected by cost or enrollment fluctuations.
The Display Format tool on the menu offers further customization, such as editing graph titles, selecting the display year or time intervals, and configuring axes or gridlines. Users can also adjust the currency for cost analysis and modify the time horizon for scenarios.
Once parameters are set, click any of the boxes at the bottom of this display option and these variables will be loaded into the variable display box. Finally, choose your output: either a table, line graph or bar graph to visualize your results.

