Repeated Features: Difference between revisions
CamrynDreyer (talk | contribs) No edit summary |
CamrynDreyer (talk | contribs) No edit summary |
||
| Line 27: | Line 27: | ||
If you have selected one or more variables for display in '''[http://www.du.edu/ifs/help/use-online/display/selfmanaged/index.html Self-Managed Display],''' it will appear in status box at bottom of the form. If you left-click on the name of a variable in the status box, a new box (shown below) will appear with a large set of options that can help you learn more about the variable (or simply to delete it from the status box). | If you have selected one or more variables for display in '''[http://www.du.edu/ifs/help/use-online/display/selfmanaged/index.html Self-Managed Display],''' it will appear in status box at bottom of the form. If you left-click on the name of a variable in the status box, a new box (shown below) will appear with a large set of options that can help you learn more about the variable (or simply to delete it from the status box). | ||
[[File:Define3.png]] | [[File:Define3.png|RTENOTITLE]] | ||
A subset of these same options can be obtained from the '''[http://www.du.edu/ifs/help/use-online/scenario/quick/overview.html Quick Scenario Analysis with Tree] '''form by using either a left-click or right-click on a list of parameters within the tree: | A subset of these same options can be obtained from the '''[http://www.du.edu/ifs/help/use-online/scenario/quick/overview.html Quick Scenario Analysis with Tree] '''form by using either a left-click or right-click on a list of parameters within the tree: | ||
[[File:Define1.png]] | [[File:Define1.png|RTENOTITLE]] | ||
There is an option to '''search''' for variables and parameters in several locations of the interface, including within Self-Managed Display and the Quick Scenario Analysis with Tree forms. When the search returns a list of parameters or variables as below, a click on any in the list provides explanatory pop-up options (when the browser has enabled pop-ups): | There is an option to '''search''' for variables and parameters in several locations of the interface, including within Self-Managed Display and the Quick Scenario Analysis with Tree forms. When the search returns a list of parameters or variables as below, a click on any in the list provides explanatory pop-up options (when the browser has enabled pop-ups): | ||
[[File:Define2.png]] | [[File:Define2.png|RTENOTITLE]] | ||
However you reach these explanatory options, here is what they provide: | |||
Define: This option generates a window that will define the variables that are being displayed. | |||
Drivers (Linkages): This option generates a window that graphically displays the drivers of the variable selected (backward linkages or causes) and also the forward linkages or variables driven by it. That is, the form will include a diagram showing the variable in the center and the variables from which it is computed on the left plus the variables to which it contributes on the right. This drivers diagram is derived directly from parsing the computer code of the model. If you float the cursor over any variable name on this screen, a more extended name (or a brief definition) will pop up. You will be able to see these definitions by selecting Show Definitions under the Variables option as well. If you double click on any driver variable or driven variable, the diagram will repaint with the variable selected at the middle. Select Continue to return to the previous screen. | |||
View Historic Analog Variable: This option shows the name of the variable in historical data, if any, that is associated with a forecasted variable in IFs. For instance, if you select the forecast variable POP, it will show that the name of the analog in the data files is Population. | |||
Delete: This option allows you to clear the selected variable/parameter from this box. | |||
View Equations: Selecting this option will bring up a help page that shows the equations used in computing the variable selected. | |||
Explain (Block Diagram): Selecting this option will bring up a help page that shows a diagram that broadly explains how drivers interact for the area of inquiry (agriculture, economics, etc.) that you have displayed in your table. There normally is also textual explanation. | |||
View Code: Select this feature and a new page will be opened that shows the computer code used to express the calculation of these drivers and their interaction in IFs. | |||
Cancel: This option allows you to cancel your selection and return to the previous screen. | |||
= General Display Options = | = General Display Options = | ||
= Computations = | = Computations = | ||
Revision as of 17:01, 21 July 2017
Explain Scenario (Annotation)
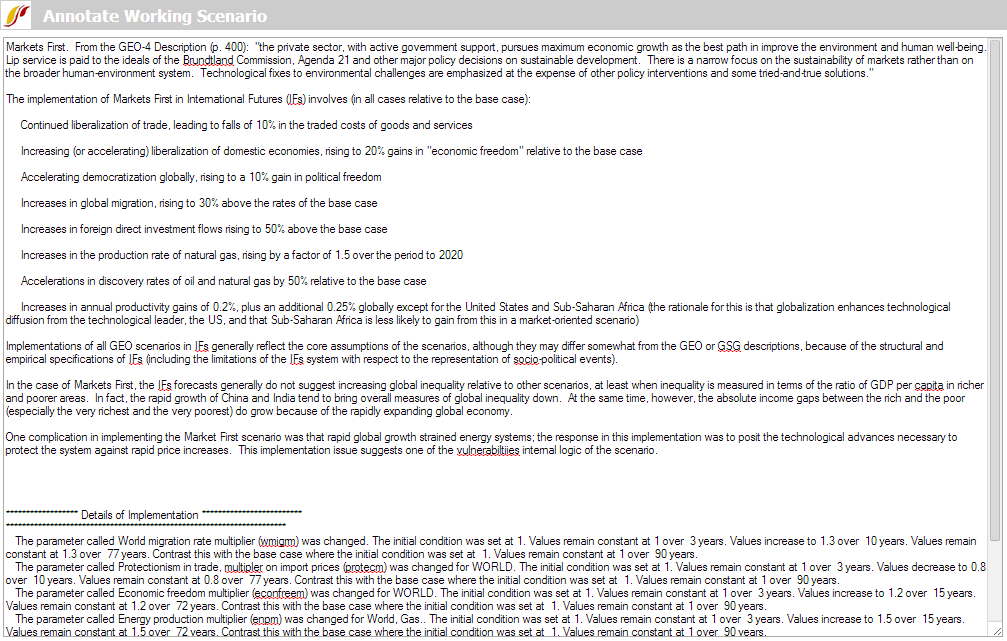
This feature of IFs allows users to quickly display an annotation of different Run-Result-Files (.run file) and Scenario-Load-Files (.sce file) to understand exactly what parameters have been altered and how they were altered. When you see an Explain Scenario option, be sure to highlight the Run-Result-File or Scenario-Load-File that you would like to more clearly understand and click on Explain Scenario. The ensuing page (similar to the image below) will appear after a moment (because IFs is going online to retrieve the information you are looking for) that will show you specifically what interventions have been made in the Run-Result-File or Scenario-Load-File that you have chosen.
Country/Region, Group or Geography-List
186 countries underpin the functioning of IFs and these countries can be displayed separately or as parts of larger groups that users can determine.
Below is a visual representation of how different entities are organized into Countries/Regions, Groups or Geography-Lists.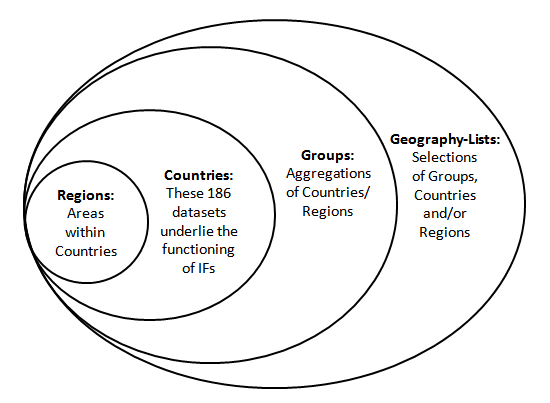
Countries/Regions are currently the smallest geographical unit that users can represent. There are 186 different countries/regions that users can display. But the ability to split countries down into smaller regions like states, provinces, or districts is under development and only available for selected countries (South Africa, India, China, and Mexico). Moreover, it is only available in the stand-alone model version, not in the online version.
*Important Note: In older versions of IFs, Regions were used as intermediaries between Countries and Groups. That use of the term Regions is no longer relevant and when you see Country/Region references in the online version of the model you should simply think of this as a term that really means Country.
Groups are variably organized geographically or by memberships in international institutions/regimes. You can find out the countries represented in each group by exploring the Identify Group or Country/Region Members sub-option under Data Analysis from the Main Menu.
IFs also features a grouping option titled Decomposed Groups that allows users to select a group and display forecasts or data for individual member countries of that group. Decomposed Group options are located in several IFs display forms, including the Flexible Displays.
Geography Lists (or G-Lists) can contain Countries, Groups, or both. The Geography-List can be useful as some users may want to place, for example, the Africa group in a display with the country of India.
When using IFs, there are many occasions where the user is asked whether or not they would like to display their results as a product of single countries, or larger groups. This is typically a toggle switch that moves between Country/Region and Groups; however, it might be a three-way-toggle that includes Country/Region, Group and Geography-List.
Define, Drivers, Explain, View Equations, View Code, and Delete
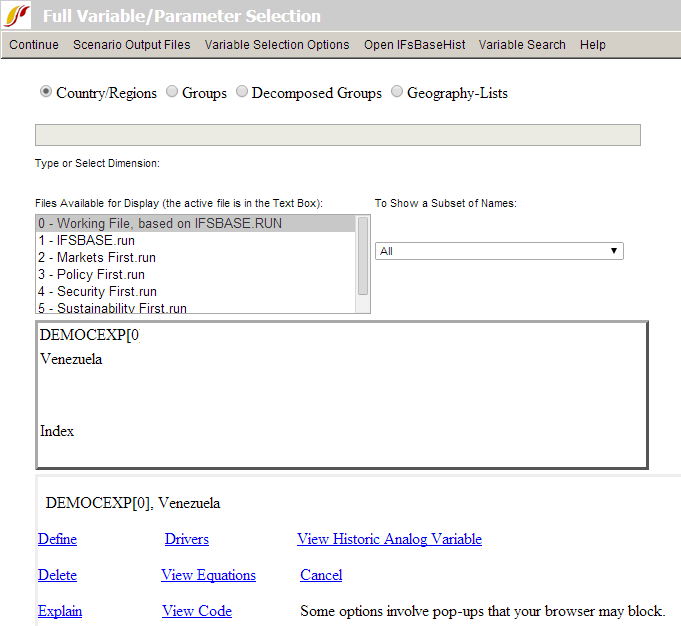
If you have selected one or more variables for display in Self-Managed Display, it will appear in status box at bottom of the form. If you left-click on the name of a variable in the status box, a new box (shown below) will appear with a large set of options that can help you learn more about the variable (or simply to delete it from the status box).
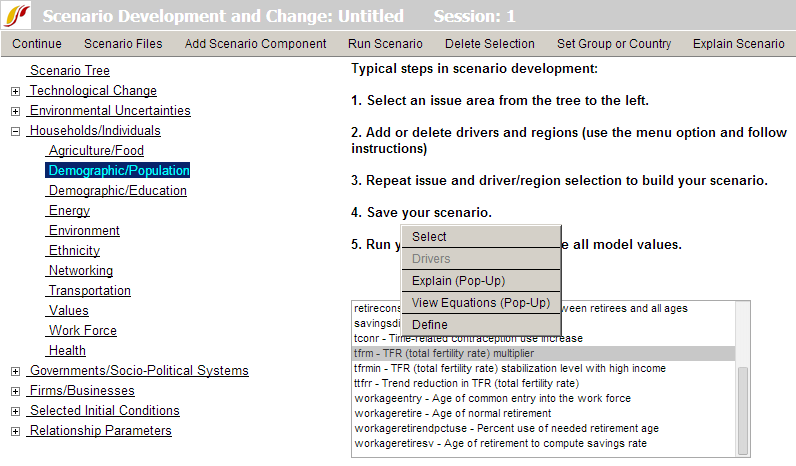
A subset of these same options can be obtained from the Quick Scenario Analysis with Tree form by using either a left-click or right-click on a list of parameters within the tree:
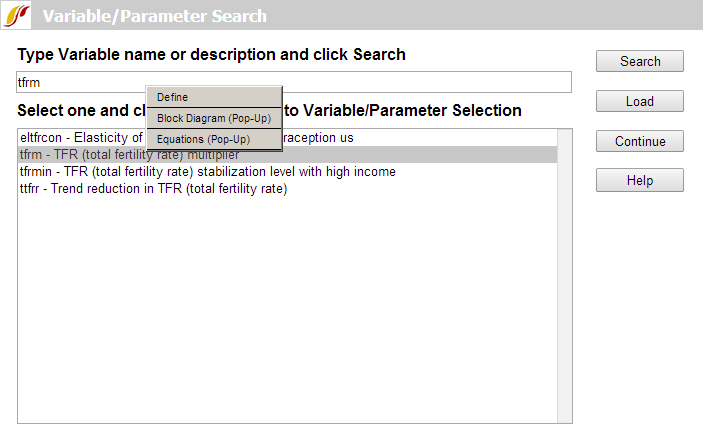
There is an option to search for variables and parameters in several locations of the interface, including within Self-Managed Display and the Quick Scenario Analysis with Tree forms. When the search returns a list of parameters or variables as below, a click on any in the list provides explanatory pop-up options (when the browser has enabled pop-ups):
However you reach these explanatory options, here is what they provide:
Define: This option generates a window that will define the variables that are being displayed.
Drivers (Linkages): This option generates a window that graphically displays the drivers of the variable selected (backward linkages or causes) and also the forward linkages or variables driven by it. That is, the form will include a diagram showing the variable in the center and the variables from which it is computed on the left plus the variables to which it contributes on the right. This drivers diagram is derived directly from parsing the computer code of the model. If you float the cursor over any variable name on this screen, a more extended name (or a brief definition) will pop up. You will be able to see these definitions by selecting Show Definitions under the Variables option as well. If you double click on any driver variable or driven variable, the diagram will repaint with the variable selected at the middle. Select Continue to return to the previous screen.
View Historic Analog Variable: This option shows the name of the variable in historical data, if any, that is associated with a forecasted variable in IFs. For instance, if you select the forecast variable POP, it will show that the name of the analog in the data files is Population.
Delete: This option allows you to clear the selected variable/parameter from this box.
View Equations: Selecting this option will bring up a help page that shows the equations used in computing the variable selected.
Explain (Block Diagram): Selecting this option will bring up a help page that shows a diagram that broadly explains how drivers interact for the area of inquiry (agriculture, economics, etc.) that you have displayed in your table. There normally is also textual explanation.
View Code: Select this feature and a new page will be opened that shows the computer code used to express the calculation of these drivers and their interaction in IFs.
Cancel: This option allows you to cancel your selection and return to the previous screen.
