Geographically-fixed Displays (Download): Difference between revisions
CamrynDreyer (talk | contribs) No edit summary |
No edit summary |
||
| (2 intermediate revisions by the same user not shown) | |||
| Line 3: | Line 3: | ||
This display feature of IFs allows users to quickly display previously designated sets of data for various countries or groups. | This display feature of IFs allows users to quickly display previously designated sets of data for various countries or groups. | ||
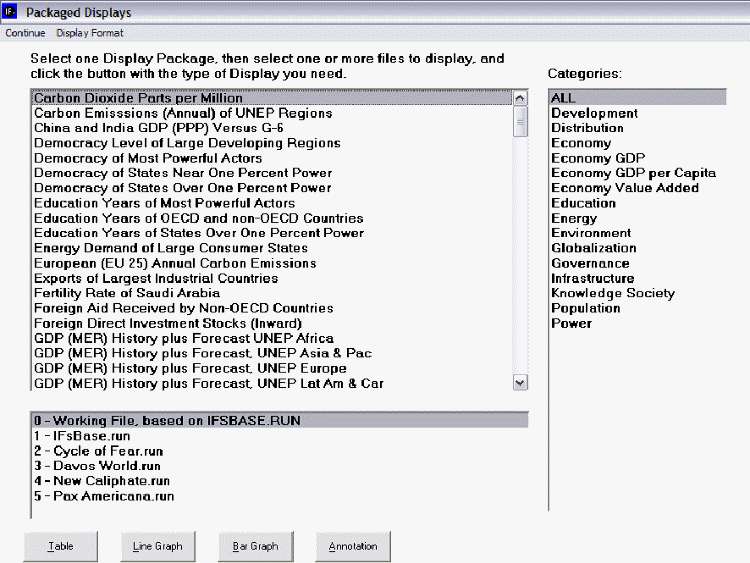
[[File:Img00432.gif| | [[File:Img00432.gif|frame|right|Example of Geographically-Fixed Displays in IFs]]Geographically-fixed Displays are grouped into categories found on the right side of this screen. Clicking on any one of these categories will produce a list of displays on the left that relate to the selected category. Once a display is selected, variables from it can then be graphed for one or more Run-Result-Files of IFs. These Run-Result-Files are found at the bottom of this window. | ||
Different Run-Result-Files are based on parameters being changed and relationships in the model being adjusted. To find out exactly what different Run-Result-Files take into consideration, and what parameters are changed, highlight one of them and click on the [[Annotation|Annotation]] button. You may display your results for only one Run-Result-File, though you may want to display your results for more than one Run-Result-File. In order to select more than one Run-Result-File, simply click on one you would like to select, hold in the Shift button, and click on the rest of the Run-Result-Files you would like to choose. | Different Run-Result-Files are based on parameters being changed and relationships in the model being adjusted. To find out exactly what different Run-Result-Files take into consideration, and what parameters are changed, highlight one of them and click on the [[Annotation|Annotation]] button. You may display your results for only one Run-Result-File, though you may want to display your results for more than one Run-Result-File. In order to select more than one Run-Result-File, simply click on one you would like to select, hold in the Shift button, and click on the rest of the Run-Result-Files you would like to choose. | ||
Revision as of 22:38, 26 July 2017
Geographically-fixed Displays are found as a sub-option under Display on the Main Menu.
This display feature of IFs allows users to quickly display previously designated sets of data for various countries or groups.
Geographically-fixed Displays are grouped into categories found on the right side of this screen. Clicking on any one of these categories will produce a list of displays on the left that relate to the selected category. Once a display is selected, variables from it can then be graphed for one or more Run-Result-Files of IFs. These Run-Result-Files are found at the bottom of this window.
Different Run-Result-Files are based on parameters being changed and relationships in the model being adjusted. To find out exactly what different Run-Result-Files take into consideration, and what parameters are changed, highlight one of them and click on the Annotation button. You may display your results for only one Run-Result-File, though you may want to display your results for more than one Run-Result-File. In order to select more than one Run-Result-File, simply click on one you would like to select, hold in the Shift button, and click on the rest of the Run-Result-Files you would like to choose.
Along side the Annotation option, there are three options for displaying your results located at the bottom of the screen. You can choose to display results as tables, bar graphs or line graphs.
The Display Format option at the top of the Geographically-fixed Displays menu allows users to change the title of their results, alter the year, or the display interval. Choosing the Currency option presents users with a new window where users can flag certain currencies of interest or learn more about currencies used in different countries/regions. Finally, clicking on the Horizon sub-option, you can choose to alter the Time/Run Horizon. This allows you to tailor your graphs and tables to your needs.
Also, you can tick the "Use all historic data" feature, and the model will provide the most up to date historical data available. The "Use Estimation" option tells the model to extrapolate the historic data to fill in any possible holes that exist.
