Global Footprint Network: Difference between revisions
Jump to navigation
Jump to search
No edit summary |
No edit summary |
||
| Line 2: | Line 2: | ||
{{Inline block | width = 38 cm| style = border: 1px solid #a2a9b1; padding: 0.5em; margin: 0.5em; flex = 38em; |2 = div|<br> | {{Inline block | width = 38 cm| style = border: 1px solid #a2a9b1; padding: 0.5em; margin: 0.5em; flex = 38em; |2 = div|<br> | ||
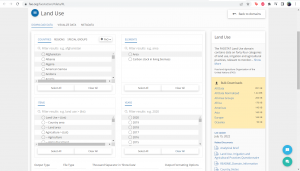
[[File:FAOSTAT Land Area Start Page.png|thumb|alt = xyz example caption|right|upright = 1.5]] Step 1.) Navigate to xyz.com and look for the data icon located in the dashboard}} | [[File:FAOSTAT Land Area Start Page.png|thumb|alt = xyz example caption|right|upright = 1.5]] Step 1.) Navigate to xyz.com and look for the data icon located in the dashboard}}[[File:Test1.png|thumb|Sub section]] | ||
{{Inline block | width = 38 cm| style = border: 1px solid #a2a9b1; padding: 0.5em; margin: 0.5em; flex = 38em; |2 = div|<br> | {{Inline block | width = 38 cm| style = border: 1px solid #a2a9b1; padding: 0.5em; margin: 0.5em; flex = 38em; |2 = div|<br> | ||
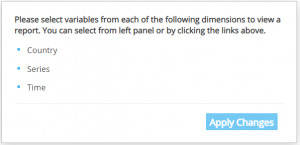
[[File:FAOSTAT Land Area Start Page.png|thumb|alt = xyz example caption|right|upright = 1.5]] Step 2.) In the dashboard select a subseries of XYZ and 123 years. This will ensure that the series is downloaded with interpolated data from 123 to 123.}} | [[File:FAOSTAT Land Area Start Page.png|thumb|alt = xyz example caption|right|upright = 1.5]] Step 2.) In the dashboard select a subseries of XYZ and 123 years. This will ensure that the series is downloaded with interpolated data from 123 to 123.}} | ||

