Global Footprint Network: Difference between revisions
No edit summary |
No edit summary |
||
| Line 1: | Line 1: | ||
<div style = "display:flex; flex-flow: column wrap; text-align: center;"> | <div style = "display:flex; flex-flow: column wrap; text-align: center;"> | ||
== SUMMARY SECTION == | |||
This section will detail the following details (preferably in this order): | |||
- What is this data? (Specifically, what site is it from? What information does the dataset tell us? And why is it significant?) | |||
How often is this series updated? (Most data files will have a "annual", "biannual", "quarterly", etc. listed in the description; if it doesn't use your own discretion and leave a comment noting that it wasn't specified) | |||
- How do we use this series? (Provide a quick rundown of when/where we would use this) | |||
- Example Series (Include the name of a series that would use this source) | |||
- Hyperlink to the "[[data pull instructions]]" in the wiki | |||
== SAMPLE SUMMARY == | |||
The XYZ dataset is from [https://korbel.du.edu/pardee xyz.com]. It's a geography-based dataset that focuses on X, Y, and Z from some industry. Because it's pulled from XYZ and ZYX, it's imperative that the puller pay attention to 1.), 2.), and 3.). These points are significant to ensuring that the calculation for this is accurate. XYZ dataset is updated on a biannual basis, the source collects data during some time period and posts between some time period. | |||
In particular, the data team uses this dataset in order to calculate for a couple indicators: | |||
- indicator 1 | |||
- indicator 2 | |||
- indicator 3 | |||
These indicators can be found in SERIESXYZExample and SERIESZYXExample where we calculate for certain aspects of some mathematical calculation. | |||
To pull data into IFs, please follow the instructions found in the [[Data Pull instructions page]]. | |||
== STEPS TO PULL DATA FROM SITE == | |||
{{Inline block | width = 38 cm| style = border: 1px solid #a2a9b1; padding: 0.5em; margin: 0.5em; flex = 38em; |2 = div|<br> | {{Inline block | width = 38 cm| style = border: 1px solid #a2a9b1; padding: 0.5em; margin: 0.5em; flex = 38em; |2 = div|<br> | ||
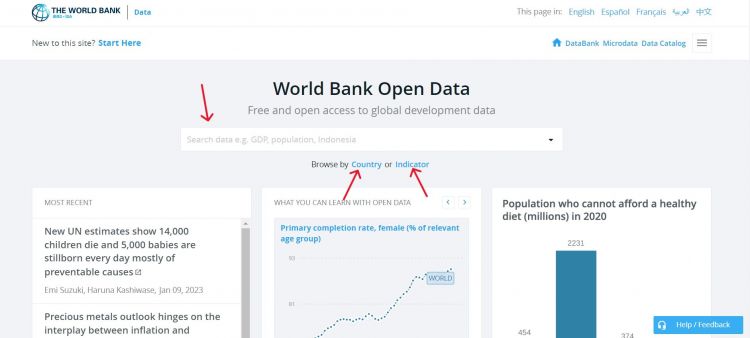
Step 1.) Navigate to xyz.com and look for the data icon located in the dashboard | Step 1.) Navigate to xyz.com and look for the data icon located in the dashboard | ||
[[File: | [[File:WBscreenshot10.jpg|thumb|750px|center|xyz caption]]}} | ||
{{Inline block | width = 38 cm| style = border: 1px solid #a2a9b1; padding: 0.5em; margin: 0.5em; flex = 38em; |2 = div|<br> | {{Inline block | width = 38 cm| style = border: 1px solid #a2a9b1; padding: 0.5em; margin: 0.5em; flex = 38em; |2 = div|<br> | ||
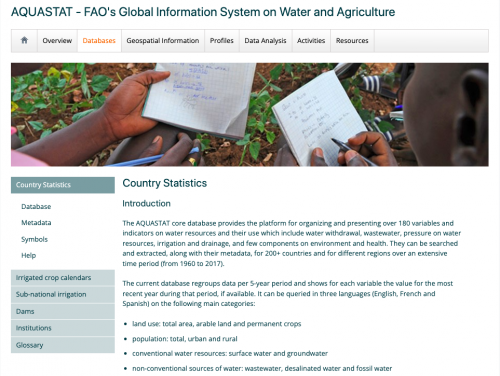
Step 2.) In the dashboard select a subseries of XYZ and 123 years. This will ensure that the series is downloaded with interpolated data from 123 to 123. | Step 2.) In the dashboard select a subseries of XYZ and 123 years. This will ensure that the series is downloaded with interpolated data from 123 to 123. | ||
[[File: | [[File:AQUASTAT Country Statistic Page.png|thumb|500px|center|xyz caption]]}} | ||
{{Inline block | width = 38 cm| style = border: 1px solid #a2a9b1; padding: 0.5em; margin: 0.5em; flex = 38em; |2 = div|<br> | {{Inline block | width = 38 cm| style = border: 1px solid #a2a9b1; padding: 0.5em; margin: 0.5em; flex = 38em; |2 = div|<br> | ||
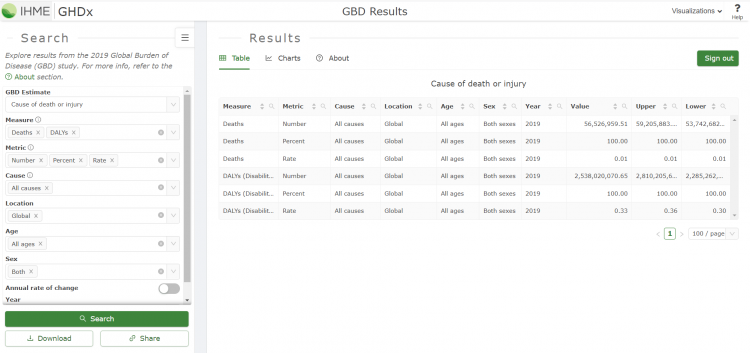
Step 3.) This is an example of paragraph text where a longer explanation is given in addition to the writing the steps necessary to allow the reader to navigate to the correct panel. This example will mimic paragraph formatting by adding additional lines of plain text. add text add text add text add text add text add text add text add text add text add text add text add text add text add text add text add text add text add text add text add text add text add text add text add text add text add text add text add text add text add text add text add text add text add text add text add text add text add text add text add text add text add text add text add text add text add text add text add text | Step 3.) This is an example of paragraph text where a longer explanation is given in addition to the writing the steps necessary to allow the reader to navigate to the correct panel. This example will mimic paragraph formatting by adding additional lines of plain text. add text add text add text add text add text add text add text add text add text add text add text add text add text add text add text add text add text add text add text add text add text add text add text add text add text add text add text add text add text add text add text add text add text add text add text add text add text add text add text add text add text add text add text add text add text add text add text add text | ||
[[File: | [[File:Step04.png|thumb|750px|center|xyz caption]]}} | ||
Revision as of 09:09, 16 January 2023
SUMMARY SECTION
This section will detail the following details (preferably in this order):
- What is this data? (Specifically, what site is it from? What information does the dataset tell us? And why is it significant?)
How often is this series updated? (Most data files will have a "annual", "biannual", "quarterly", etc. listed in the description; if it doesn't use your own discretion and leave a comment noting that it wasn't specified)
- How do we use this series? (Provide a quick rundown of when/where we would use this)
- Example Series (Include the name of a series that would use this source)
- Hyperlink to the "data pull instructions" in the wiki
SAMPLE SUMMARY
The XYZ dataset is from xyz.com. It's a geography-based dataset that focuses on X, Y, and Z from some industry. Because it's pulled from XYZ and ZYX, it's imperative that the puller pay attention to 1.), 2.), and 3.). These points are significant to ensuring that the calculation for this is accurate. XYZ dataset is updated on a biannual basis, the source collects data during some time period and posts between some time period.
In particular, the data team uses this dataset in order to calculate for a couple indicators:
- indicator 1
- indicator 2
- indicator 3
These indicators can be found in SERIESXYZExample and SERIESZYXExample where we calculate for certain aspects of some mathematical calculation.
To pull data into IFs, please follow the instructions found in the Data Pull instructions page.
STEPS TO PULL DATA FROM SITE
Step 2.) In the dashboard select a subseries of XYZ and 123 years. This will ensure that the series is downloaded with interpolated data from 123 to 123.
Step 3.) This is an example of paragraph text where a longer explanation is given in addition to the writing the steps necessary to allow the reader to navigate to the correct panel. This example will mimic paragraph formatting by adding additional lines of plain text. add text add text add text add text add text add text add text add text add text add text add text add text add text add text add text add text add text add text add text add text add text add text add text add text add text add text add text add text add text add text add text add text add text add text add text add text add text add text add text add text add text add text add text add text add text add text add text add text


