Joint United Nations Programme on HIV/AIDS (UNAIDS): Difference between revisions
Jump to navigation
Jump to search
mNo edit summary |
Yutang.Xiong (talk | contribs) |
||
| (One intermediate revision by one other user not shown) | |||
| Line 1: | Line 1: | ||
= Summary = | |||
The '''[https://aidsinfo.unaids.org Joint United Nations Programme on HIV/AIDS (UNAIDS)]''' is a global partnership that leads and coordinates international efforts to end HIV/AIDS as a public health threat. Established in 1996, it brings together 11 UN agencies to respond to the HIV/AIDS epidemic. UNAIDS plays a pivotal role in maintaining global solidarity, reducing stigma and discrimination, and promoting sustainable development goals related to health. The data is located under "Epidemic and Response" on the homepage of UNAIDS, where users can access data for each indicator through "Data Sheets". | The '''[https://aidsinfo.unaids.org Joint United Nations Programme on HIV/AIDS (UNAIDS)]''' is a global partnership that leads and coordinates international efforts to end HIV/AIDS as a public health threat. Established in 1996, it brings together 11 UN agencies to respond to the HIV/AIDS epidemic. UNAIDS plays a pivotal role in maintaining global solidarity, reducing stigma and discrimination, and promoting sustainable development goals related to health. The data is located under "Epidemic and Response" on the homepage of UNAIDS, where users can access data for each indicator through "Data Sheets". | ||
Last updated in May of 2025. | |||
= Tables in IFs = | |||
The following 6 tables in IFs are pulled from UNAIDS. | The following 6 tables in IFs are pulled from UNAIDS. | ||
{| | {| class="wikitable" | ||
| | |+ | ||
! | !<font face="calibri" color="#000000">Variable</font> | ||
! | !<font face="calibri" color="#000000">Definition</font> | ||
!<font face="calibri" color="#000000">Formula</font> | |||
! | |||
!Name In Source | !Name In Source | ||
!<font face="calibri" color="#000000">UsedInPreprocessor</font> | !<font face="calibri" color="#000000">UsedInPreprocessor</font> | ||
!<font face="calibri" color="#000000">UsedInPreprocessorFileName</font> | !<font face="calibri" color="#000000">UsedInPreprocessorFileName</font> | ||
|- | |- | ||
| <font face="calibri" color="#000000"> | |<font face="calibri" color="#000000">HealthUNAIDSTotalHIVHighEst</font> | ||
|<font face="calibri" color="#000000">High estimate of nuber of people living with HIV</font> | |||
| <font face="calibri" color="#000000">High estimate of nuber of people living with HIV</font> | |/1,000,000 | ||
|People living with HIV - All ages | |People living with HIV - All ages | ||
|1 | |1 | ||
| Line 30: | Line 22: | ||
|- | |- | ||
|HealthUNAIDSTotalHIVMidEst | |HealthUNAIDSTotalHIVMidEst | ||
|Mid-range estimate of number of total population with HIV | |Mid-range estimate of number of total population with HIV | ||
|/1,000,000 | |/1,000,000 | ||
|People living with HIV - All ages | |People living with HIV - All ages | ||
| Line 40: | Line 29: | ||
|- | |- | ||
|HealthUNAIDSTotalHIVLowEst | |HealthUNAIDSTotalHIVLowEst | ||
|<font face="calibri" color="#000000">Low estimate of number of total population living with HIV</font> | |<font face="calibri" color="#000000">Low estimate of number of total population living with HIV</font> | ||
|/1,000,000 | |/1,000,000 | ||
|People living with HIV - All ages | |People living with HIV - All ages | ||
| Line 50: | Line 36: | ||
|- | |- | ||
|HealthUNAIDSDeathsLowEst | |HealthUNAIDSDeathsLowEst | ||
|Low estimate of number of deaths from AIDS | |Low estimate of number of deaths from AIDS | ||
|/1,000,000 | |/1,000,000 | ||
|AIDS-related deaths - All ages | |AIDS-related deaths - All ages | ||
| Line 60: | Line 43: | ||
|- | |- | ||
|HealthUNAIDSDeathsHighEst | |HealthUNAIDSDeathsHighEst | ||
|High estimate of number of deaths from AIDS | |High estimate of number of deaths from AIDS | ||
|/1,000,000 | |/1,000,000 | ||
|AIDS-related deaths - All ages | |AIDS-related deaths - All ages | ||
| Line 70: | Line 50: | ||
|- | |- | ||
|HealthUNAIDSARTCoverMidEst | |HealthUNAIDSARTCoverMidEst | ||
|Mid-range estimate antiretroviral therapy coverage (%) | |Mid-range estimate antiretroviral therapy coverage (%) | ||
|/100 | |/100 | ||
|People living with HIV receiving ART (%) | |People living with HIV receiving ART (%) | ||
| Line 79: | Line 56: | ||
|HEALTH | |HEALTH | ||
|} | |} | ||
= Data Pulling Instructions = | |||
# Go to this site: https://aidsinfo.unaids.org/ and click on Epidemic and Responses | # Go to this site: https://aidsinfo.unaids.org/ and click on Epidemic and Responses | ||
# Then in the indicator search bar, search up the indicators you need. | # Then in the indicator search bar, search up the indicators you need. | ||
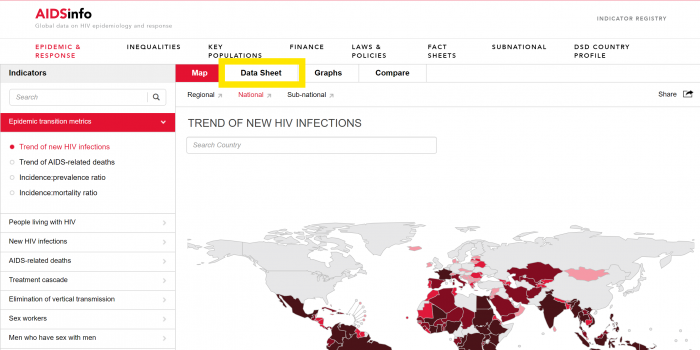
# The data sheets you will need are under "Data Sheet." You can either export a CSV or XLS file. For this update, '''CSV''' files were used.[[File:UNAIDS.png|none|thumb|700x700px]] | # The data sheets you will need are under "Data Sheet." You can either export a CSV or XLS file. For this update, '''CSV''' files were used.[[File:UNAIDS.png|none|thumb|700x700px]] | ||
# This is what the data will look like upon downloading the CSV file from UNAIDS.[[File:UNAIDS Data Pull.png|thumb|1147x1147px]] | # This is what the data will look like upon downloading the CSV file from UNAIDS.[[File:UNAIDS Data Pull.png|thumb|1147x1147px|none]] | ||
# Each file will have four types of data for the years: 2010 2010_lower 2010_upper. The year in the numerical format (2010) is the mid range estimate. The year_upper is the high estimate number and the year_lower is the low estimate number. This is how we will organize the data for the respective series. '''Make sure to delete the footnote column.''' | # Each file will have four types of data for the years: 2010 2010_lower 2010_upper. The year in the numerical format (2010) is the mid range estimate. The year_upper is the high estimate number and the year_lower is the low estimate number. This is how we will organize the data for the respective series. '''Make sure to delete the footnote column.''' | ||
# It is imperative that all symbols are removed from the file (this includes <, > signs, ... that acts as NULLs,) so that the data can import properly. | # It is imperative that all symbols are removed from the file (this includes <, > signs, ... that acts as NULLs,) so that the data can import properly. | ||
| Line 104: | Line 80: | ||
### For these tables, the unit is percent in decimal form. Divide the data in the excel by /100 to get the correct unit. | ### For these tables, the unit is percent in decimal form. Divide the data in the excel by /100 to get the correct unit. | ||
= Notes = | |||
# Blending will be imperative as some of the data from countries was not included in the latest update of their data. | # Blending will be imperative as some of the data from countries was not included in the latest update of their data. | ||
# "UNAIDS changes their data because they incorporate new surveillance and program data into their models each year" | # "UNAIDS changes their data because they incorporate new surveillance and program data into their models each year" | ||
# If the data is downloaded into a '''XLS''' file, the sheet will be formatted with LowEst, MidEst, and HighEst in the same cells. Visit this GitHub repository for a python script to separate the data into their own sheets: https://github.com/fr3nch1/Automations/blob/main/%23%20Data%20Separation%20Script.py | # If the data is downloaded into a '''XLS''' file, the sheet will be formatted with LowEst, MidEst, and HighEst in the same cells. Visit this GitHub repository for a python script to separate the data into their own sheets: https://github.com/fr3nch1/Automations/blob/main/%23%20Data%20Separation%20Script.py | ||
Latest revision as of 18:45, 29 January 2026
Summary
The Joint United Nations Programme on HIV/AIDS (UNAIDS) is a global partnership that leads and coordinates international efforts to end HIV/AIDS as a public health threat. Established in 1996, it brings together 11 UN agencies to respond to the HIV/AIDS epidemic. UNAIDS plays a pivotal role in maintaining global solidarity, reducing stigma and discrimination, and promoting sustainable development goals related to health. The data is located under "Epidemic and Response" on the homepage of UNAIDS, where users can access data for each indicator through "Data Sheets". Last updated in May of 2025.
Tables in IFs
The following 6 tables in IFs are pulled from UNAIDS.
| Variable | Definition | Formula | Name In Source | UsedInPreprocessor | UsedInPreprocessorFileName |
|---|---|---|---|---|---|
| HealthUNAIDSTotalHIVHighEst | High estimate of nuber of people living with HIV | /1,000,000 | People living with HIV - All ages | 1 | POPULATION |
| HealthUNAIDSTotalHIVMidEst | Mid-range estimate of number of total population with HIV | /1,000,000 | People living with HIV - All ages | 1 | POPULATION |
| HealthUNAIDSTotalHIVLowEst | Low estimate of number of total population living with HIV | /1,000,000 | People living with HIV - All ages | 1 | POPULATION |
| HealthUNAIDSDeathsLowEst | Low estimate of number of deaths from AIDS | /1,000,000 | AIDS-related deaths - All ages | 1 | POPULATION |
| HealthUNAIDSDeathsHighEst | High estimate of number of deaths from AIDS | /1,000,000 | AIDS-related deaths - All ages | 1 | POPULATION |
| HealthUNAIDSARTCoverMidEst | Mid-range estimate antiretroviral therapy coverage (%) | /100 | People living with HIV receiving ART (%) | 1 | HEALTH |
Data Pulling Instructions
- Go to this site: https://aidsinfo.unaids.org/ and click on Epidemic and Responses
- Then in the indicator search bar, search up the indicators you need.
- The data sheets you will need are under "Data Sheet." You can either export a CSV or XLS file. For this update, CSV files were used.
- This is what the data will look like upon downloading the CSV file from UNAIDS.
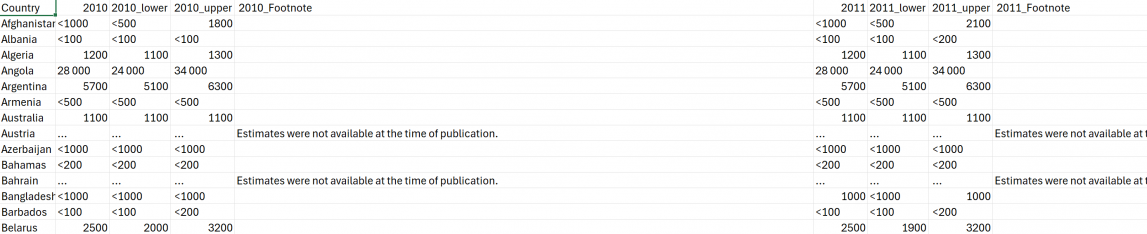
- Each file will have four types of data for the years: 2010 2010_lower 2010_upper. The year in the numerical format (2010) is the mid range estimate. The year_upper is the high estimate number and the year_lower is the low estimate number. This is how we will organize the data for the respective series. Make sure to delete the footnote column.
- It is imperative that all symbols are removed from the file (this includes <, > signs, ... that acts as NULLs,) so that the data can import properly.
- To pull the following tables:
- SeriesHealthUNAIDSTotalHIVHighEst
- HealthUNAIDSTotalHIVMidEst
- HealthUNAIDSTotalHIVLowEst
- Search "People living with HIV - All ages" in the bar.
- For these tables, the unit is Millions. Divide the data in the excel by /1,000,000 to get the correct unit.
- To pull the following tables:
- HealthUNAIDSDeathsLowEst
- HealthUNAIDSDeathsHighEst
- Search "AIDS-related deaths - All ages" in the bar.
- For these tables, the unit is Millions. Divide the data in the excel by /1,000,000 to get the correct unit.
- To pull the following table:
- HealthUNAIDSARTCoverMidEst
- Search "People living with HIV receiving ART" in the bar.
- For these tables, the unit is percent in decimal form. Divide the data in the excel by /100 to get the correct unit.
- HealthUNAIDSARTCoverMidEst


Notes
- Blending will be imperative as some of the data from countries was not included in the latest update of their data.
- "UNAIDS changes their data because they incorporate new surveillance and program data into their models each year"
- If the data is downloaded into a XLS file, the sheet will be formatted with LowEst, MidEst, and HighEst in the same cells. Visit this GitHub repository for a python script to separate the data into their own sheets: https://github.com/fr3nch1/Automations/blob/main/%23%20Data%20Separation%20Script.py