Climate Change Knowledge Portal, World Bank: Difference between revisions
Jump to navigation
Jump to search
Norah.Shamin (talk | contribs) Created page with "Climate Change Knowledge Portal, World Bank" |
Norah.Shamin (talk | contribs) No edit summary |
||
| Line 1: | Line 1: | ||
Climate Change Knowledge Portal, World Bank | = Summary = | ||
The Climate Change Knowledge Portal (CCKP) provides global data on historical and future climate, vulnerabilities, and impacts. There are 55 tables, but only 1 preprocessor. | |||
CCKP offers spatially aggregated climate data for land at the country or territory level, subnational first level, and watershed level, along with ocean data for Exclusive Economic Zones (EEZs) and ocean basins. | |||
Currently, the only data available for ocean areas pertains to cyclones. This same data is also provided at the country or territory level, specifically regarding cyclone landfall. They plan to expand the ocean data coverage in the near future. | |||
= Tables In IFs = | |||
{| class="wikitable" | |||
|+ | |||
!Variable | |||
!Definition | |||
!UsedInPreprocessor | |||
!UsedInPreprocessorFileName | |||
!Name in Source | |||
|- | |||
|EnvAvgAnnTempChgNEWLong | |||
|Change in YoY average annual temperature | |||
|0 | |||
| | |||
|YoY change in average annual temperature (degrees C) | |||
|- | |||
|EnvAvgAnnTempNEWLong | |||
|Average annual temperatures from 1901 to 2015 | |||
|0 | |||
| | |||
|Yearly average temperatures for years 1901-2015 | |||
|- | |||
|EnvPrecipitationChgNEWLong | |||
|Change in YoY average annual precipitation | |||
|0 | |||
| | |||
|YoY percentage change in average annual precipitation | |||
|- | |||
|EnvPrecipitationNEWLong | |||
|Annual precipitation from 1901 to 2015 | |||
|0 | |||
| | |||
|Yearly precipitation from 1901-2015 | |||
|- | |||
|ForecastEnvPrecipitationChgFLATunw | |||
|Precipitation percent change relative to 1990, historical and forecast, 50th percentile of all model outputs, 2015-2024 same as RCP45 then kept flat from 2024 on | |||
|0 | |||
| | |||
| | |||
|- | |||
|ForecastEnvPrecipitationChgMedianRCP26 | |||
|Precipitation percent change relative to 1990, historical and forecast, 50th percentile of all model outputs, RCP 2.6 scenario | |||
|0 | |||
| | |||
| | |||
|- | |||
|ForecastEnvPrecipitationChgMedianRCP45 | |||
|Precipitation percent change relative to 1990, historical and forecast, 50th percentile of all model outputs, RCP 4.5 scenario | |||
|0 | |||
| | |||
| | |||
|- | |||
|ForecastEnvPrecipitationChgMedianRCP60 | |||
|Precipitation percent change relative to 1990, historical and forecast, 50th percentile of all model outputs, RCP 6.0 scenario | |||
|0 | |||
| | |||
| | |||
|- | |||
|ForecastEnvPrecipitationChgMedianRCP60unw | |||
|Precipitation percent change relative to 1990, historical and forecast, 50th percentile of all model outputs, RCP 6.0 scenario 2015-2024 values same as RCP45 | |||
|0 | |||
| | |||
| | |||
|- | |||
|ForecastEnvPrecipitationChgMedianRCP85 | |||
|Precipitation percent change relative to 1990, historical and forecast, 50th percentile of all model outputs, RCP 8.5 scenario | |||
|0 | |||
| | |||
| | |||
|- | |||
|ForecastEnvPrecipitationChgP10RCP26 | |||
|Precipitation percent change relative to 1990, historical and forecast, 10th percentile of all model outputs, RCP 2.6 scenario | |||
|0 | |||
| | |||
| | |||
|- | |||
|ForecastEnvPrecipitationChgP10RCP45 | |||
|Precipitation percent change relative to 1990, historical and forecast, 10th percentile of all model outputs, RCP 4.5 scenario | |||
|0 | |||
| | |||
| | |||
|- | |||
|ForecastEnvPrecipitationChgP10RCP60 | |||
|Precipitation percent change relative to 1990, historical and forecast, 10th percentile of all model outputs, RCP 6.0 scenario | |||
|0 | |||
| | |||
| | |||
|- | |||
|ForecastEnvPrecipitationChgP10RCP85 | |||
|Precipitation percent change relative to 1990, historical and forecast, 10th percentile of all model outputs, RCP 8.5 scenario | |||
|0 | |||
| | |||
| | |||
|- | |||
|ForecastEnvPrecipitationChgP90RCP26 | |||
|Precipitation percent change relative to 1990, historical and forecast, 90th percentile of all model outputs, RCP 2.6 scenario | |||
|0 | |||
| | |||
| | |||
|- | |||
|ForecastEnvPrecipitationChgP90RCP45 | |||
|Precipitation percent change relative to 1990, historical and forecast, 90th percentile of all model outputs, RCP 4.5 scenario | |||
|0 | |||
| | |||
| | |||
|- | |||
|ForecastEnvPrecipitationChgP90RCP60 | |||
|Precipitation percent change relative to 1990, historical and forecast, 90th percentile of all model outputs, RCP 6.0 scenario | |||
|0 | |||
| | |||
| | |||
|- | |||
|ForecastEnvPrecipitationChgP90RCP85 | |||
|Precipitation percent change relative to 1990, historical and forecast, 90th percentile of all model outputs, RCP 8.5 scenario | |||
|0 | |||
| | |||
| | |||
|- | |||
|ForecastEnvPrecipitationMedianRCP26 | |||
|Precipitation, historical and forecast, 50th percentile of all model outputs, RCP 2.6 scenario | |||
|0 | |||
| | |||
| | |||
|- | |||
|ForecastEnvPrecipitationMedianRCP45 | |||
|Precipitation, historical and forecast, 50th percentile of all model outputs, RCP 4.5 scenario | |||
|0 | |||
| | |||
| | |||
|- | |||
|ForecastEnvPrecipitationMedianRCP60 | |||
|Precipitation, historical and forecast, 50th percentile of all model outputs, RCP 6.0 scenario | |||
|0 | |||
| | |||
| | |||
|- | |||
|ForecastEnvPrecipitationMedianRCP85 | |||
|Precipitation, historical and forecast, 50th percentile of all model outputs, RCP 8.5 scenario | |||
|0 | |||
| | |||
| | |||
|- | |||
|ForecastEnvPrecipitationP10RCP26 | |||
|Precipitation, historical and forecast, 10th percentile of all model outputs, RCP 2.6 scenario | |||
|0 | |||
| | |||
| | |||
|- | |||
|ForecastEnvPrecipitationP10RCP45 | |||
|Precipitation, historical and forecast, 10th percentile of all model outputs, RCP 4.5 scenario | |||
|0 | |||
| | |||
| | |||
|- | |||
|ForecastEnvPrecipitationP10RCP60 | |||
|Precipitation, historical and forecast, 10th percentile of all model outputs, RCP 6.0 scenario | |||
|0 | |||
| | |||
| | |||
|- | |||
|ForecastEnvPrecipitationP10RCP85 | |||
|Precipitation, historical and forecast, 10th percentile of all model outputs, RCP 8.5 scenario | |||
|0 | |||
| | |||
| | |||
|- | |||
|ForecastEnvPrecipitationP90RCP26 | |||
|Precipitation, historical and forecast, 90th percentile of all model outputs, RCP 2.6 scenario | |||
|0 | |||
| | |||
| | |||
|- | |||
|ForecastEnvPrecipitationP90RCP45 | |||
|Precipitation, historical and forecast, 90th percentile of all model outputs, RCP 4.5 scenario | |||
|0 | |||
| | |||
| | |||
|- | |||
|ForecastEnvPrecipitationP90RCP60 | |||
|Precipitation, historical and forecast, 90th percentile of all model outputs, RCP 6.0 scenario | |||
|0 | |||
| | |||
| | |||
|- | |||
|ForecastEnvPrecipitationP90RCP85 | |||
|Precipitation, historical and forecast, 90th percentile of all model outputs, RCP 8.5 scenario | |||
|0 | |||
| | |||
| | |||
|- | |||
|ForecastEnvTempChgFLAT | |||
|Mean temperature from 1996, historical and forecast, 50th percentile of all model outputs, kept flat at 2017 value | |||
|0 | |||
| | |||
| | |||
|- | |||
|ForecastEnvTempChgMedianRCP26 | |||
|Change of mean temperature from 1990, historical and forecast, 50th percentile of all model outputs, RCP 2.6 scenario | |||
|0 | |||
| | |||
| | |||
|- | |||
|ForecastEnvTempChgMedianRCP45 | |||
|Change of mean temperature from 1990, historical and forecast, 50th percentile of all model outputs, RCP 4.5 scenario | |||
|0 | |||
| | |||
| | |||
|- | |||
|ForecastEnvTempChgMedianRCP60 | |||
|Change of mean temperature from 1990, historical and forecast, 50th percentile of all model outputs, RCP 6.0 scenario | |||
|0 | |||
| | |||
| | |||
|- | |||
|ForecastEnvTempChgMedianRCP85 | |||
|Change of mean temperature from 1990, historical and forecast, 50th percentile of all model outputs, RCP 8.5 scenario | |||
|0 | |||
| | |||
| | |||
|- | |||
|ForecastEnvTempChgP10RCP26 | |||
|Change of mean temperature from 1990, historical and forecast, 10th percentile of all model outputs, RCP 2.6 scenario | |||
|0 | |||
| | |||
| | |||
|- | |||
|ForecastEnvTempChgP10RCP45 | |||
|Change of mean temperature from 1990, historical and forecast, 10th percentile of all model outputs, RCP 4.5 scenario | |||
|0 | |||
| | |||
| | |||
|- | |||
|ForecastEnvTempChgP10RCP60 | |||
|Change of mean temperature from 1990, historical and forecast, 10th percentile of all model outputs, RCP 6.0 scenario | |||
|0 | |||
| | |||
| | |||
|- | |||
|ForecastEnvTempChgP10RCP85 | |||
|Change of mean temperature from 1990, historical and forecast, 10th percentile of all model outputs, RCP 8.5 scenario | |||
|0 | |||
| | |||
| | |||
|- | |||
|ForecastEnvTempChgP90RCP26 | |||
|Change of mean temperature from 1990, historical and forecast, 90th percentile of all model outputs, RCP 2.6 scenario | |||
|0 | |||
| | |||
| | |||
|- | |||
|ForecastEnvTempChgP90RCP45 | |||
|Change of mean temperature from 1990, historical and forecast, 90th percentile of all model outputs, RCP 4.5 scenario | |||
|0 | |||
| | |||
| | |||
|- | |||
|ForecastEnvTempChgP90RCP60 | |||
|Change of mean temperature from 1990, historical and forecast, 90th percentile of all model outputs, RCP 6.0 scenario | |||
|0 | |||
| | |||
| | |||
|- | |||
|ForecastEnvTempChgP90RCP85 | |||
|Change of mean temperature from 1990, historical and forecast, 90th percentile of all model outputs, RCP 8.5 scenario | |||
|0 | |||
| | |||
| | |||
|- | |||
|ForecastEnvTempMedianRCP26 | |||
|Mean temperature from 1990, historical and forecast, 50th percentile of all model outputs, RCP 2.6 scenario | |||
|0 | |||
| | |||
| | |||
|- | |||
|ForecastEnvTempMedianRCP45 | |||
|Mean temperature from 1990, historical and forecast, 50th percentile of all model outputs, RCP 4.5 scenario | |||
|1 | |||
|ENVIRONMENT | |||
| | |||
|- | |||
|ForecastEnvTempMedianRCP60 | |||
|Mean temperature from 1990, historical and forecast, 50th percentile of all model outputs, RCP 6.0 scenario | |||
|0 | |||
| | |||
| | |||
|- | |||
|ForecastEnvTempMedianRCP85 | |||
|Mean temperature from 1990, historical and forecast, 50th percentile of all model outputs, RCP 8.5 scenario | |||
|0 | |||
| | |||
| | |||
|- | |||
|ForecastEnvTempP10RCP26 | |||
|Mean temperature from 1990, historical and forecast, 10th percentile of all model outputs, RCP 2.6 scenario | |||
|0 | |||
| | |||
| | |||
|- | |||
|ForecastEnvTempP10RCP45 | |||
|Mean temperature from 1990, historical and forecast, 10th percentile of all model outputs, RCP 4.5 scenario | |||
|0 | |||
| | |||
| | |||
|- | |||
|ForecastEnvTempP10RCP60 | |||
|Mean temperature from 1990, historical and forecast, 10th percentile of all model outputs, RCP 6.0 scenario | |||
|0 | |||
| | |||
| | |||
|- | |||
|ForecastEnvTempP10RCP85 | |||
|Mean temperature from 1990, historical and forecast, 10th percentile of all model outputs, RCP 8.5 scenario | |||
|0 | |||
| | |||
| | |||
|- | |||
|ForecastEnvTempP90RCP26 | |||
|Mean temperature from 1990, historical and forecast, 90th percentile of all model outputs, RCP 2.6 scenario | |||
|0 | |||
| | |||
| | |||
|- | |||
|ForecastEnvTempP90RCP45 | |||
|Mean temperature from 1990, historical and forecast, 90th percentile of all model outputs, RCP 4.5 scenario | |||
|0 | |||
| | |||
| | |||
|- | |||
|ForecastEnvTempP90RCP60 | |||
|Mean temperature from 1990, historical and forecast, 90th percentile of all model outputs, RCP 6.0 scenario | |||
|0 | |||
| | |||
| | |||
|- | |||
|ForecastEnvTempP90RCP85 | |||
|Mean temperature from 1990, historical and forecast, 90th percentile of all model outputs, RCP 8.5 scenario | |||
|0 | |||
| | |||
| | |||
|} | |||
= Data Pulling Instructions = | |||
# Navigate to https://climateknowledgeportal.worldbank.org/download-data | |||
# Choose Global - [variable] in the drop down because the global selection will provide data for all country or territory units (including subnationals), watersheds, EEZs, or ocean basins, but allow only 1 aggregation, 1 type, 1 scenario, and 1 variable to be selected.[[File:CCKP World Bank Data .png|none|thumb|600x600px]] | |||
# Select the collection needed. [[File:CCKP World Bank Data Next Page.png|none|thumb|700x700px]] | |||
# Then select the Type[[File:CCKP World Bank Data Next Page- Type.png|none|thumb|600x600px]] | |||
# Select the Variable[[File:CCKP World Bank Data Next Page- Variable.png|none|thumb|600x600px]] | |||
# Select the Product[[File:CCKP World Bank Data Next Page- Product.png|none|thumb|600x600px]] | |||
# Select the Aggregation which should be annual [[File:CCKP World Bank Data Next Page- Aggregation.png|none|thumb|600x600px]] | |||
# Next is the Time Interval [[File:CCKP World Bank Data Next Page- Time.png|none|thumb|600x600px]] | |||
# Then the next page is Percentile [[File:CCKP World Bank Data Next Page- Percentile.png|none|thumb|600x600px]] | |||
# Choose the Scenario [[File:CCKP World Bank Data Next Page- Scenario.png|none|thumb|600x600px]] | |||
# Next is the Model[[File:CCKP World Bank Data Next Page- Model.png|none|thumb|600x600px]] | |||
# Next is the Model Calculation[[File:CCKP World Bank Data Next Page- Model Calc.png|none|thumb|600x600px]] | |||
# Once you select all the variables you need, you can either use an API or download an Excel sheet. [[File:CCKP World Bank Data Download.png|none|thumb|700x700px]] | |||
# | |||
= Data Notes = | |||
Latest revision as of 20:06, 7 July 2025
Summary
The Climate Change Knowledge Portal (CCKP) provides global data on historical and future climate, vulnerabilities, and impacts. There are 55 tables, but only 1 preprocessor.
CCKP offers spatially aggregated climate data for land at the country or territory level, subnational first level, and watershed level, along with ocean data for Exclusive Economic Zones (EEZs) and ocean basins.
Currently, the only data available for ocean areas pertains to cyclones. This same data is also provided at the country or territory level, specifically regarding cyclone landfall. They plan to expand the ocean data coverage in the near future.
Tables In IFs
| Variable | Definition | UsedInPreprocessor | UsedInPreprocessorFileName | Name in Source |
|---|---|---|---|---|
| EnvAvgAnnTempChgNEWLong | Change in YoY average annual temperature | 0 | YoY change in average annual temperature (degrees C) | |
| EnvAvgAnnTempNEWLong | Average annual temperatures from 1901 to 2015 | 0 | Yearly average temperatures for years 1901-2015 | |
| EnvPrecipitationChgNEWLong | Change in YoY average annual precipitation | 0 | YoY percentage change in average annual precipitation | |
| EnvPrecipitationNEWLong | Annual precipitation from 1901 to 2015 | 0 | Yearly precipitation from 1901-2015 | |
| ForecastEnvPrecipitationChgFLATunw | Precipitation percent change relative to 1990, historical and forecast, 50th percentile of all model outputs, 2015-2024 same as RCP45 then kept flat from 2024 on | 0 | ||
| ForecastEnvPrecipitationChgMedianRCP26 | Precipitation percent change relative to 1990, historical and forecast, 50th percentile of all model outputs, RCP 2.6 scenario | 0 | ||
| ForecastEnvPrecipitationChgMedianRCP45 | Precipitation percent change relative to 1990, historical and forecast, 50th percentile of all model outputs, RCP 4.5 scenario | 0 | ||
| ForecastEnvPrecipitationChgMedianRCP60 | Precipitation percent change relative to 1990, historical and forecast, 50th percentile of all model outputs, RCP 6.0 scenario | 0 | ||
| ForecastEnvPrecipitationChgMedianRCP60unw | Precipitation percent change relative to 1990, historical and forecast, 50th percentile of all model outputs, RCP 6.0 scenario 2015-2024 values same as RCP45 | 0 | ||
| ForecastEnvPrecipitationChgMedianRCP85 | Precipitation percent change relative to 1990, historical and forecast, 50th percentile of all model outputs, RCP 8.5 scenario | 0 | ||
| ForecastEnvPrecipitationChgP10RCP26 | Precipitation percent change relative to 1990, historical and forecast, 10th percentile of all model outputs, RCP 2.6 scenario | 0 | ||
| ForecastEnvPrecipitationChgP10RCP45 | Precipitation percent change relative to 1990, historical and forecast, 10th percentile of all model outputs, RCP 4.5 scenario | 0 | ||
| ForecastEnvPrecipitationChgP10RCP60 | Precipitation percent change relative to 1990, historical and forecast, 10th percentile of all model outputs, RCP 6.0 scenario | 0 | ||
| ForecastEnvPrecipitationChgP10RCP85 | Precipitation percent change relative to 1990, historical and forecast, 10th percentile of all model outputs, RCP 8.5 scenario | 0 | ||
| ForecastEnvPrecipitationChgP90RCP26 | Precipitation percent change relative to 1990, historical and forecast, 90th percentile of all model outputs, RCP 2.6 scenario | 0 | ||
| ForecastEnvPrecipitationChgP90RCP45 | Precipitation percent change relative to 1990, historical and forecast, 90th percentile of all model outputs, RCP 4.5 scenario | 0 | ||
| ForecastEnvPrecipitationChgP90RCP60 | Precipitation percent change relative to 1990, historical and forecast, 90th percentile of all model outputs, RCP 6.0 scenario | 0 | ||
| ForecastEnvPrecipitationChgP90RCP85 | Precipitation percent change relative to 1990, historical and forecast, 90th percentile of all model outputs, RCP 8.5 scenario | 0 | ||
| ForecastEnvPrecipitationMedianRCP26 | Precipitation, historical and forecast, 50th percentile of all model outputs, RCP 2.6 scenario | 0 | ||
| ForecastEnvPrecipitationMedianRCP45 | Precipitation, historical and forecast, 50th percentile of all model outputs, RCP 4.5 scenario | 0 | ||
| ForecastEnvPrecipitationMedianRCP60 | Precipitation, historical and forecast, 50th percentile of all model outputs, RCP 6.0 scenario | 0 | ||
| ForecastEnvPrecipitationMedianRCP85 | Precipitation, historical and forecast, 50th percentile of all model outputs, RCP 8.5 scenario | 0 | ||
| ForecastEnvPrecipitationP10RCP26 | Precipitation, historical and forecast, 10th percentile of all model outputs, RCP 2.6 scenario | 0 | ||
| ForecastEnvPrecipitationP10RCP45 | Precipitation, historical and forecast, 10th percentile of all model outputs, RCP 4.5 scenario | 0 | ||
| ForecastEnvPrecipitationP10RCP60 | Precipitation, historical and forecast, 10th percentile of all model outputs, RCP 6.0 scenario | 0 | ||
| ForecastEnvPrecipitationP10RCP85 | Precipitation, historical and forecast, 10th percentile of all model outputs, RCP 8.5 scenario | 0 | ||
| ForecastEnvPrecipitationP90RCP26 | Precipitation, historical and forecast, 90th percentile of all model outputs, RCP 2.6 scenario | 0 | ||
| ForecastEnvPrecipitationP90RCP45 | Precipitation, historical and forecast, 90th percentile of all model outputs, RCP 4.5 scenario | 0 | ||
| ForecastEnvPrecipitationP90RCP60 | Precipitation, historical and forecast, 90th percentile of all model outputs, RCP 6.0 scenario | 0 | ||
| ForecastEnvPrecipitationP90RCP85 | Precipitation, historical and forecast, 90th percentile of all model outputs, RCP 8.5 scenario | 0 | ||
| ForecastEnvTempChgFLAT | Mean temperature from 1996, historical and forecast, 50th percentile of all model outputs, kept flat at 2017 value | 0 | ||
| ForecastEnvTempChgMedianRCP26 | Change of mean temperature from 1990, historical and forecast, 50th percentile of all model outputs, RCP 2.6 scenario | 0 | ||
| ForecastEnvTempChgMedianRCP45 | Change of mean temperature from 1990, historical and forecast, 50th percentile of all model outputs, RCP 4.5 scenario | 0 | ||
| ForecastEnvTempChgMedianRCP60 | Change of mean temperature from 1990, historical and forecast, 50th percentile of all model outputs, RCP 6.0 scenario | 0 | ||
| ForecastEnvTempChgMedianRCP85 | Change of mean temperature from 1990, historical and forecast, 50th percentile of all model outputs, RCP 8.5 scenario | 0 | ||
| ForecastEnvTempChgP10RCP26 | Change of mean temperature from 1990, historical and forecast, 10th percentile of all model outputs, RCP 2.6 scenario | 0 | ||
| ForecastEnvTempChgP10RCP45 | Change of mean temperature from 1990, historical and forecast, 10th percentile of all model outputs, RCP 4.5 scenario | 0 | ||
| ForecastEnvTempChgP10RCP60 | Change of mean temperature from 1990, historical and forecast, 10th percentile of all model outputs, RCP 6.0 scenario | 0 | ||
| ForecastEnvTempChgP10RCP85 | Change of mean temperature from 1990, historical and forecast, 10th percentile of all model outputs, RCP 8.5 scenario | 0 | ||
| ForecastEnvTempChgP90RCP26 | Change of mean temperature from 1990, historical and forecast, 90th percentile of all model outputs, RCP 2.6 scenario | 0 | ||
| ForecastEnvTempChgP90RCP45 | Change of mean temperature from 1990, historical and forecast, 90th percentile of all model outputs, RCP 4.5 scenario | 0 | ||
| ForecastEnvTempChgP90RCP60 | Change of mean temperature from 1990, historical and forecast, 90th percentile of all model outputs, RCP 6.0 scenario | 0 | ||
| ForecastEnvTempChgP90RCP85 | Change of mean temperature from 1990, historical and forecast, 90th percentile of all model outputs, RCP 8.5 scenario | 0 | ||
| ForecastEnvTempMedianRCP26 | Mean temperature from 1990, historical and forecast, 50th percentile of all model outputs, RCP 2.6 scenario | 0 | ||
| ForecastEnvTempMedianRCP45 | Mean temperature from 1990, historical and forecast, 50th percentile of all model outputs, RCP 4.5 scenario | 1 | ENVIRONMENT | |
| ForecastEnvTempMedianRCP60 | Mean temperature from 1990, historical and forecast, 50th percentile of all model outputs, RCP 6.0 scenario | 0 | ||
| ForecastEnvTempMedianRCP85 | Mean temperature from 1990, historical and forecast, 50th percentile of all model outputs, RCP 8.5 scenario | 0 | ||
| ForecastEnvTempP10RCP26 | Mean temperature from 1990, historical and forecast, 10th percentile of all model outputs, RCP 2.6 scenario | 0 | ||
| ForecastEnvTempP10RCP45 | Mean temperature from 1990, historical and forecast, 10th percentile of all model outputs, RCP 4.5 scenario | 0 | ||
| ForecastEnvTempP10RCP60 | Mean temperature from 1990, historical and forecast, 10th percentile of all model outputs, RCP 6.0 scenario | 0 | ||
| ForecastEnvTempP10RCP85 | Mean temperature from 1990, historical and forecast, 10th percentile of all model outputs, RCP 8.5 scenario | 0 | ||
| ForecastEnvTempP90RCP26 | Mean temperature from 1990, historical and forecast, 90th percentile of all model outputs, RCP 2.6 scenario | 0 | ||
| ForecastEnvTempP90RCP45 | Mean temperature from 1990, historical and forecast, 90th percentile of all model outputs, RCP 4.5 scenario | 0 | ||
| ForecastEnvTempP90RCP60 | Mean temperature from 1990, historical and forecast, 90th percentile of all model outputs, RCP 6.0 scenario | 0 | ||
| ForecastEnvTempP90RCP85 | Mean temperature from 1990, historical and forecast, 90th percentile of all model outputs, RCP 8.5 scenario | 0 |
Data Pulling Instructions
- Navigate to https://climateknowledgeportal.worldbank.org/download-data
- Choose Global - [variable] in the drop down because the global selection will provide data for all country or territory units (including subnationals), watersheds, EEZs, or ocean basins, but allow only 1 aggregation, 1 type, 1 scenario, and 1 variable to be selected.

- Select the collection needed.

- Then select the Type

- Select the Variable

- Select the Product

- Select the Aggregation which should be annual

- Next is the Time Interval

- Then the next page is Percentile

- Choose the Scenario

- Next is the Model
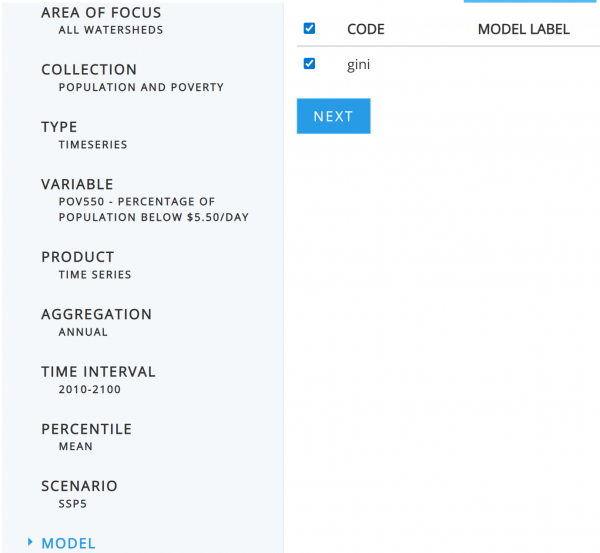
- Next is the Model Calculation

- Once you select all the variables you need, you can either use an API or download an Excel sheet.


