Vetting data: Difference between revisions
No edit summary |
No edit summary |
||
| (7 intermediate revisions by 4 users not shown) | |||
| Line 1: | Line 1: | ||
Vetting | '''Vetting Data''' | ||
Vetting is the process of checking to assure the quality of the data we import into IFs. Even when data is imported through an automated application there could be errors or missing data in the imported series. Vetting the new data you are bringing into IFs requires you to compare the new series to the existing historical series in IFs. | |||
There are a number of reasons for vetting data. One reason is that a country (or a number of countries) could be missed when importing due to not properly concording countries with the proper country concordance table. Make sure the IFs country concordance list (i.e., the relevant column in the '''Country '''Translation table in IFs.mdb) is correct and up to date and you are using the correct concordance list as listed in the DataDict. Additionally, make sure there are no missing years in the new data. Sometimes the year column is missed because the data is formatted as text and not as numbers, or the source simply did not provide an update for that year. If this is the case, be sure to blend in the missing years in the IFs vetting tool. One more general issue is around the units. Make sure you perform any unit conversion required before you import the data. Comparing the new data with the current IFs series will give you an idea on any unit conversion that might be needed. | |||
| |||
'''Vetting Data''' '''Checklist:''' | |||
IFs | *Data in Access file and source Excel file match | ||
*Use IFs vetting tool to compare new data to historical data | |||
*Large discrepancies between new and old data are documented | |||
*Check to see if there are big spikes in the new, imported data | |||
*Blend countries/years with missing data in IFs vetting tool | |||
*Zeroes in Access file are actually zeroes and not null values | |||
*No missing countries or years | |||
*DataDict contains no errors, Original Source has website name and Name in Source contains variable source | |||
*Initials added to both Access and Excel file names, as well as in the DataDict notes | |||
*Send Word file with vetting notes, along with original files to puller and project leads | |||
'''Process:''' | |||
The | #After the data series are imported into IFs, the IFsDataImport.mdb file is passed to another RA (assigned as a vetter) who brings the data from the IFsDataImport.mdb file into the model via the "Vet Imported Data" feature in the Extended Features menu | ||
#The vetter uses the vetting tool to determine if there are any remarkable inconsistencies between the old and new data. This is a bit subjective, but necessarily so as the threshold for concern will be different depending on which series from which source is being vetted | |||
#If significant errors are found that need to be corrected, and these errors had occurred during the import process, these are documented in the RA's vetting notes and the files are passed back to the original data puller to correct and re-send. | |||
#If no errors are found, the vetter blends columns for new years and preserves historical data points as appropriate, and saves the changes in the IFsDataImport file. | |||
#The vetter passes the IFsDataImport file (renamed to reflect series/batch update name and completion date) back to the project lead and data team supervisor | |||
#Data team supervisor stores data import file for consolidation process | |||
| |||
'''You can ensure data quality by following certain procedures''': | |||
#For an updated table, open the existing and updated table side by side. Compare data points for all years and all countries to make sure there are no, or very small, differences. | |||
#For all series, be sure to check large and important countries like USA, China or Germany. | |||
#Check countries with similar name (like the two Congos and two Koreas), as these can sometimes get mixed up. | |||
#Check for zeros and make sure they are actually zeros in the source data. We take no data as an empty cell. If we have zeros that need to be data and must be a feasible value (e.g., GDP cannot be 0). | |||
#Check the variable definition and make sure it makes sense and is in fact the right definition. | |||
#Make sure percentages are below 100 (there are cases when percentages can be above 100, e.g., gross enrollment rate). | |||
#Check values: GDP growth rate of more than 10% should raise a flag. For instances like this, check against the source data. | |||
#Creating line graphs for the countries in a series is a great way to quickly check for transients. This can easily be done in Excel or Tableau. | |||
| |||
'''Using the IFs Vetting Tool''' | |||
IFs has a feature to do some basic initial vetting and is a tool that should be used in every vetting process. The vetting tool can be found by the following: | |||
'''IFs -> MainMenu->Extended Features -> Vet Imported Data'''. | |||
[[File:Vetting IMG 1.png|center|thumb|877x877px|IFs Main Page]] | |||
The | The Compare Imported Table With Existing Table screen is then opened. Currently, the .NET version of IFs only compares tables that have been imported previously, as opposed to being able to open Access files. Make sure you [[Importing data (general instructions)|import data]] into IFs before vetting. Select a series from "New Imported Series" you would like to vet. | ||
[[File:Vetting IMG 2.jpg|center|thumb|863x863px|Compare Imported Table with Existing Table]] | |||
This will then populate the grids below with the new data (the data you are importing) and the old, historical data that is in IFs. The old data is in the first grid and the new data is in the second grid, as shown below. | |||
[[File:Vetting IMG 3.jpg|center|thumb|861x861px|Vetting Data Page]] | |||
Here you have a lot of different options to compare the new data with the old. The vetting tool will automatically mark any zeros in the table. You will want to double check to see if, in fact, these are suppose to be zeros or if they are just null values. If they are just null values, you can click the button, '''Delete Zeros.''' | |||
Next, you need to click the button, '''Mark Differences between New and Old Data for same country-year. '''This will allow you to easily observe any differences, as the vetting tool will highlight them. You can also change the threshold that it will mark. The default is that it will mark any more than 10% difference. As you can see in the screenshot below, the values for Afghanistan in 2014 and 2015 are marked. You will want to go through all of the countries in each series you are importing to look at these marked differences and write down any that are very large. | |||
You can also click the button '''Mark''' '''Year to Year Jumps in New Data, '''which is helpful to observe any large changes year-to-year. | |||
[[File:Vetting IMG 4.jpg|center|thumb|851x851px|Vetting Methods]] | |||
'''Blending''' | |||
The | This vetting tool is also used to merge country and year columns between updated and existing Access tables. This is a necessity when blending to preserve the existing historical IFs values when there is no corresponding value in the new data series. For example, often times there will be an update from a source but it is missing multiple countries we already have data for. In this case, you can use the blending tool to blend in any historical country values that are not in the new data. The same can be done for missing years in the new data. | ||
Once you have thoroughly vetted a data series, you will want to blend the new and historical series together. This ensures that we do not lose any values from the historical series. To do this for the Country values, you will want to check the '''Select All '''box in the bottom right hand corner of the screen. This will automatically check all of the countries, as seen below. Once you have check this box, press the '''Blend Data Points '''button, and click '''Yes. '''This will update the new Access file with missing Country observations. | |||
You will also want to do the same process for the '''Blend Columns (Years) '''button, if there are any missing years. This ensures that we retain the historical values. | |||
[[File:Vetting IMG 5.jpg|center|thumb|848x848px|Blending Data in IFs]] | |||
Latest revision as of 19:11, 25 September 2023
Vetting Data
Vetting is the process of checking to assure the quality of the data we import into IFs. Even when data is imported through an automated application there could be errors or missing data in the imported series. Vetting the new data you are bringing into IFs requires you to compare the new series to the existing historical series in IFs.
There are a number of reasons for vetting data. One reason is that a country (or a number of countries) could be missed when importing due to not properly concording countries with the proper country concordance table. Make sure the IFs country concordance list (i.e., the relevant column in the Country Translation table in IFs.mdb) is correct and up to date and you are using the correct concordance list as listed in the DataDict. Additionally, make sure there are no missing years in the new data. Sometimes the year column is missed because the data is formatted as text and not as numbers, or the source simply did not provide an update for that year. If this is the case, be sure to blend in the missing years in the IFs vetting tool. One more general issue is around the units. Make sure you perform any unit conversion required before you import the data. Comparing the new data with the current IFs series will give you an idea on any unit conversion that might be needed.
Vetting Data Checklist:
- Data in Access file and source Excel file match
- Use IFs vetting tool to compare new data to historical data
- Large discrepancies between new and old data are documented
- Check to see if there are big spikes in the new, imported data
- Blend countries/years with missing data in IFs vetting tool
- Zeroes in Access file are actually zeroes and not null values
- No missing countries or years
- DataDict contains no errors, Original Source has website name and Name in Source contains variable source
- Initials added to both Access and Excel file names, as well as in the DataDict notes
- Send Word file with vetting notes, along with original files to puller and project leads
Process:
- After the data series are imported into IFs, the IFsDataImport.mdb file is passed to another RA (assigned as a vetter) who brings the data from the IFsDataImport.mdb file into the model via the "Vet Imported Data" feature in the Extended Features menu
- The vetter uses the vetting tool to determine if there are any remarkable inconsistencies between the old and new data. This is a bit subjective, but necessarily so as the threshold for concern will be different depending on which series from which source is being vetted
- If significant errors are found that need to be corrected, and these errors had occurred during the import process, these are documented in the RA's vetting notes and the files are passed back to the original data puller to correct and re-send.
- If no errors are found, the vetter blends columns for new years and preserves historical data points as appropriate, and saves the changes in the IFsDataImport file.
- The vetter passes the IFsDataImport file (renamed to reflect series/batch update name and completion date) back to the project lead and data team supervisor
- Data team supervisor stores data import file for consolidation process
You can ensure data quality by following certain procedures:
- For an updated table, open the existing and updated table side by side. Compare data points for all years and all countries to make sure there are no, or very small, differences.
- For all series, be sure to check large and important countries like USA, China or Germany.
- Check countries with similar name (like the two Congos and two Koreas), as these can sometimes get mixed up.
- Check for zeros and make sure they are actually zeros in the source data. We take no data as an empty cell. If we have zeros that need to be data and must be a feasible value (e.g., GDP cannot be 0).
- Check the variable definition and make sure it makes sense and is in fact the right definition.
- Make sure percentages are below 100 (there are cases when percentages can be above 100, e.g., gross enrollment rate).
- Check values: GDP growth rate of more than 10% should raise a flag. For instances like this, check against the source data.
- Creating line graphs for the countries in a series is a great way to quickly check for transients. This can easily be done in Excel or Tableau.
Using the IFs Vetting Tool
IFs has a feature to do some basic initial vetting and is a tool that should be used in every vetting process. The vetting tool can be found by the following:
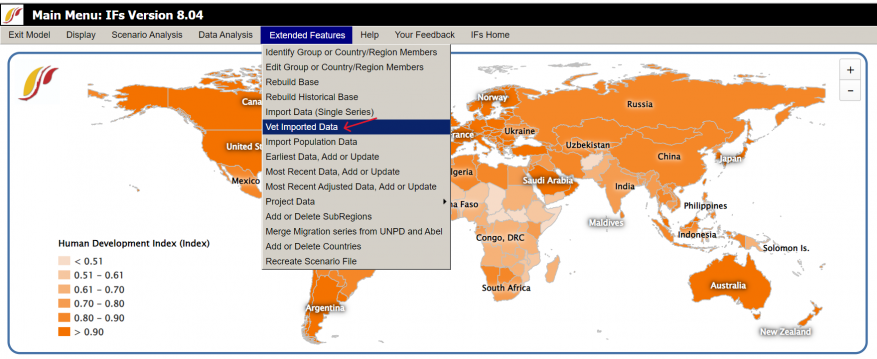
IFs -> MainMenu->Extended Features -> Vet Imported Data.
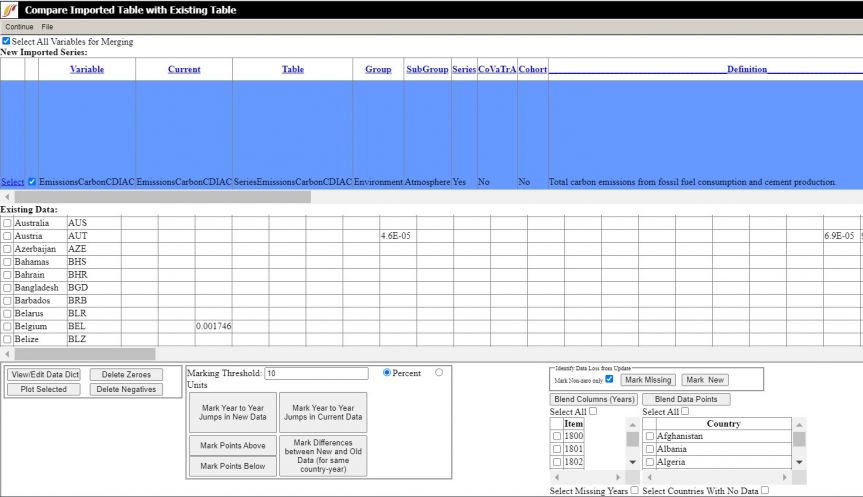
The Compare Imported Table With Existing Table screen is then opened. Currently, the .NET version of IFs only compares tables that have been imported previously, as opposed to being able to open Access files. Make sure you import data into IFs before vetting. Select a series from "New Imported Series" you would like to vet.
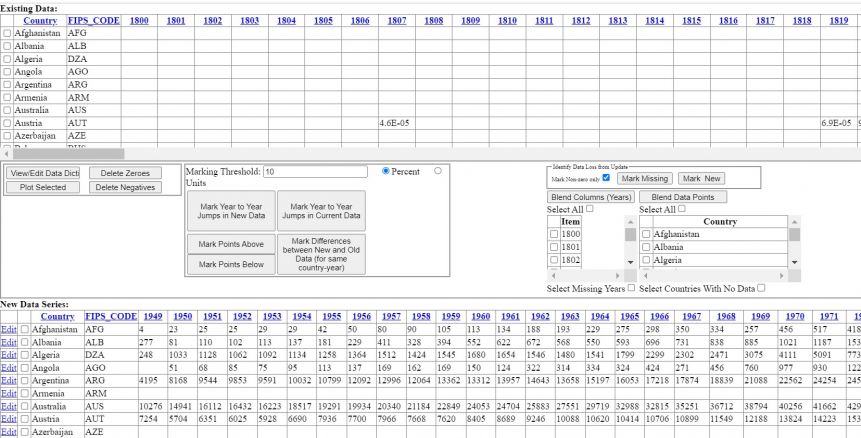
This will then populate the grids below with the new data (the data you are importing) and the old, historical data that is in IFs. The old data is in the first grid and the new data is in the second grid, as shown below.
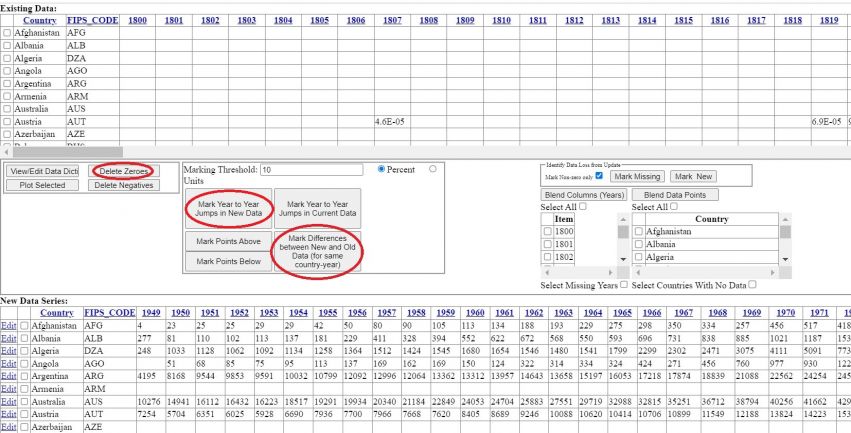
Here you have a lot of different options to compare the new data with the old. The vetting tool will automatically mark any zeros in the table. You will want to double check to see if, in fact, these are suppose to be zeros or if they are just null values. If they are just null values, you can click the button, Delete Zeros.
Next, you need to click the button, Mark Differences between New and Old Data for same country-year. This will allow you to easily observe any differences, as the vetting tool will highlight them. You can also change the threshold that it will mark. The default is that it will mark any more than 10% difference. As you can see in the screenshot below, the values for Afghanistan in 2014 and 2015 are marked. You will want to go through all of the countries in each series you are importing to look at these marked differences and write down any that are very large.
You can also click the button Mark Year to Year Jumps in New Data, which is helpful to observe any large changes year-to-year.
Blending
This vetting tool is also used to merge country and year columns between updated and existing Access tables. This is a necessity when blending to preserve the existing historical IFs values when there is no corresponding value in the new data series. For example, often times there will be an update from a source but it is missing multiple countries we already have data for. In this case, you can use the blending tool to blend in any historical country values that are not in the new data. The same can be done for missing years in the new data.
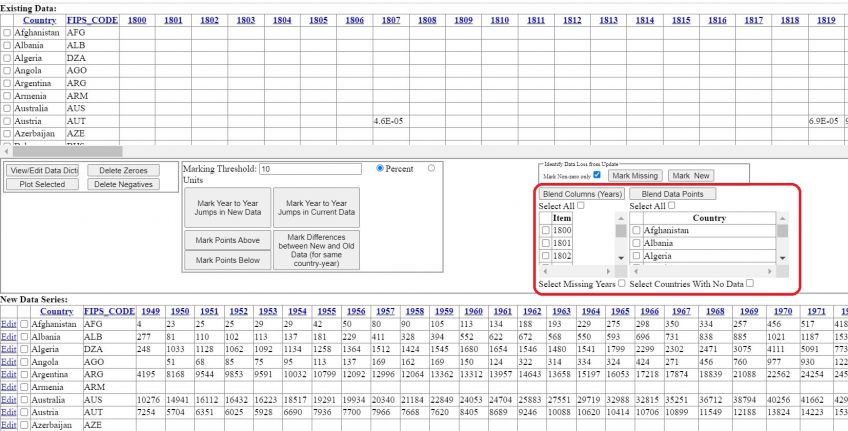
Once you have thoroughly vetted a data series, you will want to blend the new and historical series together. This ensures that we do not lose any values from the historical series. To do this for the Country values, you will want to check the Select All box in the bottom right hand corner of the screen. This will automatically check all of the countries, as seen below. Once you have check this box, press the Blend Data Points button, and click Yes. This will update the new Access file with missing Country observations.
You will also want to do the same process for the Blend Columns (Years) button, if there are any missing years. This ensures that we retain the historical values.
