Population Data: Difference between revisions
No edit summary |
mNo edit summary |
||
| (30 intermediate revisions by one other user not shown) | |||
| Line 1: | Line 1: | ||
= Population = | |||
The World Bank has a sub-regional population data for China in total population running from 2006 through 2015. This series is normalized into millions using ApplyMultAll, rather than converted into millions. This choice was to help simplify data updates and decrease the likelihood of human errors in the data. The model estimates the data back to 1960 to give a full time series. This series is the current population data source because the IFs model is calibrated towards using World Bank data and its population estimates are anticipated to produce better forecasts. The World Bank data code is ''SP.POP.TOTL ''and can be found in the subnational population project database: [http://databank.worldbank.org/data/reports.aspx?source=subnational-population http://databank.worldbank.org/data/reports.aspx?source=subnational-population] | |||
[[ | [[File:PopulationWB v728.jpg|RTENOTITLE]] | ||
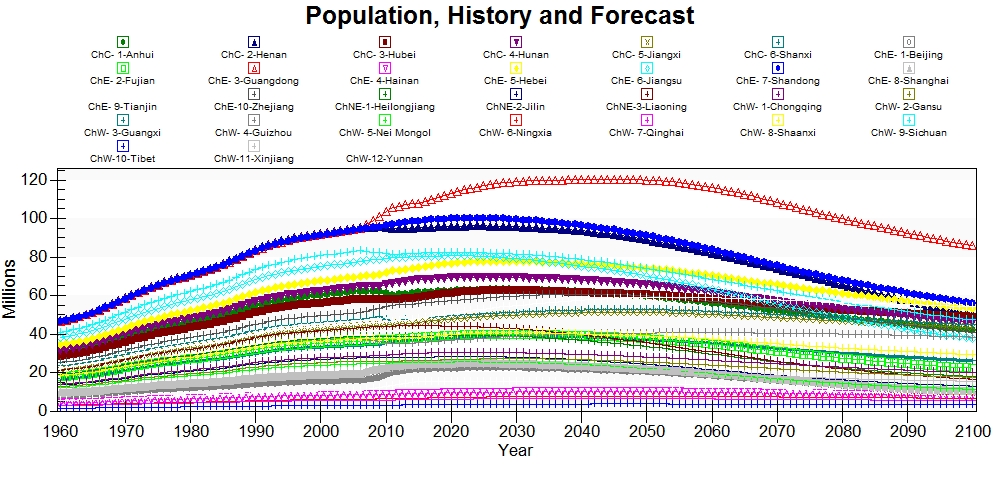
Population in peaks in all provinces some time between 2010 and 2030. The largest province is Guangdong starting in the 2000s through the end of the time horizon. Guangdong is followed by Shandong province, which was the largest prior to 2005. | |||
[[ | There are other sources available for provincial population data in China, which can be read about at [[Alternative_Data_Sources|Alternative Population Data Sources]]. | ||
[[China' | = '''Age-Sex Cohorts''' = | ||
China's Age-Sex Cohorts was data that was received in the University of Michigan's [[China_Data_Center|China Data Center]] database, but the data was originally collected and published in the 2010 Census. The cohorts for all Provinces were in five year cohorts up to 100+ or the 21st cohort, except cohort 1. The first cohort or population 0-4 years of age, was calculated by summing the infant population and the population 1 to 4 years of age. | |||
= '''ForecastNetMigrationRateUNPD''' = | |||
The current data series in use comes from a paper out of the University of Washington. The authors used a variety of data sources to estimate interprovincial migration. This data was compiled and published as five-year averages of net migration rates. Because this series is an annualized series, the annual net migration rates were estimated through a simple multi-step process. First the five-year averages were assigned as the middle year value for the annualized data. For instance, if the observation for Anhui province was -0.5 for 1995-2000 then -0.5 was assigned to 1998. The data was then interpolated between the observations to produce annualized data for a fifteen-year span. | |||
This series should be treated as a placeholder, not as a legitimate series. Further research is required to reproduce the data from the paper using the paper's methodology. The paper's appendices need to be used to locate the original data sources for all the data and for understanding the methods used for estimation. This series should be replicated and hypothetically there may be an update available, which would give the model more recent data. | |||
[[File:NetMigrationRate v728.jpg|RTENOTITLE]] | |||
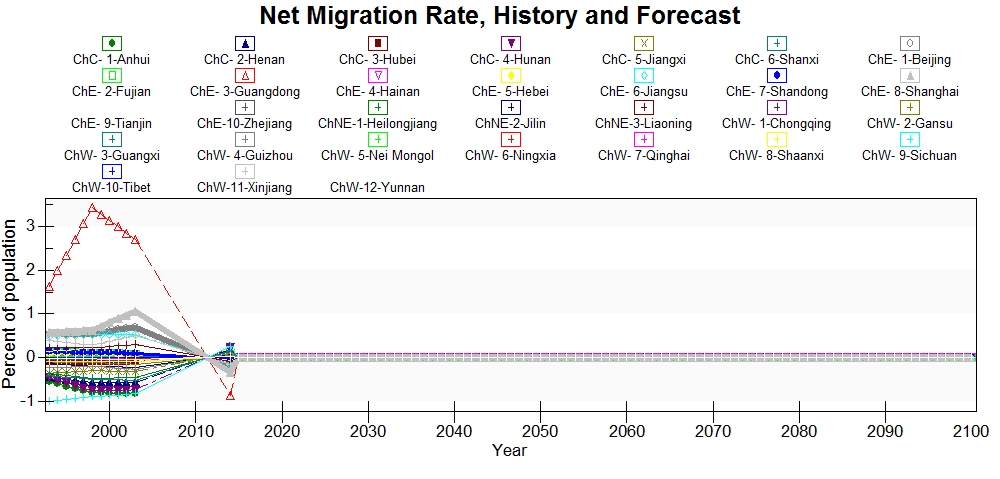
It is apparent that the way in which the model estimates migration by using exogenous historical and forecast data from the UNPD, that having historical data is insufficient for the model to produce good forecasts. Rather the model will force all provinces to a rate of zero. Despite this model behavior, the sum of the province's population forecasts is quite close to the full 186-model forecasts. | |||
Interprovincial migration is a major issue in China due to the mass rural-urban migration that has occurred over the last few decades. Measuring interprovincial migration proves to be difficult in all subnational models, simply because the data is frequently unavailable. In China, there is a system to control migration that requires households to register as a means to gain access to services. The system also restricts migration by refusing certain rural households the ability to migrate to different provinces legally. This system creates a large amount of data tracking migration, but this data has not been found publicly, only alluded to. Also, an unintended consequence of this system is that there is a great deal of illegal migration among the restricted households. Municipalities, such as Beijing, have a substantial migrant worker population which throws off the model's ability to realistically forecast population and age-sex cohorts. Thus, PopMigration is an important series for the China Provincial Model. The national migration registry data is, thus far, inaccessible and it is undoubtedly inaccurate because it does not account for the substantial illegal interprovincial migration. | |||
= '''TFRMedUNPD''' = | |||
The data that is used for this series is from a report that was published by the National Bureau of Statistics in China in 2007 that was aptly named Fertility Estimates for Provinces of China 1975-2000. The series is dated because the most recent data point is in 2000, but it is the only data that has been found. Total fertility rates for China's provinces has remained a difficult to find series. It is not published by provinces on any of the National Data websites, nor has it been found in any Human Development Reports on China. | |||
[[File:TotalFertilityRate v728.jpg|RTENOTITLE]] | |||
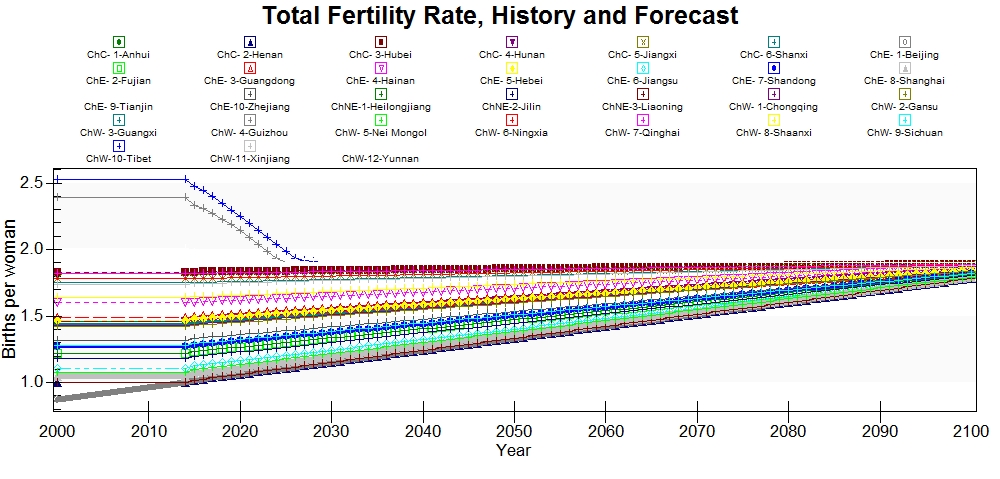
Tibet has the highest fertility rates followed by Guizhou and Beijing has the lowest. The decline in Tibet and Guizhou's total fertiltiy rates appears to be rapid and perhaps faster than it ought to be. | |||
= '''PopulationUrban''' = | |||
Urban population data for the China provincial model came from the China Statistical Yearbooks from 2006-2016. The data is published in tens of thousands rather than the millions that are used in the model. Thus ApplyMultAll is used on this series to normalize the data into the proper unit of millions. | |||
[[File:PopUrban 728.jpg|RTENOTITLE]] | |||
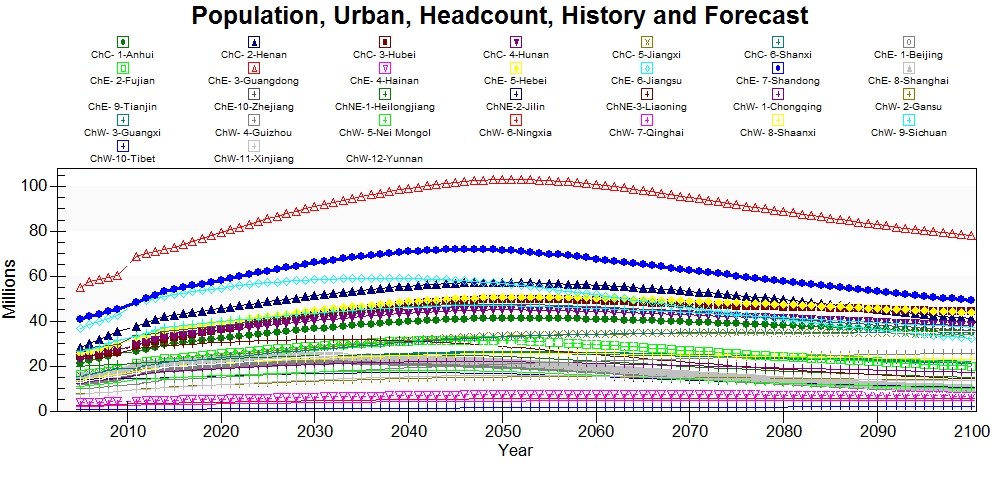
Guangdong province has the largest urban population historically and into the forecast. Shandong and Jiangsu trail behind Guangdong. Tibet has the lowest urban population. | |||
= '''Households''' = | |||
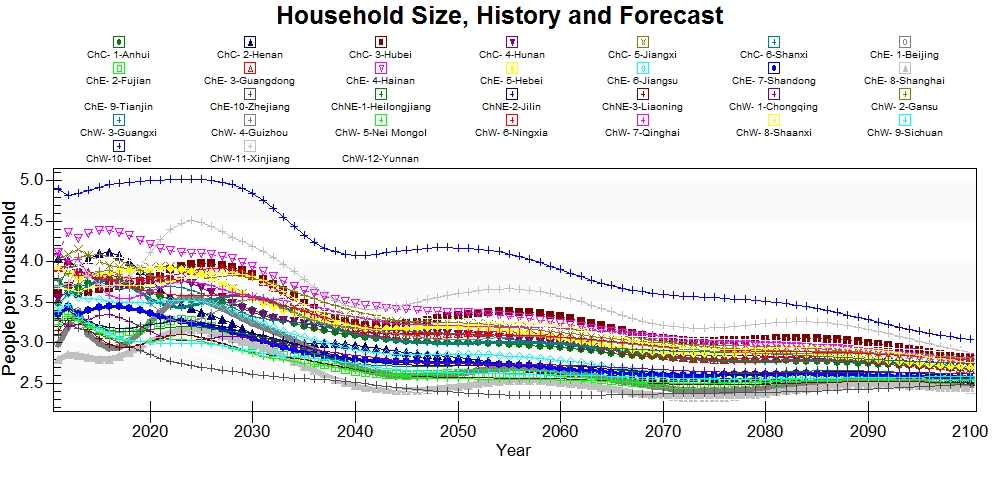
China's provincial household data came from the China Statistical Yearbooks 2012-2015, which produced a series that runs from 2011-2014. There is household data published in the 2016 yearbook, but this data was not included because it is significantly different from the preceding years by twice the households in some provinces. There was not a reason for this inconsistency that was found in the China Statistical Yearbooks' metadata. | |||
[[File:Householdsize v728.jpg|RTENOTITLE]] | |||
There is also data available that was created by the Chinese census that was received as a part of the China Data Center database. This data was chosen to not be included in the model because the most recent data was in 2010, which is more dated than the China Statistical Yearbooks' data. This data could not be blended with the China Statistical Yearbook data because there is a significant (approximately 3 million households) jump between 2010 (the end of the census data) and 2011 (the beginning of the China Statistical Yearbook data). | |||
= '''PopulationYouthDepend%''' = | |||
PopulationYouthDepend% is the percentage of the population that is under the age of 15. This is series was found in the China Statistical Yearbooks 2012-2016, which means that the series runs from 2011-2015. | |||
Latest revision as of 22:03, 16 February 2023
Population
The World Bank has a sub-regional population data for China in total population running from 2006 through 2015. This series is normalized into millions using ApplyMultAll, rather than converted into millions. This choice was to help simplify data updates and decrease the likelihood of human errors in the data. The model estimates the data back to 1960 to give a full time series. This series is the current population data source because the IFs model is calibrated towards using World Bank data and its population estimates are anticipated to produce better forecasts. The World Bank data code is SP.POP.TOTL and can be found in the subnational population project database: http://databank.worldbank.org/data/reports.aspx?source=subnational-population
Population in peaks in all provinces some time between 2010 and 2030. The largest province is Guangdong starting in the 2000s through the end of the time horizon. Guangdong is followed by Shandong province, which was the largest prior to 2005.
There are other sources available for provincial population data in China, which can be read about at Alternative Population Data Sources.
Age-Sex Cohorts
China's Age-Sex Cohorts was data that was received in the University of Michigan's China Data Center database, but the data was originally collected and published in the 2010 Census. The cohorts for all Provinces were in five year cohorts up to 100+ or the 21st cohort, except cohort 1. The first cohort or population 0-4 years of age, was calculated by summing the infant population and the population 1 to 4 years of age.
ForecastNetMigrationRateUNPD
The current data series in use comes from a paper out of the University of Washington. The authors used a variety of data sources to estimate interprovincial migration. This data was compiled and published as five-year averages of net migration rates. Because this series is an annualized series, the annual net migration rates were estimated through a simple multi-step process. First the five-year averages were assigned as the middle year value for the annualized data. For instance, if the observation for Anhui province was -0.5 for 1995-2000 then -0.5 was assigned to 1998. The data was then interpolated between the observations to produce annualized data for a fifteen-year span.
This series should be treated as a placeholder, not as a legitimate series. Further research is required to reproduce the data from the paper using the paper's methodology. The paper's appendices need to be used to locate the original data sources for all the data and for understanding the methods used for estimation. This series should be replicated and hypothetically there may be an update available, which would give the model more recent data.
It is apparent that the way in which the model estimates migration by using exogenous historical and forecast data from the UNPD, that having historical data is insufficient for the model to produce good forecasts. Rather the model will force all provinces to a rate of zero. Despite this model behavior, the sum of the province's population forecasts is quite close to the full 186-model forecasts.
Interprovincial migration is a major issue in China due to the mass rural-urban migration that has occurred over the last few decades. Measuring interprovincial migration proves to be difficult in all subnational models, simply because the data is frequently unavailable. In China, there is a system to control migration that requires households to register as a means to gain access to services. The system also restricts migration by refusing certain rural households the ability to migrate to different provinces legally. This system creates a large amount of data tracking migration, but this data has not been found publicly, only alluded to. Also, an unintended consequence of this system is that there is a great deal of illegal migration among the restricted households. Municipalities, such as Beijing, have a substantial migrant worker population which throws off the model's ability to realistically forecast population and age-sex cohorts. Thus, PopMigration is an important series for the China Provincial Model. The national migration registry data is, thus far, inaccessible and it is undoubtedly inaccurate because it does not account for the substantial illegal interprovincial migration.
TFRMedUNPD
The data that is used for this series is from a report that was published by the National Bureau of Statistics in China in 2007 that was aptly named Fertility Estimates for Provinces of China 1975-2000. The series is dated because the most recent data point is in 2000, but it is the only data that has been found. Total fertility rates for China's provinces has remained a difficult to find series. It is not published by provinces on any of the National Data websites, nor has it been found in any Human Development Reports on China.
Tibet has the highest fertility rates followed by Guizhou and Beijing has the lowest. The decline in Tibet and Guizhou's total fertiltiy rates appears to be rapid and perhaps faster than it ought to be.
PopulationUrban
Urban population data for the China provincial model came from the China Statistical Yearbooks from 2006-2016. The data is published in tens of thousands rather than the millions that are used in the model. Thus ApplyMultAll is used on this series to normalize the data into the proper unit of millions.
Guangdong province has the largest urban population historically and into the forecast. Shandong and Jiangsu trail behind Guangdong. Tibet has the lowest urban population.
Households
China's provincial household data came from the China Statistical Yearbooks 2012-2015, which produced a series that runs from 2011-2014. There is household data published in the 2016 yearbook, but this data was not included because it is significantly different from the preceding years by twice the households in some provinces. There was not a reason for this inconsistency that was found in the China Statistical Yearbooks' metadata.
There is also data available that was created by the Chinese census that was received as a part of the China Data Center database. This data was chosen to not be included in the model because the most recent data was in 2010, which is more dated than the China Statistical Yearbooks' data. This data could not be blended with the China Statistical Yearbook data because there is a significant (approximately 3 million households) jump between 2010 (the end of the census data) and 2011 (the beginning of the China Statistical Yearbook data).
PopulationYouthDepend%
PopulationYouthDepend% is the percentage of the population that is under the age of 15. This is series was found in the China Statistical Yearbooks 2012-2016, which means that the series runs from 2011-2015.
