April 2016 consolidation: Difference between revisions
No edit summary |
No edit summary |
||
| (59 intermediate revisions by the same user not shown) | |||
| Line 1: | Line 1: | ||
= New data = | = New data = | ||
*'''Education - Attainment - UNHDRO''' - 3 series nonpreprocessor, pulled by Joel, vetted by Brandon | *'''Education - Attainment - [[UNDP_HDR|UNHDRO]]''' - 3 series nonpreprocessor, pulled by Joel, vetted by Brandon | ||
{| | {| cellpadding="0" cellspacing="0" border="1" width="64" | ||
|- | |- | ||
| | | width="64" height="20" | SeriesEdYearsAge25UNHDRO | ||
|- | |- | ||
| height="20" | SeriesEDYearsFemaleAge25UNHDRO | | height="20" | SeriesEDYearsFemaleAge25UNHDRO | ||
| Line 14: | Line 14: | ||
*'''Education - Expected years of schooling - [[UNESCO_Institute_for_Statistics_(UIS)|UIS]]''' - 2 new series (male and female disaggregated), non preprocessor - pulled by Brandon, vetted by Kristen | *'''Education - Expected years of schooling - [[UNESCO_Institute_for_Statistics_(UIS)|UIS]]''' - 2 new series (male and female disaggregated), non preprocessor - pulled by Brandon, vetted by Kristen | ||
{| | {| cellpadding="0" cellspacing="0" border="1" width="64" | ||
|- | |- | ||
| | | width="64" height="20" | SeriesEdExpectedYearsofSchoolingFemale | ||
|- | |- | ||
| height="20" | SeriesEdExpectedYearsofSchoolingMale | | height="20" | SeriesEdExpectedYearsofSchoolingMale | ||
| Line 23: | Line 23: | ||
*'''Education - Vocation - [[UNESCO_Institute_for_Statistics_(UIS)|UIS]]''' - 6 series, non preprocessor - pulled by Brandon, vetted by Andrew | *'''Education - Vocation - [[UNESCO_Institute_for_Statistics_(UIS)|UIS]]''' - 6 series, non preprocessor - pulled by Brandon, vetted by Andrew | ||
{| | {| cellpadding="0" cellspacing="0" border="1" width="64" | ||
|- | |- | ||
| | | width="64" height="20" | SeriesEdSecLowerVoc%AllFemale | ||
|- | |- | ||
| height="20" | SeriesEdSecLowerVoc%AllMale | | height="20" | SeriesEdSecLowerVoc%AllMale | ||
| Line 41: | Line 41: | ||
**Changed "notes" from "BV; GE,JM" to "JM;BV" | **Changed "notes" from "BV; GE,JM" to "JM;BV" | ||
{| | {| cellpadding="0" cellspacing="0" border="1" width="64" | ||
|- | |- | ||
| | | width="64" height="20" | SeriesGlobalGenderGap | ||
|} | |} | ||
*'''Economy - Govt Outlays - OECD''' | *'''Economy - Govt Outlays - [[OECD_government_outlays_and_forecast|OECD]]'''- 1 series, preprocessor - pulled by Joel vetted by Kristen | ||
**Changed notes to "JM;KK" | **Changed notes to "JM;KK" | ||
{| | {| cellpadding="0" cellspacing="0" border="1" width="64" | ||
|- | |- | ||
| | | width="64" height="20" | SeriesGovTotalOutlays%GDP | ||
|} | |} | ||
| Line 57: | Line 57: | ||
**Changed "notes" to "JS;AS" | **Changed "notes" to "JS;AS" | ||
{| | {| cellpadding="0" cellspacing="0" border="1" width="64" | ||
|- | |- | ||
| | | width="64" height="20" | SeriesGenIneqInd | ||
|- | |- | ||
| height="20" | SeriesHDI | | height="20" | SeriesHDI | ||
| Line 70: | Line 70: | ||
*'''SocioPol - [[Doing_Business|Doing_Business]] - World Bank''' - 24 series, nonpreprcoessor - pulled by Kristen, vetted by Nenani | *'''SocioPol - [[Doing_Business|Doing_Business]] - World Bank''' - 24 series, nonpreprcoessor - pulled by Kristen, vetted by Nenani | ||
{| | {| cellpadding="0" cellspacing="0" border="1" width="64" | ||
|- | |- | ||
| | | width="64" height="20" | SeriesGovWBDoingBusConstructionPermitDays | ||
|- | |- | ||
| height="20" | SeriesGovWBDoingBusConstructionPermitProcedures | | height="20" | SeriesGovWBDoingBusConstructionPermitProcedures | ||
| Line 127: | Line 127: | ||
***"BGR; "Reserves, Resources and Availability of Energy Resources 2014"<br/>Bundesanstalt fur Geowissenschaften und Rohstoffe (BGR) in Hannover; Annual Report. Reserves, Resources and Availability of Energy Resources 2012,2013,2014" | ***"BGR; "Reserves, Resources and Availability of Energy Resources 2014"<br/>Bundesanstalt fur Geowissenschaften und Rohstoffe (BGR) in Hannover; Annual Report. Reserves, Resources and Availability of Energy Resources 2012,2013,2014" | ||
{| | {| cellpadding="0" cellspacing="0" border="1" width="64" | ||
|- | |- | ||
| | | width="64" height="20" | SeriesEnCumProdGasBGR | ||
|- | |- | ||
| height="20" | SeriesEnCumProdOilBGR | | height="20" | SeriesEnCumProdOilBGR | ||
| Line 170: | Line 170: | ||
**Changed aggregation rule from "None" to "Sum" | **Changed aggregation rule from "None" to "Sum" | ||
{| | {| cellpadding="0" cellspacing="0" border="1" width="64" | ||
|- | |- | ||
| | | width="64" height="20" | SeriesLandIrAreaEquipSiebert | ||
|} | |} | ||
*'''SocioPol - [[Worldwide_Governance_Indicators|WGI]]''' - 6 series, Pulled by Kanishka, vetted by Kristen | *'''SocioPol - [[Worldwide_Governance_Indicators|WGI]]''' - 6 series, Pulled by Kanishka, vetted by Kristen | ||
{| | {| cellpadding="0" cellspacing="0" border="1" width="64" | ||
|- | |- | ||
| | | width="64" height="20" | SeriesGovernanceEffect | ||
|- | |- | ||
| height="20" | SeriesGovernanceRegQual | | height="20" | SeriesGovernanceRegQual | ||
| Line 195: | Line 195: | ||
== Energy == | == Energy == | ||
We updated oil, gas, and coal resources and reserves using the 2014 report from [[BGR_data|BGR]]. | |||
=== Oil === | === Oil === | ||
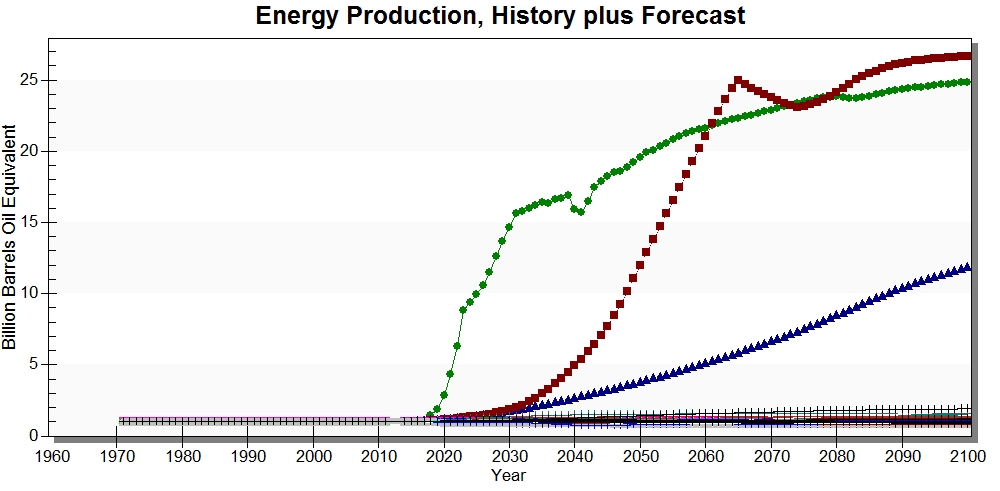
Largest percentage increases in oil production in Mongolia, Pakistan, and Niger. | Largest percentage increases in oil production in Mongolia, Pakistan, and Niger (Figure 1).[[File:OilIncreases.jpg|frame|text-bottom|445x222px|Figure 1: Increases in oil production (new Base Case over old (7.21) Base Case). Mongolia (green), Pakistan (red) and Niger (blue).]] | ||
Mongolian oil resources increased from 52 Mt in 2011 to 1,048 in 2012. Mongolian oil reserves increased from 2 Mt in 2011 to 35 in 2012. | |||
Pakistan oil resources increased from 188 Mt in 2011 to 1,422 in 2012. Pakistan's oil reserves increased from 34 Mt in 2012 to 47 in 2013. | |||
Niger's oil resources increased from 30 Mt in 2012 to 50 Mt in 2013. Niger's oil reserves increased from 0 in 2011 to 20 Mt in 2013. | |||
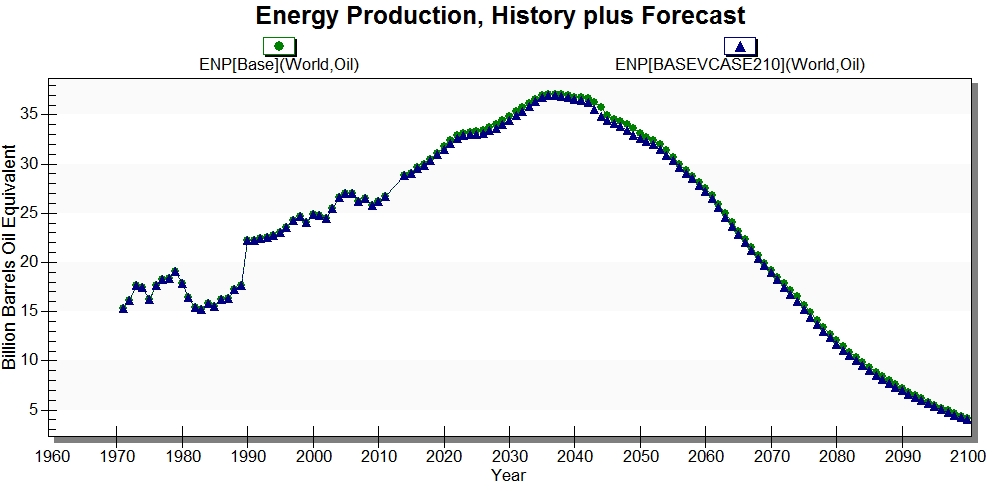
Global oil production decreases only slightly (Figure 2).[[File:GlobalOil.jpg|frame|text-bottom|445x222px|Figure 2: Global oil production in Base Case (7.21) and new Base Case.]] | |||
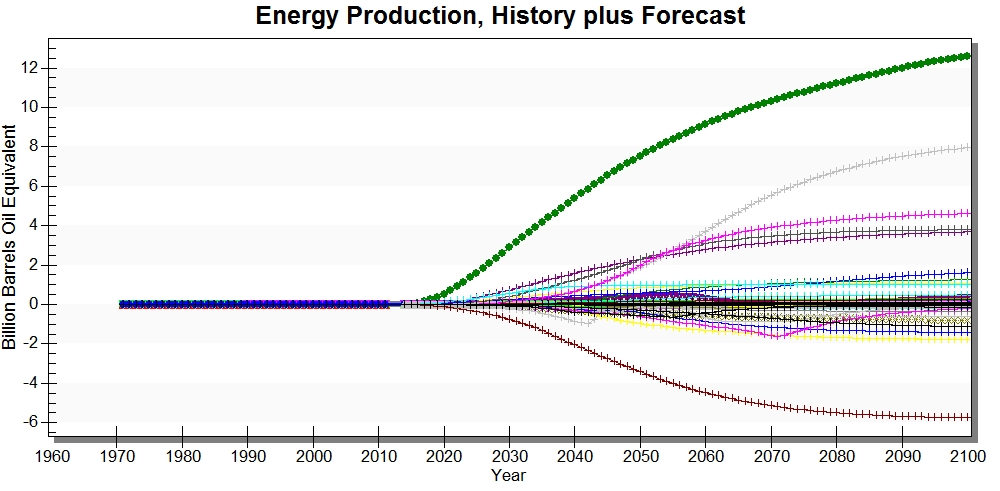
[[File:AbsoluteChangesinOilProduction.jpg|frame|text-bottom|445x222px|Figure 3: Changes in oil production (BBOE) by country, cumulative. The largest increase is in the US (green), followed by Pakistan (grey), and Russia (pink). The largest decrease is in China (brown).]]In absolute terms, the largest increases occur in the US, Pakistan, and Russia (Figure 3). The largest decrease is in China. According to the [http://www.bgr.bund.de/EN/Themen/Energie/Downloads/energiestudie_2013_en.pdf?__blob=publicationFile&v=2 BGR 2013 energy reserves and resources report]: | |||
''"The data on light tight oil resources in particular was improved further by a study by the US Energy Information Agenxy (EIA) which esimated the potential of non-conventional hydrocarbons. This led to a significant reduction in the resources carried by Venezuela and China, and an increase in the resources found in Russia and the USA."'' | |||
Oil resources in the US increased from 24,116 Mt in 2011 to 29,321 in 2012 and then to 30,826 in 2012. Oil reserves in the US increased from 4,463 Mt in 2011 to 4,764 in 2012 and 6,274 in 2013. As stated above, Pakistan's oil resources and reserves have increased since 2011. | |||
Russian oil resources increased from 38,948 Mt in 2011 to 46,669 in 2012 and then to 47,458 Mt in 2013. Likewise, Russian oil reserves increased from 11,868 Mt in 2012 to 12,657 in 2013. | |||
China's oil resources were decreased from 59,146 Mt in 2011 to 23,083 Mt in 2012. This doesn't impact overall energy production for China all that much because over 80% of China's primary energy production is from coal and they have nearly 5.5 milliont Mt of hard coal resources. | |||
=== Gas === | |||
The largest proportional increase is ibbn South Sudan. This is because we have estimated a value for South Sudan using the data point for "Sudan and South Sudan" in the BGR report and then disaggregating based on land area. See the [[BGR_data|BGR data]] page for more details on this methodology. | |||
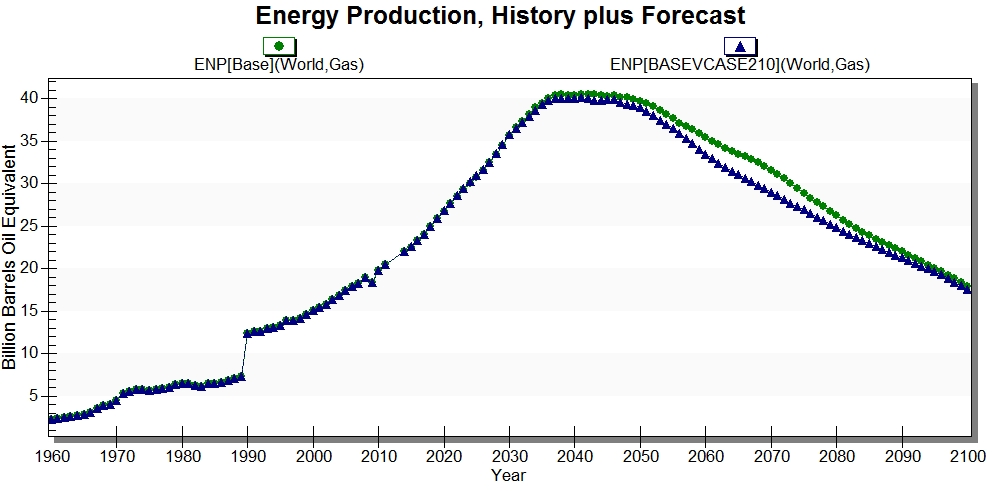
Global gas production increases after adding the new data (Figure 4). | |||
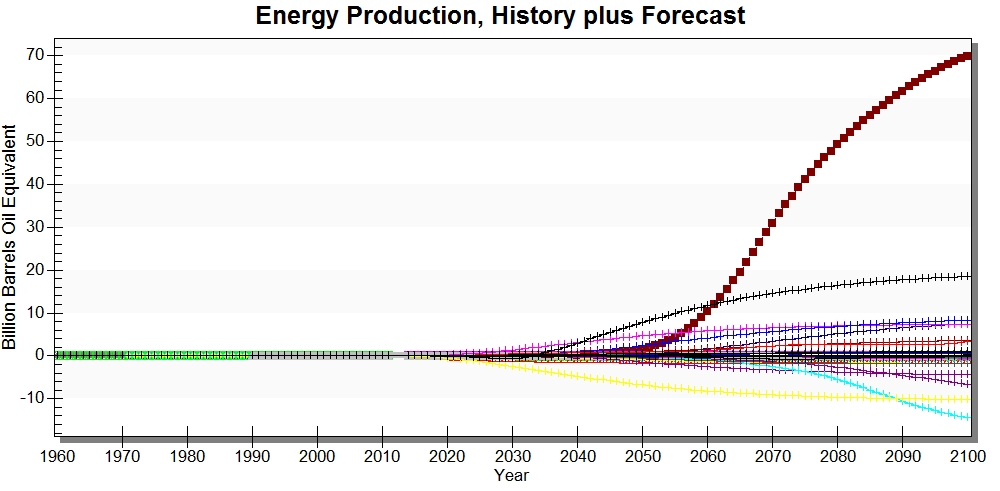
The largest increases in absolute terms occur in Algeria (red) and USA (brown plus-signs). The largest decrease occurs in Norway (yellow) and Mexico (teal) (Figure 5). | |||
Algerian gas resources increased from 17,818 BCM in 2011 to 31,224 in 2012 (no change from 2012 to 2013). This impacts GDP significantly since Algeria is such a large gas producer. Algeria's GDP is over 9 percent larger by the late 2060s with this new data included than in 7.21. | |||
[[File:GlobalGasProduction.jpg|frame|text-bottom|445x222px|Figure 4: Global gas production in the Base Case (7.21) and after adding BGR resources and reserves data.]][[File:GasProductionbyCountry.jpg|frame|text-bottom|445x222px|Figure 5: Changes in gas production in absolute BBOE (cumulative) in the Base Case of 7.21 compared to the new Base Case after adding new BGR data on resources and reserves.]] | |||
== Socio-political == | |||
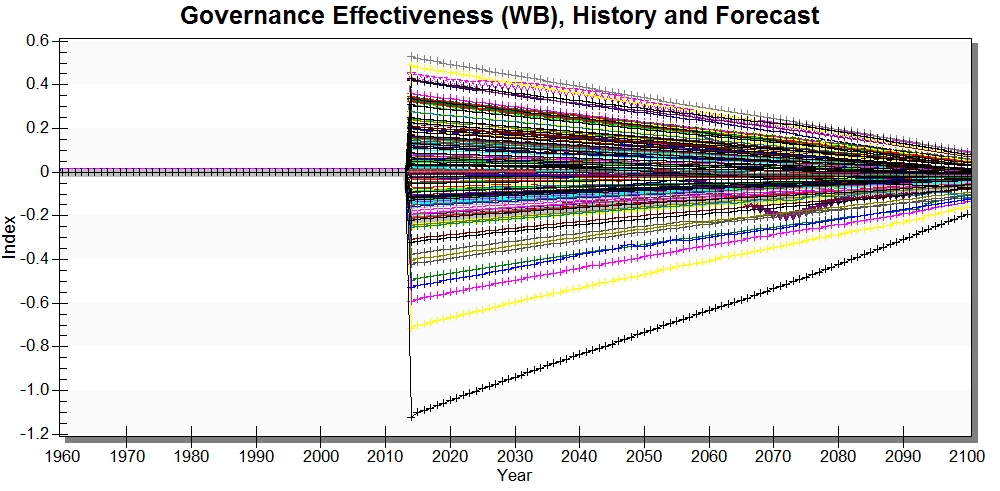
<br/>Data for governance effectiveness were updated to 2014. Previously, the data ended in 2012. The largest decrease occurs in Taiwan and the largest increase occurs in Fiji (Figure 6). | |||
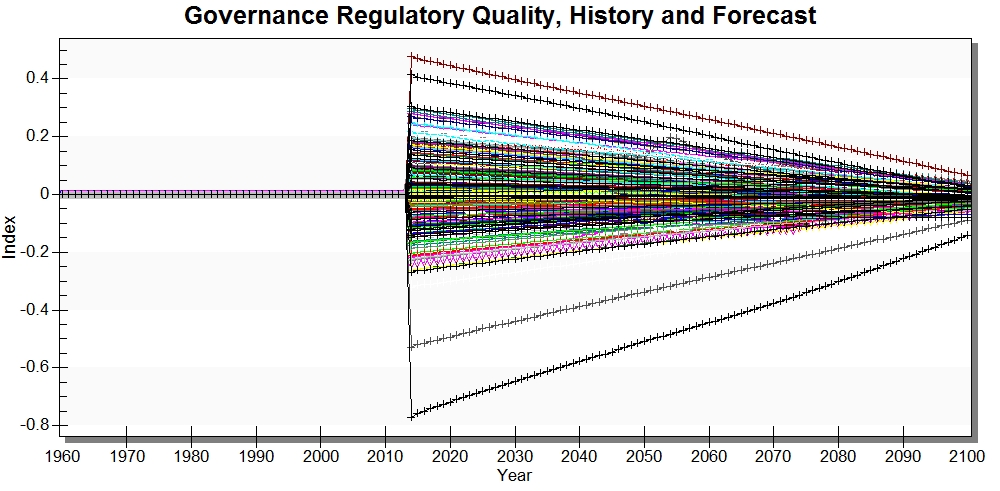
[[File: | Likewise, data on government regulatory quality from the WGI was updated to 2014. The largest increases in regulatory quality were Myanmar and Vanuatu and the largest decreases were in Taiwan an[[File:ChangesinGovEffect.jpg|frame|text-bottom|445x222px|Figure 6: Changes in government effectiveness in the Base Case of 7.21 and after including the new WGI data.]]d Libya (Figure 7). | ||
[[File:ChangesInRegQual.jpg|frame|text-bottom|445x222px|Figure 7: Changes in regulatory quality in the Base Case (7.21) and after adding new WGI data.]]These are the only 2 preprocessor series that were updated from the WGI data. | |||
Since both effectiveness and regulatory quality were decreased in Madagascar, natural gas production decreases in the new forecast relative to the Base Case. Since we forecast Madagascar to produce gas in the future, this directly affects their GDP. After adding these new data, GDP in Madagascar decreases by over 24% in 2100. | |||
= Bugs and issues = | = Bugs and issues = | ||
These are largely Indonesia specific because Drew has gone through looking for problems with the model displays for Indonesia in preparation for the upcoming training. | |||
*All fish dimensions seem to be missing formulas when trying to view "history and forecast" | |||
*Many agricultural series have a gap in the data because the food balance sheets end in 2011/12 and the new base year is 2014. | |||
*There is no historical analog (for Indonesia) for "population per hectare of crop land (urban)" | |||
*Transient in 1998 in GDP (both MER and PPP) for Indonesia | |||
*No historical analog for VADD of energy and materials for Indonesia | |||
*VADD for Indonesia for all sectors jumps around | |||
*Transient in initial year of HDI(new) for Indonesia | |||
*Transient in initial year of MALNPOPP for Indonesia | |||
*Transient in initial year of MalnPop for Indonesia | |||
*Transient in initial year of GINIDOM for Indonesia | |||
*No historical analog for government consumption by destination as a percent of GDP for InfraOther for Indonesia | |||
*No historical analog for GovRev%GDP for Indonesia | |||
*Transient in initial year of INCOMELT200LN2005 for Indonesia | |||
*Transients in inital year of primary intake in Indonesia | |||
*Gaps in ENDEM because data not up-to-date | |||
*No historical analog for reserve to production ratio for Indonesia for hydro | |||
*<span style="background-color:#FFFF00;">ICT mobile broadband initalized at zero</span> | |||
*No historical analog for ICTCONSURPLUS for Indonesia | |||
*Transients for intialized values of HIVRATE, AIDS death rate, and AIDSDTHS for Indonesia | |||
*"Invalid dimension 2 parameters" for "HD Multivariate Report with Land" for Indonesia | |||
= Notes = | = Notes = | ||
*Need coal resources and reserve data from BGR | |||
*Need to address ICT mobile broadband initialization | |||
*Need to update FAO food balance sheets to fill gaps in data now that 2014 is the base year | |||
Latest revision as of 22:47, 4 May 2016
New data
- Education - Attainment - UNHDRO - 3 series nonpreprocessor, pulled by Joel, vetted by Brandon
| SeriesEdYearsAge25UNHDRO |
| SeriesEDYearsFemaleAge25UNHDRO |
| SeriesEDYearsMaleAge25UNHDRO |
- Education - Expected years of schooling - UIS - 2 new series (male and female disaggregated), non preprocessor - pulled by Brandon, vetted by Kristen
| SeriesEdExpectedYearsofSchoolingFemale |
| SeriesEdExpectedYearsofSchoolingMale |
- Education - Vocation - UIS - 6 series, non preprocessor - pulled by Brandon, vetted by Andrew
| SeriesEdSecLowerVoc%AllFemale |
| SeriesEdSecLowerVoc%AllMale |
| SeriesEdSecLowerVoc%AllTotal |
| SeriesEdSecUpperVoc%AllFemale |
| SeriesEdSecUpperVoc%AllMale |
| SeriesEdSecUpperVoc%AllTotal |
- SocioPol - Global Gender Gap - WEF - 1 series, nonpreprocessor - pulled by Joel, vetted by Brandon
- Changed "notes" from "BV; GE,JM" to "JM;BV"
| SeriesGlobalGenderGap |
- Economy - Govt Outlays - OECD- 1 series, preprocessor - pulled by Joel vetted by Kristen
- Changed notes to "JM;KK"
| SeriesGovTotalOutlays%GDP |
- SocioPol - HDR - 4 series, nonpreprocessor - pulled by Joel, vetted by Andrew
- Changed "notes" to "JS;AS"
| SeriesGenIneqInd |
| SeriesHDI |
| SeriesHDIIneqAdj |
| SeriesPovMulDim |
- SocioPol - Doing_Business - World Bank - 24 series, nonpreprcoessor - pulled by Kristen, vetted by Nenani
| SeriesGovWBDoingBusConstructionPermitDays |
| SeriesGovWBDoingBusConstructionPermitProcedures |
| SeriesGovWBDoingBusContainerExportCostUSD |
| SeriesGovWBDoingBusContainerImportCostUSD |
| SeriesGovWBDoingBusContractEnforceDays |
| SeriesGovWBDoingBusCostClose |
| SeriesGovWBDoingBusCreditTransparency |
| SeriesGovWBDoingBusDirectorLiability |
| SeriesGovWBDoingBusDisclosureIndex |
| SeriesGovWBDoingBusExportDocumentationNeeded |
| SeriesGovWBDoingBusImportDays |
| SeriesGovWBDoingBusImportDocumentationNeeded |
| SeriesGovWBDoingBusinessCostofStarting |
| SeriesGovWBDoingBusinessProcedures |
| SeriesGovWBDoingBusinessPropRegDays |
| SeriesGovWBDoingBusinessRanking |
| SeriesGovWBDoingBusinessStartDays |
| SeriesGovWBDoingBusInvestorProtection |
| SeriesGovWBDoingBusLegalRightsStrengthIndex |
| SeriesGovWBDoingBusPropertyProceduresRequired |
| SeriesGovWBDoingBusShareholderSuits |
| SeriesGovWBDoingBusTaxHoursperPerson |
| SeriesGovWBDoingBusTimeClose |
| SeriesGovWBDoingBusTotalTaxRate |
- Energy - reserves and resources - BGR - 17 series, (some) preprocessor - pulled by Brandon, vetted by Kristen
- From Steve: Changed "notes" column to include "BV" and "KK" because Brandon pulled and Kristen vetted.
- From Steve: Changed "Source" column for all from
- "BGR; "Reserves, Resources and Availability of Energy Resources 2012"
Bundesanstalt fur Geowissenschaften und Rohstoffe (BGR) in Hannover; Annual Report. Reserves, Resources and Availability of Energy Resources 2012" to - "BGR; "Reserves, Resources and Availability of Energy Resources 2014"
Bundesanstalt fur Geowissenschaften und Rohstoffe (BGR) in Hannover; Annual Report. Reserves, Resources and Availability of Energy Resources 2012,2013,2014"
- "BGR; "Reserves, Resources and Availability of Energy Resources 2012"
| SeriesEnCumProdGasBGR |
| SeriesEnCumProdOilBGR |
| SeriesEnReserCBMBGR |
| SeriesEnReserGasBGR |
| SeriesEnReserHeavyOilBGR |
| SeriesEnReserOilBGR |
| SeriesEnReserOilSandsBGR |
| SeriesEnReserShaleGasBGR |
| SeriesEnReserShaleOilBGR |
| SeriesEnResorCBMBGR |
| SeriesEnResorGasBGR |
| SeriesEnResorHeavyOilBGR |
| SeriesEnResorOilBGR |
| SeriesEnResorOilSandsBGR |
| SeriesEnResorShaleGasBGR |
| SeriesEnResorShaleOilBGR |
| SeriesEnResorTightGasBGR |
- Water - Irrigation - MY_GEO_HUB - 1 series, non-preprocessor (yet), pulled by Joel, vetted by Brandon
- There was a space in "Series LandIrAreaEquipSiebert" - removed space
- Added "MY GEO HUB" to the source definition
- Changed notes from "BV;JM" to "JM;BV"
- Changed aggregation rule from "None" to "Sum"
| SeriesLandIrAreaEquipSiebert |
- SocioPol - WGI - 6 series, Pulled by Kanishka, vetted by Kristen
| SeriesGovernanceEffect |
| SeriesGovernanceRegQual |
| SeriesGovWBGovMatCorrupt |
| SeriesGovWBGovMatPolStab |
| SeriesGovWBGovMatRuleLaw |
| SeriesGovWBGovMatVoiceAcct |
Affected modules
Energy
We updated oil, gas, and coal resources and reserves using the 2014 report from BGR.
Oil
Largest percentage increases in oil production in Mongolia, Pakistan, and Niger (Figure 1).
Mongolian oil resources increased from 52 Mt in 2011 to 1,048 in 2012. Mongolian oil reserves increased from 2 Mt in 2011 to 35 in 2012.
Pakistan oil resources increased from 188 Mt in 2011 to 1,422 in 2012. Pakistan's oil reserves increased from 34 Mt in 2012 to 47 in 2013.
Niger's oil resources increased from 30 Mt in 2012 to 50 Mt in 2013. Niger's oil reserves increased from 0 in 2011 to 20 Mt in 2013.
Global oil production decreases only slightly (Figure 2).
In absolute terms, the largest increases occur in the US, Pakistan, and Russia (Figure 3). The largest decrease is in China. According to the BGR 2013 energy reserves and resources report:
"The data on light tight oil resources in particular was improved further by a study by the US Energy Information Agenxy (EIA) which esimated the potential of non-conventional hydrocarbons. This led to a significant reduction in the resources carried by Venezuela and China, and an increase in the resources found in Russia and the USA."
Oil resources in the US increased from 24,116 Mt in 2011 to 29,321 in 2012 and then to 30,826 in 2012. Oil reserves in the US increased from 4,463 Mt in 2011 to 4,764 in 2012 and 6,274 in 2013. As stated above, Pakistan's oil resources and reserves have increased since 2011.
Russian oil resources increased from 38,948 Mt in 2011 to 46,669 in 2012 and then to 47,458 Mt in 2013. Likewise, Russian oil reserves increased from 11,868 Mt in 2012 to 12,657 in 2013.
China's oil resources were decreased from 59,146 Mt in 2011 to 23,083 Mt in 2012. This doesn't impact overall energy production for China all that much because over 80% of China's primary energy production is from coal and they have nearly 5.5 milliont Mt of hard coal resources.
Gas
The largest proportional increase is ibbn South Sudan. This is because we have estimated a value for South Sudan using the data point for "Sudan and South Sudan" in the BGR report and then disaggregating based on land area. See the BGR data page for more details on this methodology.
Global gas production increases after adding the new data (Figure 4).
The largest increases in absolute terms occur in Algeria (red) and USA (brown plus-signs). The largest decrease occurs in Norway (yellow) and Mexico (teal) (Figure 5).
Algerian gas resources increased from 17,818 BCM in 2011 to 31,224 in 2012 (no change from 2012 to 2013). This impacts GDP significantly since Algeria is such a large gas producer. Algeria's GDP is over 9 percent larger by the late 2060s with this new data included than in 7.21.
Socio-political
Data for governance effectiveness were updated to 2014. Previously, the data ended in 2012. The largest decrease occurs in Taiwan and the largest increase occurs in Fiji (Figure 6).
Likewise, data on government regulatory quality from the WGI was updated to 2014. The largest increases in regulatory quality were Myanmar and Vanuatu and the largest decreases were in Taiwan an
d Libya (Figure 7).
These are the only 2 preprocessor series that were updated from the WGI data.
Since both effectiveness and regulatory quality were decreased in Madagascar, natural gas production decreases in the new forecast relative to the Base Case. Since we forecast Madagascar to produce gas in the future, this directly affects their GDP. After adding these new data, GDP in Madagascar decreases by over 24% in 2100.
Bugs and issues
These are largely Indonesia specific because Drew has gone through looking for problems with the model displays for Indonesia in preparation for the upcoming training.
- All fish dimensions seem to be missing formulas when trying to view "history and forecast"
- Many agricultural series have a gap in the data because the food balance sheets end in 2011/12 and the new base year is 2014.
- There is no historical analog (for Indonesia) for "population per hectare of crop land (urban)"
- Transient in 1998 in GDP (both MER and PPP) for Indonesia
- No historical analog for VADD of energy and materials for Indonesia
- VADD for Indonesia for all sectors jumps around
- Transient in initial year of HDI(new) for Indonesia
- Transient in initial year of MALNPOPP for Indonesia
- Transient in initial year of MalnPop for Indonesia
- Transient in initial year of GINIDOM for Indonesia
- No historical analog for government consumption by destination as a percent of GDP for InfraOther for Indonesia
- No historical analog for GovRev%GDP for Indonesia
- Transient in initial year of INCOMELT200LN2005 for Indonesia
- Transients in inital year of primary intake in Indonesia
- Gaps in ENDEM because data not up-to-date
- No historical analog for reserve to production ratio for Indonesia for hydro
- ICT mobile broadband initalized at zero
- No historical analog for ICTCONSURPLUS for Indonesia
- Transients for intialized values of HIVRATE, AIDS death rate, and AIDSDTHS for Indonesia
- "Invalid dimension 2 parameters" for "HD Multivariate Report with Land" for Indonesia
Notes
- Need coal resources and reserve data from BGR
- Need to address ICT mobile broadband initialization
- Need to update FAO food balance sheets to fill gaps in data now that 2014 is the base year
