Guided Scenario Analysis: Difference between revisions
(Created page with "Next to displaying output from IFs, the biggest use of the modeling system for most people is creating and investigating alternative run-files/cases of the model or elaborated...") |
No edit summary |
||
| (2 intermediate revisions by 2 users not shown) | |||
| Line 1: | Line 1: | ||
Next to displaying output from IFs, the biggest use of the modeling system for most people is creating and investigating alternative run-files/cases of the model or elaborated scenarios. | Next to displaying output from IFs, the biggest use of the modeling system for most people is creating and investigating alternative run-files/cases of the model or elaborated scenarios. | ||
A [ | A [[Scenario_Description|scenario]] is a story about the future. The base case is such a story and you can create others and compare/contrast them. | ||
There are two scenario development modes in IFs, Guided Scenario Analysis and Self-Managed Scenario Analysis. New users of IFs, and especially users who have no experience with scenario analysis, may prefer Guided Scenario Analysis. Returning users and those who understand the basics of scenario analysis are likely to prefer Managed Scenario Analysis. | There are two scenario development modes in IFs, Guided Scenario Analysis and Self-Managed Scenario Analysis. New users of IFs, and especially users who have no experience with scenario analysis, may prefer Guided Scenario Analysis. Returning users and those who understand the basics of scenario analysis are likely to prefer Managed Scenario Analysis. | ||
| Line 7: | Line 7: | ||
To reach Guided Scenario Analysis, choose the Scenario Analysis option from the Main Menu and the Guided Scenario Analysis sub-option. That will take you to the following window and a list of the six steps of Guided Scenario Analysis. | To reach Guided Scenario Analysis, choose the Scenario Analysis option from the Main Menu and the Guided Scenario Analysis sub-option. That will take you to the following window and a list of the six steps of Guided Scenario Analysis. | ||
[[File:Lesson1image.gif|center]] | [[File:Lesson1image.gif|frame|center|Example of World Map displayed in IFs]] | ||
After you have read the list, click on the Continue Guided Use button. You will be asked for your name (or some identifier you want to provide), so as to keep track of subsequent choices you make and simplify later return to Guided Scenario Analysis. After provision of an identifier, you will be taken to Step 1. | After you have read the list, click on the Continue Guided Use button. You will be asked for your name (or some identifier you want to provide), so as to keep track of subsequent choices you make and simplify later return to Guided Scenario Analysis. After provision of an identifier, you will be taken to Step 1. | ||
| Line 15: | Line 15: | ||
IFs provides standard reports and specialized displays to get started with displays, and also offers flexible display options across all variables and parameters of the model. Lesson 1 elaborates the process, and this lesson assumes that you have mastered display from IFs. Note the Basic Report, Specialized Displays, and Self-Managed Flexible Display options on the menu. These should be familiar to you from Lesson 1, and you can use them at this stage if you want. | IFs provides standard reports and specialized displays to get started with displays, and also offers flexible display options across all variables and parameters of the model. Lesson 1 elaborates the process, and this lesson assumes that you have mastered display from IFs. Note the Basic Report, Specialized Displays, and Self-Managed Flexible Display options on the menu. These should be familiar to you from Lesson 1, and you can use them at this stage if you want. | ||
[[File:Guided2.gif|center]] | [[File:Guided2.gif|frame|center|Exploring the Base Case]] | ||
When finished exploring the base, the Next option will move you to Step 2 and the following screen. | When finished exploring the base, the Next option will move you to Step 2 and the following screen. | ||
| Line 23: | Line 23: | ||
This might be a country/region or a more aggregated geographic grouping, possibly the entire world. Touch the Countries or Group option and a list of geographic units will appear. Make your geographic choice and the screen will confirm it for you. You can change this choice now or later, so do not agonize about it. When you have completed your selection, choose the Next option on the menu to advance to Step 3. | This might be a country/region or a more aggregated geographic grouping, possibly the entire world. Touch the Countries or Group option and a list of geographic units will appear. Make your geographic choice and the screen will confirm it for you. You can change this choice now or later, so do not agonize about it. When you have completed your selection, choose the Next option on the menu to advance to Step 3. | ||
[[File:Guided3.gif|center]] | [[File:Guided3.gif|frame|center|Geographic Area of Interest Window]] | ||
= <span style="font-size:xx-large;">Step 3: Setting Priorities</span> = | = <span style="font-size:xx-large;">Step 3: Setting Priorities</span> = | ||
| Line 32: | Line 32: | ||
*The Define Priorities option on the window will bring up a secondary window that allows you to change the variables in the priority list. Essentially, any variable in IFs can be added and any of the ones shown can be removed. Explore that if you like, but it may be unnecessary for you at this point. | *The Define Priorities option on the window will bring up a secondary window that allows you to change the variables in the priority list. Essentially, any variable in IFs can be added and any of the ones shown can be removed. Explore that if you like, but it may be unnecessary for you at this point. | ||
[[File:Guided4.gif| | [[File:Guided4.gif|frame|right|Setting priorities window]]The Reset option on the Set Priorities menu will reset priority weights back to the default values if you choose to do so after experimentation. When finished tailoring priorities, select the Next option to move to Step 4. | ||
An additional feature of this screen is the Define Priorities option. By clicking on this at the top of the Set Priorities for Improvement of Life menu, users are able to alter which variables and parameters are given priority. Click on this and a new window will appear. From this screen, users are able to add additional variables/parameters to the guided use by toggling between "yes" and "no" under the GuidedUse column. At the bottom of this screen, it is possible to restore the default settings by clicking Reset G.U. | An additional feature of this screen is the Define Priorities option. By clicking on this at the top of the Set Priorities for Improvement of Life menu, users are able to alter which variables and parameters are given priority. Click on this and a new window will appear. From this screen, users are able to add additional variables/parameters to the guided use by toggling between "yes" and "no" under the GuidedUse column. At the bottom of this screen, it is possible to restore the default settings by clicking Reset G.U. | ||
| Line 38: | Line 38: | ||
= <span style="font-size:xx-large;">Step 4: Specifying a Scenario with the Scenario Tree</span> = | = <span style="font-size:xx-large;">Step 4: Specifying a Scenario with the Scenario Tree</span> = | ||
The scenario tree allows you to select one or more interventions without even knowing parameter names. You can select High, Medium, or Low values of many key parameters/scenario drivers and the tree will help manage your input scenarios.[[File:Guided5.gif]] | The scenario tree allows you to select one or more interventions without even knowing parameter names. You can select High, Medium, or Low values of many key parameters/scenario drivers and the tree will help manage your input scenarios.[[File:Guided5.gif|frame|right|Specifying a Scenario window]] | ||
Note that the tree (think of it as a tropical banyan tree that grows extra trunks over time) has several major trunks, each of which has branches that you can expose when you click on the + sign next to the trunk’s name. The first two trunks guide you to branches that correspond to assumptions about alternative technological futures and environmental conditions, respectively. | Note that the tree (think of it as a tropical banyan tree that grows extra trunks over time) has several major trunks, each of which has branches that you can expose when you click on the + sign next to the trunk’s name. The first two trunks guide you to branches that correspond to assumptions about alternative technological futures and environmental conditions, respectively. | ||
| Line 50: | Line 50: | ||
A menu will pop up with several options that provide you much more information about the parameter on this twig; you might want to explore some of them to learn about the parameters and its impact on the model. Ultimately, however, choose the Select option. When you do so, you will be given a chance to identify the country/region or grouping where you want educational expenditures to increase. The default will normally be the one you identified earlier and you can just touch the Enter key on your keyboard to accept it. Then you will be given a chance to identify the area of government spending of special interest to you. Click on Education. The window will change and you will see a repainting of the scenario tree like that below. | A menu will pop up with several options that provide you much more information about the parameter on this twig; you might want to explore some of them to learn about the parameters and its impact on the model. Ultimately, however, choose the Select option. When you do so, you will be given a chance to identify the country/region or grouping where you want educational expenditures to increase. The default will normally be the one you identified earlier and you can just touch the Enter key on your keyboard to accept it. Then you will be given a chance to identify the area of government spending of special interest to you. Click on Education. The window will change and you will see a repainting of the scenario tree like that below. | ||
[[File:Guided6.gif| | [[File:Guided6.gif|frame|right|Setting more parameters window]] | ||
The tree now shows the branch and twig you have selected. A graphic has appeared that allows you to change the value of the parameter you have chosen. Note that the default option specified is that of the base case and that the graphic shows it as a value of "1" across time. These means that the multiplier on educational spending for your country/region or grouping is "1" at all points in the base case, allowing the model to determine the level of educational spending based on the data and equations in it. | The tree now shows the branch and twig you have selected. A graphic has appeared that allows you to change the value of the parameter you have chosen. Note that the default option specified is that of the base case and that the graphic shows it as a value of "1" across time. These means that the multiplier on educational spending for your country/region or grouping is "1" at all points in the base case, allowing the model to determine the level of educational spending based on the data and equations in it. | ||
| Line 62: | Line 62: | ||
After you have changed a single parameter (or even many of them) in Step 4, everything else remains the same. This is very important to understand – you have only changed an input parameter, nothing more. To see the effects of your parameter change throughout the global system you must run the model, because it is the run that computes all the implications of all parameter settings. In the run of the model, nearly "everything effects everything" in IFs. | After you have changed a single parameter (or even many of them) in Step 4, everything else remains the same. This is very important to understand – you have only changed an input parameter, nothing more. To see the effects of your parameter change throughout the global system you must run the model, because it is the run that computes all the implications of all parameter settings. In the run of the model, nearly "everything effects everything" in IFs. | ||
[[File:Guided8.gif|center]] | [[File:Guided8.gif|frame|center|Run the scenario window]] | ||
Note that you can identify the year to which the model should run, with a default value specified. For now, simply accept the default and touch the Start Run button. As the model runs you will see some selected graphics of variables changing over time at the global level. When it finishes, you will see a "Run Successful" message. You can click on either that message button or Next to advance to Step 6 of Guided Scenario Analysis. | Note that you can identify the year to which the model should run, with a default value specified. For now, simply accept the default and touch the Start Run button. As the model runs you will see some selected graphics of variables changing over time at the global level. When it finishes, you will see a "Run Successful" message. You can click on either that message button or Next to advance to Step 6 of Guided Scenario Analysis. | ||
| Line 70: | Line 70: | ||
The screen below (or something similar in your analysis) contains a summary review of the results of your intervention. | The screen below (or something similar in your analysis) contains a summary review of the results of your intervention. | ||
[[File:Guided9.gif|center]] | [[File:Guided9.gif|frame|center|Result window example]] | ||
This screen has the same variables that you saw in Step 3, with the weightings you either chose or left unchanged. It also has, however, several new elements: | This screen has the same variables that you saw in Step 3, with the weightings you either chose or left unchanged. It also has, however, several new elements: | ||
Latest revision as of 17:51, 27 July 2017
Next to displaying output from IFs, the biggest use of the modeling system for most people is creating and investigating alternative run-files/cases of the model or elaborated scenarios.
A scenario is a story about the future. The base case is such a story and you can create others and compare/contrast them.
There are two scenario development modes in IFs, Guided Scenario Analysis and Self-Managed Scenario Analysis. New users of IFs, and especially users who have no experience with scenario analysis, may prefer Guided Scenario Analysis. Returning users and those who understand the basics of scenario analysis are likely to prefer Managed Scenario Analysis.
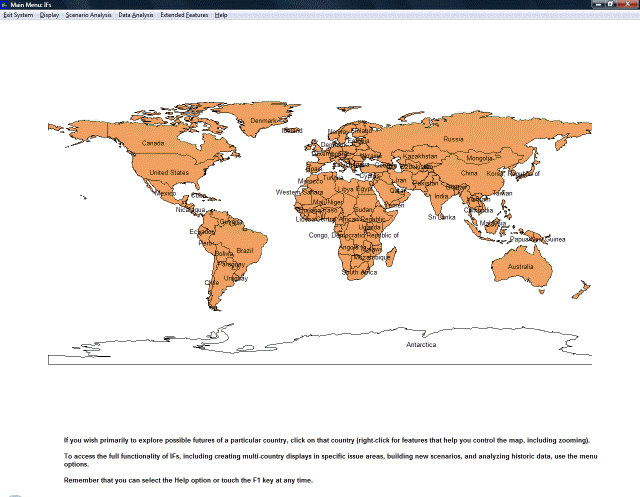
To reach Guided Scenario Analysis, choose the Scenario Analysis option from the Main Menu and the Guided Scenario Analysis sub-option. That will take you to the following window and a list of the six steps of Guided Scenario Analysis.
After you have read the list, click on the Continue Guided Use button. You will be asked for your name (or some identifier you want to provide), so as to keep track of subsequent choices you make and simplify later return to Guided Scenario Analysis. After provision of an identifier, you will be taken to Step 1.
Step 1: Exploring the Base Case
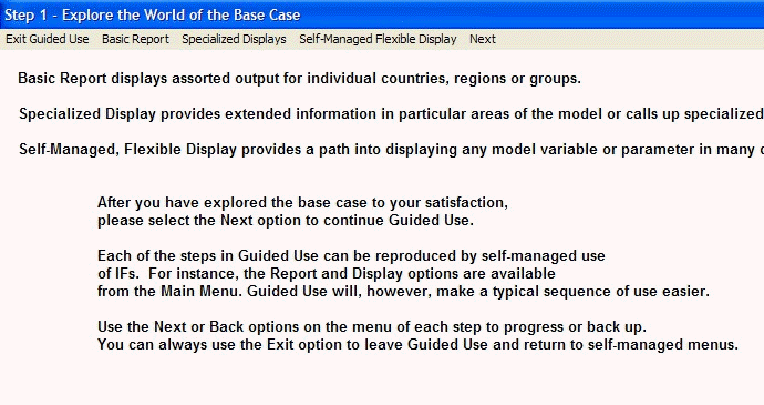
IFs provides standard reports and specialized displays to get started with displays, and also offers flexible display options across all variables and parameters of the model. Lesson 1 elaborates the process, and this lesson assumes that you have mastered display from IFs. Note the Basic Report, Specialized Displays, and Self-Managed Flexible Display options on the menu. These should be familiar to you from Lesson 1, and you can use them at this stage if you want.
When finished exploring the base, the Next option will move you to Step 2 and the following screen.
Step 2: Identity a Geographic Area of Interest
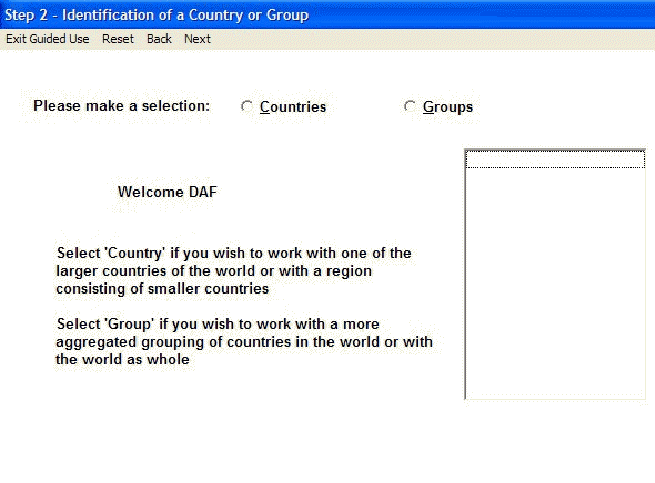
This might be a country/region or a more aggregated geographic grouping, possibly the entire world. Touch the Countries or Group option and a list of geographic units will appear. Make your geographic choice and the screen will confirm it for you. You can change this choice now or later, so do not agonize about it. When you have completed your selection, choose the Next option on the menu to advance to Step 3.
Step 3: Setting Priorities
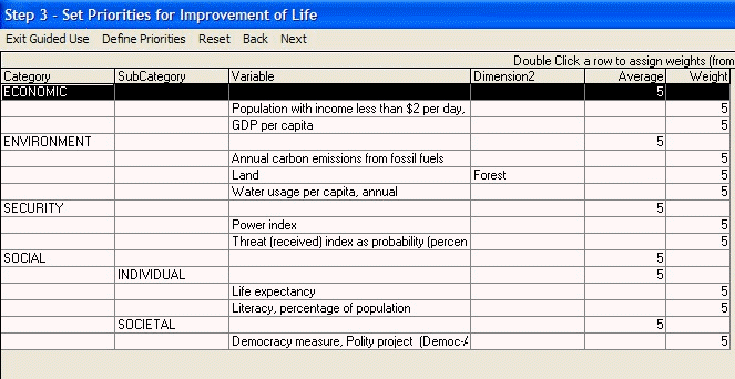
The Step 3 screen identifies a small selection of IFs variables in 4 main categories that have been chosen to help monitor the system when scenarios are introduced. Each has an initial weighting of 5 on a 1 to 10 scale (higher is more important). The model computes average weightings automatically for each subcategory and category. There is a more extended Help topic for Setting Priorities. At this point you only need to know a few things:
- You can double-click on any variable name to bring up a small window that allows you to adjust the priority weight for that variable. Pick a variable of special importance to you as a priority for your country/region or geographic grouping, double-click on it, and increase its weight.
- The Define Priorities option on the window will bring up a secondary window that allows you to change the variables in the priority list. Essentially, any variable in IFs can be added and any of the ones shown can be removed. Explore that if you like, but it may be unnecessary for you at this point.
The Reset option on the Set Priorities menu will reset priority weights back to the default values if you choose to do so after experimentation. When finished tailoring priorities, select the Next option to move to Step 4.
An additional feature of this screen is the Define Priorities option. By clicking on this at the top of the Set Priorities for Improvement of Life menu, users are able to alter which variables and parameters are given priority. Click on this and a new window will appear. From this screen, users are able to add additional variables/parameters to the guided use by toggling between "yes" and "no" under the GuidedUse column. At the bottom of this screen, it is possible to restore the default settings by clicking Reset G.U.
Step 4: Specifying a Scenario with the Scenario Tree
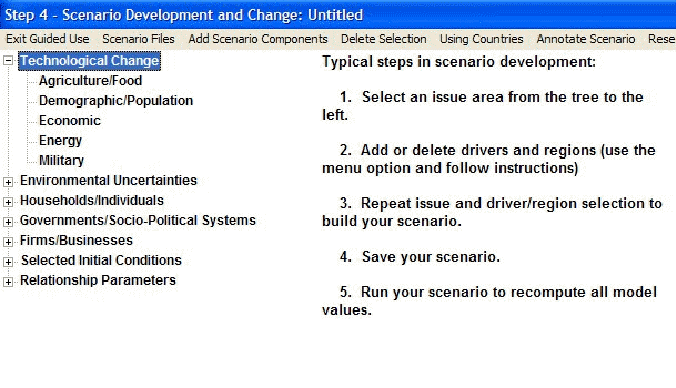
The scenario tree allows you to select one or more interventions without even knowing parameter names. You can select High, Medium, or Low values of many key parameters/scenario drivers and the tree will help manage your input scenarios.
Note that the tree (think of it as a tropical banyan tree that grows extra trunks over time) has several major trunks, each of which has branches that you can expose when you click on the + sign next to the trunk’s name. The first two trunks guide you to branches that correspond to assumptions about alternative technological futures and environmental conditions, respectively.
The next three trunks contain branches that help you represent changes in the behavior of key agent-classes in society: households/individuals, governments, and firms. Behavioral changes of such agent-classes can have significant impact on the future.
The last trunk contains a large number of branches that lead to parameters inside the model relationships. For most users, these parameters values will not be altered. This trunk is most for advanced users.
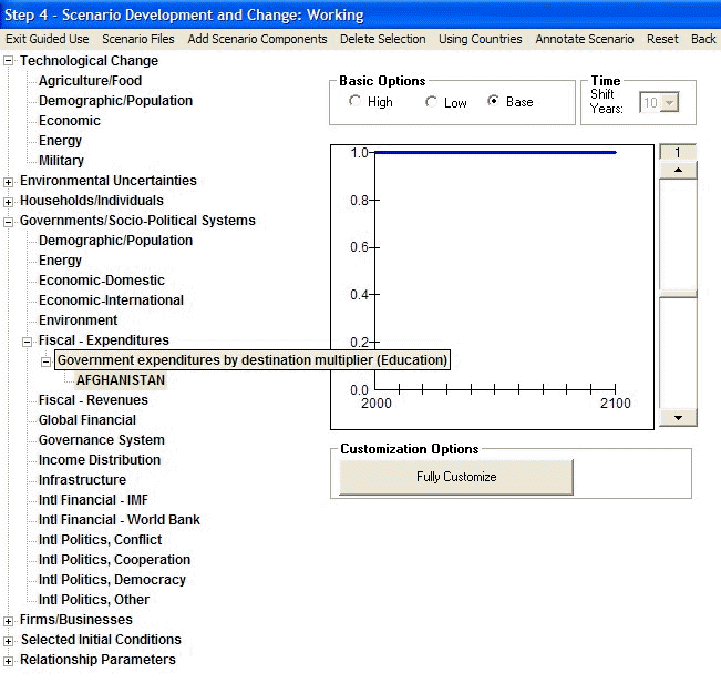
The best way to learn how to use the tree is to walk through an example. Let’s make a greater investment in education in order to explore whether it would help or hurt the country/region or grouping. Click on the "+" next to the Government/Socio-Political trunk and expose the branches. Click on the Fiscal-Expenditure branch to expose the specific drivers or parameters (or twigs) available. Click on the "Government expenditures by destination, multiplier" twig to get access to control over different kinds of government spending (the "Government expenditures on education by level, multiplier" would help direct spending to primary, secondary, or tertiary levels, but the current interest is in total spending).
A menu will pop up with several options that provide you much more information about the parameter on this twig; you might want to explore some of them to learn about the parameters and its impact on the model. Ultimately, however, choose the Select option. When you do so, you will be given a chance to identify the country/region or grouping where you want educational expenditures to increase. The default will normally be the one you identified earlier and you can just touch the Enter key on your keyboard to accept it. Then you will be given a chance to identify the area of government spending of special interest to you. Click on Education. The window will change and you will see a repainting of the scenario tree like that below.
The tree now shows the branch and twig you have selected. A graphic has appeared that allows you to change the value of the parameter you have chosen. Note that the default option specified is that of the base case and that the graphic shows it as a value of "1" across time. These means that the multiplier on educational spending for your country/region or grouping is "1" at all points in the base case, allowing the model to determine the level of educational spending based on the data and equations in it.
Now, however, you want to force more education spending. Click on the High option. The graph will change and you will see that the multiplier ramps up to a higher value over a period of several years (it is hard to change education spending very quickly). The Shift Years box would allow you to ramp up faster or more slowly. The slider bar on the side of the graph would allow you to ramp up (or down) to higher or lower values. The Fully Customize button would take you to a specialized Change Values screen that provides total control on the time path of intervention.
For now, just choose the High option as your intervention. Click on the Next button to advance to the next step. When you do so, you will be asked to Save your scenario. Type in Test.sce some other name that you would like. Notice, however, that there are already many scenarios in the list of folders presented in this dialog box. For instance, Sustainability Scenario.sce contains a rather extended scenario that has interventions aimed at creating a more sustainable world by 2100. Other scenarios have interventions concerning faster or slower control of HIV/AIDS. Still others represent the scenario "families" of the Intergovernmental Panel on Climate Change (IPCC). At a later time you will want to come back to Step 4, use the Scenario Files option and the Open sub-option to load either your own "Test.sce" or another scenario into the tree as a basis for further analysis. The window of Step 4 is a powerful tool for developing and changing scenario packages over time.
Step 5: Running the Model
After you have changed a single parameter (or even many of them) in Step 4, everything else remains the same. This is very important to understand – you have only changed an input parameter, nothing more. To see the effects of your parameter change throughout the global system you must run the model, because it is the run that computes all the implications of all parameter settings. In the run of the model, nearly "everything effects everything" in IFs.
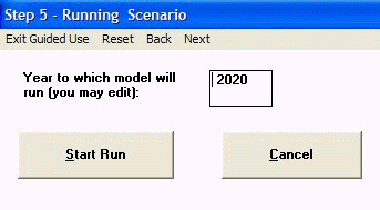
Note that you can identify the year to which the model should run, with a default value specified. For now, simply accept the default and touch the Start Run button. As the model runs you will see some selected graphics of variables changing over time at the global level. When it finishes, you will see a "Run Successful" message. You can click on either that message button or Next to advance to Step 6 of Guided Scenario Analysis.
Step 6: Reviewing the Results of Your Scenario
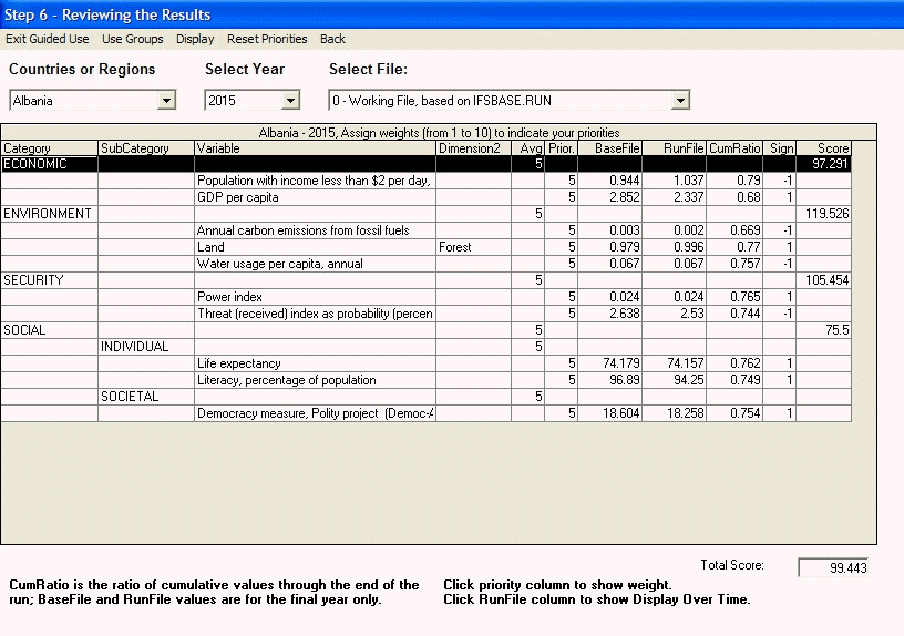
The screen below (or something similar in your analysis) contains a summary review of the results of your intervention.
This screen has the same variables that you saw in Step 3, with the weightings you either chose or left unchanged. It also has, however, several new elements:
- Columns that show the value of each variable at the end of your end horizon (and for the country/region or grouping of your choice) from the Base Case and from the Working Run File generated by your scenario intervention. You will notice two things about those values. They are changed for most variables (everything affects everything) and the changes are not usually very great (it is difficult to move the world with a policy intervention).
- A cumulative ratio of the values for each variable over the entire time horizon (the sum of values across time in the Working Run File divided by the sum across time in the Base Case).
- Scores for each variable. 100 is the default score when nothing is changed by your scenario. Values above are positive and values below are negative.
- The number in the Sign column indicates whether a higher numerical value for a variable would be considered positive ("1") or negative ("-1"). The signs are also set in the Define Priorities window, but most have default values with which you will agree.
An intervention such as higher educational spending might be expected to improve literacy rates, but because it squeezes health expenditures to lower life expectancy. Such an intervention may or may not raise levels of GDP per capita or to change income distribution and so on. Do the affects of your intervention seem reasonable? What do you think of your scenario? How might it be improved?
In this step you may spend some time learning more about the structure of the model and how it generated the results you obtained. For instance, you might use the Display features (again you will recognize the set of options from Lesson 1) to see more detail behind the basic review of results and to learn more about the relationships within IFs. You can click on tables of results to call up explanations of the variables in them. You may also benefit in your use of IFs by referring to a book written about the model and its use.
In general, scenario analysis is an iterative process involving thinking about results and learning from them, on one hand, and changing the intervention, on the other. When you are ready, back up to Step 4 and change your scenario.
