World Bank: Difference between revisions
Kexin.Shang (talk | contribs) |
|||
| Line 64: | Line 64: | ||
To download, click <Download Options> in right hand corner. Then click <Excel> and an Excel dataset will immediately download. | To download, click <Download Options> in right hand corner. Then click <Excel> and an Excel dataset will immediately download. | ||
[[File:WB WDI IMG STEP 08(2).jpg|center|thumb|501x501px|WDI page with download options]] | [[File:WB WDI IMG STEP 08(2).jpg|center|thumb|501x501px|WDI page with download options]] | ||
# | |||
== Notes for Updates in Jul. 2024 == | |||
We updated 82 series from WDI, 71 of them are preprocessors and 11 non preprocessors. | |||
{| class="wikitable" | |||
|Variable | |||
|Definition | |||
|Units | |||
|Years | |||
|UsedInPreprocessor | |||
|UsedInPreprocessorFileName | |||
|Code in Source | |||
|Decimal Places | |||
|Formula | |||
|- | |||
|ArmsImp%TotImp | |||
|Arms imports (SIPRI trend indicator values) | |||
|Percent | |||
|1960-2022 | |||
|1 | |||
|ECONOMY | |||
|MS.MIL.MPRT.KD | |||
|3 | |||
|%'NE.IMP.GNFS.CD' | |||
|- | |||
|XDebtPNG%GDP | |||
|External debt, private non-guaranteed, as percentage of gross domestic product | |||
|Percent | |||
|1970-2022 | |||
|1 | |||
|ECONOMY | |||
|DT.DOD.DPNG.CD | |||
|4 | |||
|%'NY.GDP.MKTP.CD' | |||
|- | |||
|XDebtPPG%GDP | |||
|External debt, public and publicly guaranteed, as percentage of gross domestic product | |||
|Percent | |||
|1970-2022 | |||
|1 | |||
|ECONOMY | |||
|DT.DOD.DPPG.CD | |||
|4 | |||
|%'NY.GDP.MKTP.CD' | |||
|- | |||
|XFlowsIDA%GDP | |||
|Net flows from IDA as % of GDP | |||
|Percent | |||
|1970-2022 | |||
|1 | |||
|ECONOMY | |||
|DT.NFL.MIDA.CD | |||
|4 | |||
|%'NY.GDP.MKTP.CD' | |||
|- | |||
|XFlowsIMFNonCon%GDP | |||
|Net nonconcessional flows from IMF as % of GDP | |||
|Percent | |||
|1970-2022 | |||
|1 | |||
|ECONOMY | |||
|DT.NFL.IMFN.CD | |||
|4 | |||
|%'NY.GDP.MKTP.CD' | |||
|- | |||
|XIMFCredit%GDP | |||
|IMF credits as % of GDP | |||
|Percent | |||
|1970-2022 | |||
|1 | |||
|ECONOMY | |||
|DT.DOD.DIMF.CD | |||
|4 | |||
|%'NY.GDP.MKTP.CD' | |||
|- | |||
|XIncPayments%GDP | |||
|Income payments as % of GDP | |||
|Percent | |||
|1960-2023 | |||
|1 | |||
|ECONOMY | |||
|BM.GSR.FCTY.CD | |||
|4 | |||
|%'NY.GDP.MKTP.CD' | |||
|- | |||
|XPortBonds%GDP | |||
|Portfolio investment in bonds (PPG and PNG) as % of GDP | |||
|Percent | |||
|1970-2022 | |||
|1 | |||
|ECONOMY | |||
|DT.NFL.BOND.CD | |||
|4 | |||
|%'NY.GDP.MKTP.CD' | |||
|- | |||
|XPortEquity%GDP | |||
|Portfolio investment in equity as % of GDP | |||
|Percent | |||
|1960-2023 | |||
|1 | |||
|ECONOMY | |||
|BX.PEF.TOTL.CD.WD | |||
|4 | |||
|%'NY.GDP.MKTP.CD' | |||
|- | |||
|XReserves%GDP | |||
|Gross international reserves as % of GDP | |||
|Percent | |||
|1960-2023 | |||
|1 | |||
|ECONOMY | |||
|FI.RES.TOTL.CD | |||
|4 | |||
|%'NY.GDP.MKTP.CD' | |||
|- | |||
|XFlowsIMFCon%GDP | |||
|Net concessional flows from IMF as % of GDP | |||
|Percent | |||
|1970-2022 | |||
|1 | |||
|ECONOMY | |||
|DT.NFL.IMFC.CD | |||
|4 | |||
|%'NY.GDP.MKTP.CD' | |||
|- | |||
|XIncReceipts%GDP | |||
|Income receipts as % of GDP | |||
|Percent | |||
|1960-2023 | |||
|1 | |||
|ECONOMY | |||
|BX.GSR.FCTY.CD | |||
|3 | |||
|%'NY.GDP.MKTP.CD' | |||
|- | |||
|XFlowsIBRD%GDP | |||
|Net flows from IBRD as % of GDP | |||
|Percent | |||
|1970-2022 | |||
|1 | |||
|ECONOMY | |||
|DT.NFL.MIBR.CD | |||
|4 | |||
|%'NY.GDP.MKTP.CD' | |||
|- | |||
|XWBLoans%GDP | |||
|IBRD loans and IDA credits as % of GDP | |||
|Percent | |||
|1970-2022 | |||
|1 | |||
|ECONOMY | |||
|DT.DOD.MWBG.CD | |||
|4 | |||
|%'NY.GDP.MKTP.CD' | |||
|- | |||
|GovtCurRev%GDP | |||
|Current government revenue as % of GDP | |||
|Percent | |||
|1972-2022 | |||
|1 | |||
|ECONOMY | |||
|GC.REV.XGRT.GD.ZS | |||
|3 | |||
|%'NY.GDP.MKTP.CD' | |||
|- | |||
|ExportServices%GDP | |||
|Exports of services as % of GDP | |||
|Percent | |||
|1960-2023 | |||
|1 | |||
|ECONOMY | |||
|BX.GSR.NFSV.CD | |||
|4 | |||
|%'NY.GDP.MKTP.CD' | |||
|- | |||
|ExportsMerchandise%GDP | |||
|Exports of merchandise as % of GDP | |||
|Percent | |||
|1960-2023 | |||
|1 | |||
|ECONOMY | |||
|TX.VAL.MRCH.CD.WT | |||
|4 | |||
|%'NY.GDP.MKTP.CD' | |||
|- | |||
|ImportServices%GDP | |||
|Imports of Services as % of GDP | |||
|Percent | |||
|1960-2023 | |||
|1 | |||
|ECONOMY | |||
|BM.GSR.NFSV.CD | |||
|4 | |||
|%'NY.GDP.MKTP.CD' | |||
|- | |||
|ImportsMerchandise%GDP | |||
|Imports of merchandiseas % of GDP | |||
|Percent | |||
|1960-2023 | |||
|1 | |||
|ECONOMY | |||
|TM.VAL.MRCH.CD.WT | |||
|4 | |||
|%'NY.GDP.MKTP.CD' | |||
|- | |||
|XWorkerRemitPaid%GDP | |||
|Worker remittances by country where paid as % of GDP | |||
|Percent | |||
|1970-2023 | |||
|1 | |||
|ECONOMY | |||
|BM.TRF.PWKR.CD.DT | |||
|4 | |||
|%'NY.GDP.MKTP.CD' | |||
|- | |||
|XWorkerRemitReceived%GDP | |||
|Worker remittances received by country as % of GDP | |||
|Percent | |||
|1970-2023 | |||
|1 | |||
|ECONOMY | |||
|BX.TRF.PWKR.CD.DT | |||
|4 | |||
|%'NY.GDP.MKTP.CD' | |||
|- | |||
|XDebt%GDP | |||
|External debt as percentage of gross domestic product | |||
|Percent | |||
|1970-2022 | |||
|1 | |||
|ECONOMY | |||
|DT.DOD.DECT.CD | |||
|4 | |||
|%'NY.GDP.MKTP.CD' | |||
|- | |||
|NetForeignAssets%GDP | |||
|Net Foreign Assets (current LCU) as a percent of GDP. | |||
|Percent | |||
|1960-2023 | |||
|0 | |||
| | |||
|FM.AST.NFRG.CN | |||
|4 | |||
|%'NY.GDP.MKTP.CN' | |||
|- | |||
|Labor | |||
|Labor force size | |||
|Millions | |||
|1991-2023 | |||
|1 | |||
|POPULATION | |||
|SL.TLF.TOTL.IN | |||
|4 | |||
|/1000000 | |||
|- | |||
|PopulationUrban | |||
|Urban population | |||
|Millions | |||
|1960-2023 | |||
|1 | |||
|POPULATION | |||
|SP.URB.TOTL | |||
|4 | |||
|/1000000 | |||
|- | |||
|GDPCurDol | |||
|Gross Domestic Product in Current US$ | |||
|Billion $ | |||
|1960-2023 | |||
|1 | |||
|ENERGY | |||
|NY.GDP.MKTP.CD | |||
|4 | |||
|/1000000000 | |||
|- | |||
|Xdebt | |||
|External long-term (more than 1 year) debt: public, publically guaranteed and priv nonguaranteed | |||
|Billion $ | |||
|1970-2022 | |||
|1 | |||
|ECONOMY | |||
|DT.DOD.DLXF.CD | |||
|4 | |||
|/1000000000 | |||
|- | |||
|LaborFemale% | |||
|Portion of labor force made up by women | |||
|Percent | |||
|1991-2023 | |||
|1 | |||
|POPULATION | |||
|SL.TLF.TOTL.FE.ZS | |||
|4 | |||
| | |||
|- | |||
|LaborSecInd%Tot | |||
|Labor in industry as % of total | |||
|Percent | |||
|1991-2022 | |||
|0 | |||
| | |||
|SL.IND.EMPL.ZS | |||
|4 | |||
| | |||
|- | |||
|LaborSecSer%Tot | |||
|Labor in services as % of total | |||
|Percent | |||
|1991-2022 | |||
|0 | |||
| | |||
|SL.SRV.EMPL.ZS | |||
|4 | |||
| | |||
|- | |||
|VaddInd% | |||
|Value added in industry as percent of GDP | |||
|Percent | |||
|1960-2023 | |||
|1 | |||
|ECONOMY | |||
|NV.IND.TOTL.ZS | |||
|3 | |||
| | |||
|- | |||
|OresMetsIm%MerchIm | |||
|Ores and Metals imports as % of merchandise imports | |||
|Percent | |||
|1962-2023 | |||
|1 | |||
|ECONOMY | |||
|TM.VAL.MMTL.ZS.UN | |||
|4 | |||
| | |||
|- | |||
|GovtDebt%GDP | |||
|Central government debt as % of GDP | |||
|Percent | |||
|1970-1971,1989-2022 | |||
|1 | |||
|ECONOMY | |||
|GC.DOD.TOTL.GD.ZS | |||
|4 | |||
| | |||
|- | |||
|VaddMan% | |||
|Value added in manufacturing as percent of GDP | |||
|Percent | |||
|1960-2023 | |||
|1 | |||
|ECONOMY | |||
|NV.IND.MANF.ZS | |||
|3 | |||
| | |||
|- | |||
|PopForeign% | |||
|Foreign population as % of total population | |||
|Percent | |||
|1990, 1995, 2000, 2005, 2010, 2015 | |||
|0 | |||
| | |||
|SM.POP.TOTL.ZS | |||
|4 | |||
| | |||
|- | |||
|LaborAgriSector | |||
|Agricultural labor force as % of total employment, ISIC multiple revisions | |||
|Percent | |||
|1991-2022 | |||
|1 | |||
|ECONOMY | |||
|SL.AGR.EMPL.ZS | |||
|3 | |||
| | |||
|- | |||
|GenderUnpaidDomesticWorkTimeFemale | |||
|Proportion of time spent on unpaid domestic and care work, female (% of 24 hour day). | |||
|Percent | |||
|2000-2022 | |||
|0 | |||
| | |||
|SG.TIM.UWRK.FE | |||
|2 | |||
| | |||
|- | |||
|GenderUnpaidDomesticWorkTimeMale | |||
|Proportion of time spent on unpaid domestic and care work, male (% of 24 hour day). | |||
|Percent | |||
|2000-2022 | |||
|1 | |||
|POPULATION | |||
|SG.TIM.UWRK.MA | |||
|2 | |||
| | |||
|- | |||
|IncBelow2D15c% | |||
|Percentage of the population living on less than $2.15 a day at 2017 international prices, estimation by World Bank, Poverty and Inequality Platform. | |||
|Percent | |||
|1963-2023 | |||
|0 | |||
| | |||
|SI.POV.DDAY | |||
|4 | |||
| | |||
|- | |||
|IncBelow3D65c% | |||
|Percentage of the population living on less than $3.65 a day at 2017 international prices, estimation by World Bank, Poverty and Inequality Platform. | |||
|Percent | |||
|1963-2023 | |||
|0 | |||
| | |||
|SI.POV.LMIC | |||
|4 | |||
| | |||
|- | |||
|IncBelow6D85c% | |||
|Percentage of the population living on less than $6.85 a day at 2017 international prices, estimation by World Bank, Poverty and Inequality Platform. | |||
|Percent | |||
|1963-2023 | |||
|0 | |||
| | |||
|SI.POV.UMIC | |||
|4 | |||
| | |||
|- | |||
|PovGap2D15cperDay | |||
|Poverty gap at $2.15 per day (2017PPP), percent, estimation by World Bank, Poverty and Inequality Platform | |||
|Percent | |||
|1963-2023 | |||
|1 | |||
|ECONOMY | |||
|SI.POV.GAPS | |||
|4 | |||
| | |||
|- | |||
|PovGap3D65perDay | |||
|Poverty gap at $3.65 per day (2017PPP), percent, estimation by World Bank, Poverty and Inequality Platform | |||
|Percent | |||
|1963-2023 | |||
|1 | |||
|ECONOMY | |||
|SI.POV.LMIC.GP | |||
|4 | |||
| | |||
|- | |||
|PovGap6D85cperDay | |||
|Poverty gap at $6.85 per day (2017PPP), percent, estimation by World Bank, Poverty and Inequality Platform | |||
|Percent | |||
|1963-2023 | |||
|1 | |||
|ECONOMY | |||
|SI.POV.UMIC.GP | |||
|4 | |||
| | |||
|- | |||
|ExportGoodSer% | |||
|Exports of goods and services as % of GDP | |||
|Percent | |||
|1960-2023 | |||
|1 | |||
|ECONOMY | |||
|NE.EXP.GNFS.ZS | |||
|4 | |||
| | |||
|- | |||
|EnElecTransLoss% | |||
|Electric power transmission and distribution losses (% of output) | |||
|Percent | |||
|1960-2014 | |||
|1 | |||
|INFRASTRUCTURE | |||
|EG.ELC.LOSS.ZS | |||
|4 | |||
| | |||
|- | |||
|GovtEdPub%GDP | |||
|Educational expenditures (public) as percent of GDP | |||
|Percent | |||
|1970-2023 | |||
|1 | |||
|ECONOMY | |||
|SE.XPD.TOTL.GD.ZS | |||
|4 | |||
| | |||
|- | |||
|GovWBDoingBusinessCostofStarting | |||
|Cost of registring a business as a percent of per capita income | |||
|Percent | |||
|2003-2019 | |||
|1 | |||
|SOCIOPOL | |||
|IC.REG.COST.PC.ZS | |||
|4 | |||
| | |||
|- | |||
|GovtMil%GDPWDI | |||
|Military expenditures (as percent of GDP). Taiwan, China values filled by SIPRI. | |||
|Percent | |||
|1960-2022 | |||
|1 | |||
|ECONOMY | |||
|MS.MIL.XPND.GD.ZS | |||
|4 | |||
| | |||
|- | |||
|GovCon%GDP | |||
|Government (general) final consumption as % of GDP | |||
|Percent | |||
|1960-2023 | |||
|1 | |||
|ECONOMY | |||
|NE.CON.GOVT.ZS | |||
|3 | |||
| | |||
|- | |||
|GovExpense%GDP | |||
|Government expense as % of GDP (compare with govt expenditures) | |||
|Percent | |||
|1972-2022 | |||
|1 | |||
|ECONOMY | |||
|GC.XPN.TOTL.GD.ZS | |||
|3 | |||
| | |||
|- | |||
|ImportGoodSer% | |||
|Imports of goods and services as % of GDP | |||
|Percent | |||
|1960-2023 | |||
|1 | |||
|ECONOMY | |||
|NE.IMP.GNFS.ZS | |||
|4 | |||
| | |||
|- | |||
|EnElecConsPerCap | |||
|Electricity consumption per capita | |||
|KWH/Cap | |||
|1960-2019 | |||
|1 | |||
|INFRASTRUCTURE | |||
|EG.USE.ELEC.KH.PC | |||
|4 | |||
| | |||
|- | |||
|InvestGrCapForm%GDP | |||
|Gross capital formation (Investment), percent of GDP | |||
|Percent | |||
|1960-2023 | |||
|1 | |||
|ECONOMY | |||
|NE.GDI.TOTL.ZS | |||
|3 | |||
| | |||
|- | |||
|XFDIInflows%GDP | |||
|Foreign direct investment net inflow as % of GDP | |||
|Percent | |||
|1970-2022 | |||
|1 | |||
|ECONOMY | |||
|BX.KLT.DINV.WD.GD.ZS | |||
|4 | |||
| | |||
|- | |||
|XFDIOutflows%GDP | |||
|Foreign direct investment net outflow as % of GDP | |||
|Percent | |||
|1970-2022 | |||
|1 | |||
|ECONOMY | |||
|BM.KLT.DINV.WD.GD.ZS | |||
|3 | |||
| | |||
|- | |||
|IncShareL20% | |||
|Income share of poorest 20% of population | |||
|Percent | |||
|1963-2023 | |||
|1 | |||
|ECONOMY | |||
|SI.DST.FRST.20 | |||
|3 | |||
| | |||
|- | |||
|LaborUnemploy% | |||
|Labor unemployment, % of labor force | |||
|Percent | |||
|1991-2023 | |||
|1 | |||
|POPULATION | |||
|SL.UEM.TOTL.ZS | |||
|3 | |||
| | |||
|- | |||
|TaxImportDuties%Rev | |||
|Customs and other import duties (% of tax revenue) | |||
|Percent | |||
|1972-2023 | |||
|1 | |||
|ECONOMY | |||
|GC.TAX.IMPT.ZS | |||
|4 | |||
| | |||
|- | |||
|OresMetsEx%MerchEx | |||
|Ores and Metals exports as % of merchandise exports | |||
|Percent | |||
|1962-2023 | |||
|1 | |||
|ECONOMY | |||
|TX.VAL.MMTL.ZS.UN | |||
|4 | |||
| | |||
|- | |||
|PopContrUse%WDI | |||
|Prevalence of contraceptive use | |||
|Percent | |||
|1961,1963,1965-2021 | |||
|0 | |||
| | |||
|SP.DYN.CONU.ZS | |||
|4 | |||
| | |||
|- | |||
|EnElecAccess%National | |||
|Access to electric energy National (% of population) | |||
|percentage | |||
|1990-2022 | |||
|1 | |||
|INFRASTRUCTURE | |||
|EG.ELC.ACCS.ZS | |||
|4 | |||
| | |||
|- | |||
|EnElecAccess%Rural | |||
|Access to electricity in Rural areas (% of population) | |||
|percentage | |||
|1990-2022 | |||
|1 | |||
|INFRASTRUCTURE | |||
|EG.ELC.ACCS.RU.ZS | |||
|4 | |||
| | |||
|- | |||
|EnElecAccess%Urban | |||
|Access to electricity in Urban areas (% of population) | |||
|percentage | |||
|1990-2022 | |||
|1 | |||
|INFRASTRUCTURE | |||
|EG.ELC.ACCS.UR.ZS | |||
|4 | |||
| | |||
|- | |||
|MalnChil%WeightWB | |||
|Percentage of children under 5 malnourished based on weight; US benchmark | |||
|Percent | |||
|1983,1985-2023 | |||
|1 | |||
|AGRICULTURE | |||
|SH.STA.MALN.ZS | |||
|4 | |||
| | |||
|- | |||
|TaxGoodSer%CurRev | |||
|Taxes on goods and services as % of total govt revenue | |||
|Percent | |||
|1972-2022 | |||
|1 | |||
|ECONOMY | |||
|GC.TAX.GSRV.RV.ZS | |||
|3 | |||
| | |||
|- | |||
|TaxSocSec%CurRev | |||
|Social security taxes as % of total govt revenue | |||
|Percent | |||
|1972-2022 | |||
|1 | |||
|ECONOMY | |||
|GC.REV.SOCL.ZS | |||
|3 | |||
| | |||
|- | |||
|GiniExtended | |||
|Gini index of income inequality (lower = more equal) | |||
|Index | |||
|1963-2023 | |||
|1 | |||
|ECONOMY | |||
|SI.POV.GINI | |||
|3 | |||
| | |||
|- | |||
|ICTInternet%Pop | |||
|Percent of population on-line | |||
|Percent | |||
|1960,1965,1970,1975-2022 | |||
|1 | |||
|SOCIOPOL | |||
|IT.NET.USER.ZS | |||
|4 | |||
| | |||
|- | |||
|LaborAgr%TotFemale | |||
|Employees, agriculture, female as % of female employment | |||
|Percent | |||
|1991-2022 | |||
|1 | |||
|POPULATION | |||
|SL.AGR.EMPL.FE.ZS | |||
|4 | |||
| | |||
|- | |||
|VaddAg% | |||
|Value added in agriculture as percent of GDP | |||
|Percent | |||
|1960-2023 | |||
|1 | |||
|ECONOMY | |||
|NV.AGR.TOTL.ZS | |||
|3 | |||
| | |||
|- | |||
|VaddSer% | |||
|Value added in services as percent of GDP | |||
|Percent | |||
|1960-2023 | |||
|1 | |||
|ECONOMY | |||
|NV.SRV.TOTL.ZS | |||
|3 | |||
| | |||
|- | |||
|LaborAgr%TotMale | |||
|Employees, agriculture, males as % of male employment | |||
|Percent | |||
|1991-2022 | |||
|1 | |||
|POPULATION | |||
|SL.AGR.EMPL.MA.ZS | |||
|4 | |||
| | |||
|- | |||
|XCurActBal%GDP | |||
|Current account balance (% of GDP) | |||
|Percent | |||
|1960-2023 | |||
|1 | |||
|ECONOMY | |||
|BN.CAB.XOKA.GD.ZS | |||
|3 | |||
| | |||
|- | |||
|MaternalMortalityRatio | |||
|Maternal deaths per 100,000 live births | |||
|Ratio | |||
|2000-2020 | |||
|1 | |||
|POPULATION | |||
|SH.STA.MMRT | |||
|2 | |||
| | |||
|- | |||
|EnvPMWDI | |||
|PM2.5 air pollution, mean annual exposure (micrograms per cubic meter) | |||
|micrograms per cubic meter | |||
|1990,1995,2000,2005,2010-2019 | |||
|1 | |||
|ENVIRONMENT | |||
|EN.ATM.PM25.MC.M3 | |||
|5 | |||
| | |||
|- | |||
|ChildStuntingPercentWDI | |||
|Stunting (Height for age) amongst children aged under the age of 5 | |||
|Percent | |||
|1983,1985-2023 | |||
|1 | |||
|HEALTH | |||
|SH.STA.STNT.ZS | |||
|5 | |||
| | |||
|- | |||
|HealthMalarBedNetsWDI | |||
|Use of insecticide-treated bed nets (% of under-5 population) | |||
|Percent | |||
|1999-2021 | |||
|1 | |||
|HEALTH | |||
|SH.MLR.NETS.ZS | |||
|3 | |||
| | |||
|- | |||
|AidRecGrant%TotRev | |||
|Grants and other revenue include grants from other foreign governments, international organizations, and other government units; | |||
|Percent | |||
|1972-2022 | |||
|1 | |||
|ECONOMY | |||
|GC.REV.GOTR.ZS | |||
|3 | |||
| | |||
|- | |||
|IncBelowNPL%WDI | |||
|Population below national poverty line | |||
|Percent | |||
|1985-2023 | |||
|1 | |||
|ECONOMY | |||
|SI.POV.NAHC | |||
|1 | |||
| | |||
|- | |||
|ICTImport%Imp | |||
|Imports of ICT goods as % of total goods imports | |||
|Percent | |||
|2000-2021 | |||
|0 | |||
| | |||
|TM.VAL.ICTG.ZS.UN | |||
|2 | |||
| | |||
|- | |||
|ICTExport%Exp | |||
|Exports of ICT goods as % of total goods exports | |||
|Percent | |||
|2000-2021 | |||
|0 | |||
| | |||
|TX.VAL.ICTG.ZS.UN | |||
|2 | |||
| | |||
|} | |||
# Download CSV file from https://datacatalog.worldbank.org/search/dataset/0037712/World-Development-Indicators | |||
# Open the WDICSV.csv file. | |||
# Use the "'''Code in Source'''" from the DataDict and "Indicator Code" from WDICSV file to preprare the series. | |||
# Be care of the "Formula", if there is a "%'''XXXX'''"(the XXXX is the "Indicator Code"), then you need to use the series divide the series after "%". The series after "%" also in the WDICSV. | |||
## Please keep in mind *100 after you finish the division to make it in "'''Percent'''" instead of decimal. | |||
## Always applying "'''round'''" function after you applied multiplying 100. | |||
# The "'''Years'''" for some series are discountinued, please remove the years with all "Nulls" before importing. | |||
# Blending with Old data in IFsHistSeries: | |||
## A country that has data in the previous release but not anymore. For this case, we need to bring the data in unless we have a solid proof to say they delete a country's data on purpose. For example, in the table GovCon%GDP, Nigeria used to have values, but the new table has all nulls for it because WDI somehow removes values for Nigeria. | |||
## Some historical years of data are missing completely for all countries. WDI does this every now and then. For example, for certain tables, it used to have coverage back to 1960, then along the updates WDI only offers data back to 1980 or even 2000. | |||
Revision as of 17:24, 12 October 2024
SUMMARY
The World Bank's Open Data is an initiative from the the World Bank Group to produce reliable data about its member countries, including a number of macro, financial, and sector databases. Their datasets include ones focused on development, aid effectiveness, climate change, economy, education, debt, infrastructure, etc. The World Bank also has a World Development Indicators (WDI) database, which is the premier compilation of cross country comparable data on development and is the primary collection of development indicators. WDI specifically contains 1,400 time series indicators from 217 economies, with much of that data going back more than 50 years. Data for Open Data and WDI is compiled from statistical systems of member countries and officially recognized international sources. Most social and economic data are updated annually or less often and some economic and financial data are updated quarterly. The WDI database is updated quarterly, sometimes more often.
The data team uses World Bank Open Data and WDI for a number of series about education, agriculture, aid, gender issues, environment, finances, economics, and development. Most importantly, WB databases are used for GDP and GDPPC. Example series from the World Bank include but are not limited to, SeriesAgFoodProductIndex, SeriesAidRec%GNI, SeriesCompanyValue%GDP, SeriesExportImport%GDP.
STEPS TO PULL DATA FROM WORLD BANK
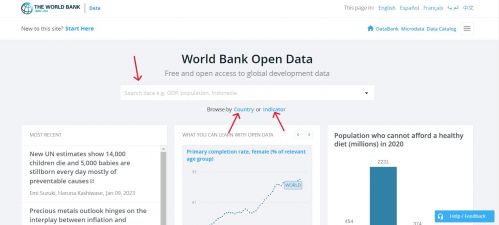
Step 1. To pull data from the world bank, navigate to data.worldbank.org
Step 2. To find the series, you can type in the search bar, click <Country> or click <Indicator>.
Step 3. Go to step 4 if clicked on <Country> or to step 7 if clicked on <Indicator>.
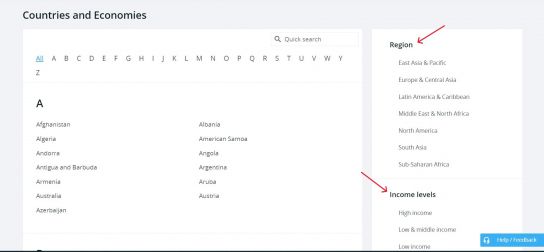
Step 4. If clicked on <Country>, you can select an individual country or options under various categories, such as <Region> and <Income levels>. This example will use the <High Income> category.
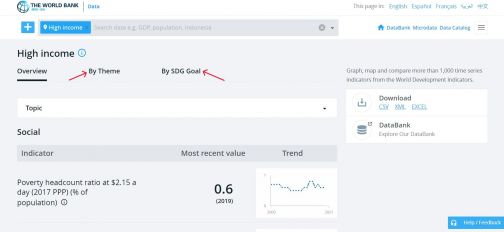
Step 5. If a category is selected, the following example screen of <High Income> will formulate. From here, select the relevant topic/theme/SDG Goal, then click on the desired indicator. Then skip to steps 10-12, which show how to download an indicator.
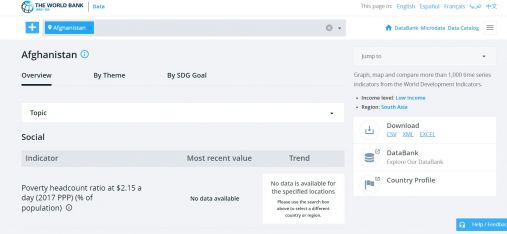
Step 6. If an individual country is selected, the following example screen will formulate. From here, select the relevant topic/theme/SDG Goal, then click on the desired indicator. Then skip to steps 10-12, which show how to download an indicator.
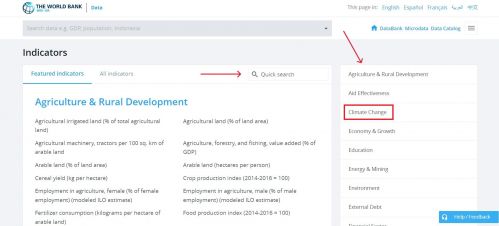
Step 7. If clicked on <Indicator>, navigate to the relevant category of the desired indicator or type in the search bar. For this example, click on the <Climate Change> category.
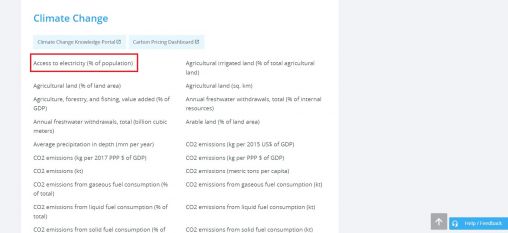
Step 8. The following page will populate. Click on <Access to electricity (% of population)> as an indicator example.
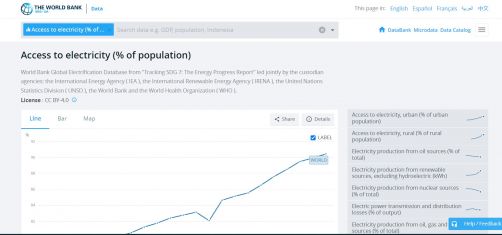
Step 9. Clicking on <Access to electricity (% of population)> will lead to this page.
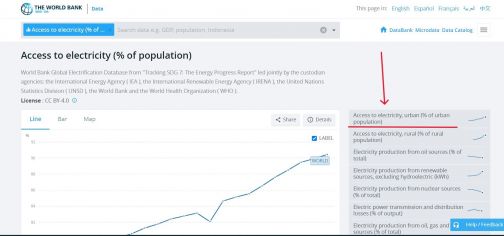
Step 10. If a more specific variable is desired, select one of the options of the right side. As an example, <Access to electricity, urban (% of urban population)> is showed here.
Step 11. Before downloading, select desired time range on the sliding scale beneath the graph.
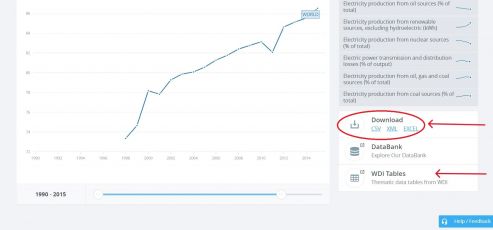
Step 12. On the right side of the graph, under <Download>, click <EXCEL>. An excel data set will immediately download. You may also click <WDI Tables> to see the data in a slightly different format.
STEPS TO PULL DATA FROM WORLD BANK WDI (WORLD DEVELOPMENT INDICATORS)
Step 1. To pull data from the World Bank's World Development Indicators database, navigate to https://databank.worldbank.org/source/world-development-indicators
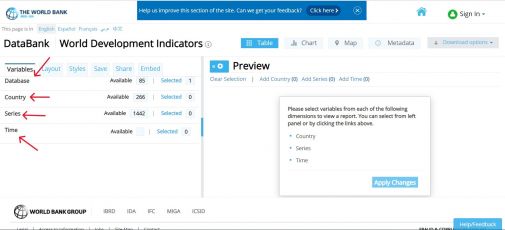
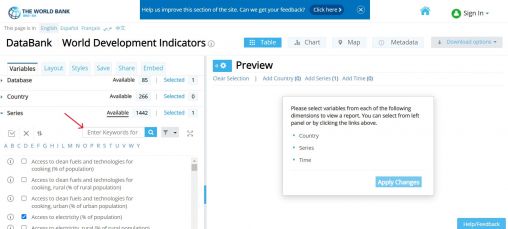
Step 2. In order to pull data, you'll need to first make selections regarding the database to pull from, countries, series, and time. These variables are on the left hand side.
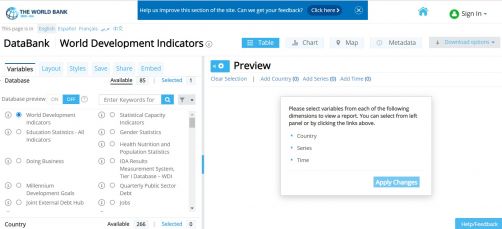
Step 3. First, select a database. This example will stay with WDI.
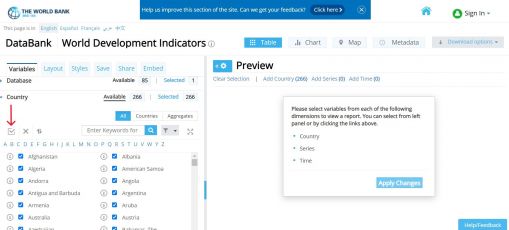
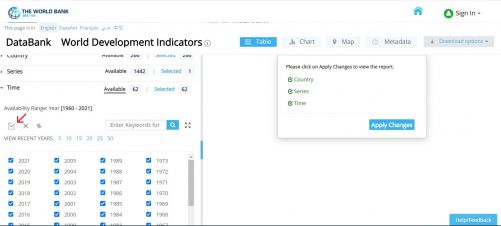
Step 4. Second, select the countries to include in the data. To choose all countries, click the checkbox above the list of country names.
Step 5. Third, select series from keywords or alphabetical list. This example will choose <Access to electricity, (% of population)>.
Step 6. Finally, select time as range of years. To choose all years, click the checkbox above the list of years.
.
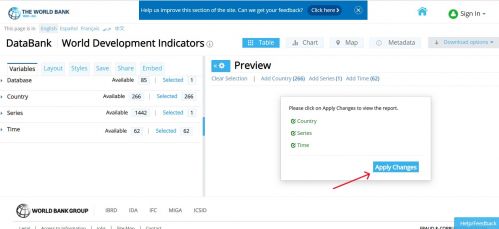
Step 7. When all variables have been selected, click <Apply Changes>.
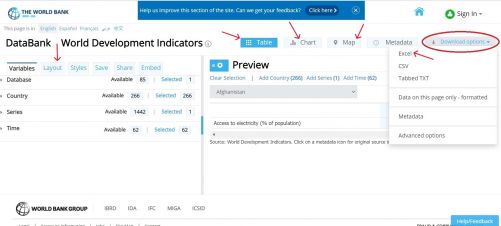
Step 8. The following preview page will formulate. You can also adjust the layout on the left side under the <Layout> tab, and you can preview data in different formats by clicking on <Table>, <Chart>, and <Map>.
To download, click <Download Options> in right hand corner. Then click <Excel> and an Excel dataset will immediately download.
Notes for Updates in Jul. 2024
We updated 82 series from WDI, 71 of them are preprocessors and 11 non preprocessors.
| Variable | Definition | Units | Years | UsedInPreprocessor | UsedInPreprocessorFileName | Code in Source | Decimal Places | Formula |
| ArmsImp%TotImp | Arms imports (SIPRI trend indicator values) | Percent | 1960-2022 | 1 | ECONOMY | MS.MIL.MPRT.KD | 3 | %'NE.IMP.GNFS.CD' |
| XDebtPNG%GDP | External debt, private non-guaranteed, as percentage of gross domestic product | Percent | 1970-2022 | 1 | ECONOMY | DT.DOD.DPNG.CD | 4 | %'NY.GDP.MKTP.CD' |
| XDebtPPG%GDP | External debt, public and publicly guaranteed, as percentage of gross domestic product | Percent | 1970-2022 | 1 | ECONOMY | DT.DOD.DPPG.CD | 4 | %'NY.GDP.MKTP.CD' |
| XFlowsIDA%GDP | Net flows from IDA as % of GDP | Percent | 1970-2022 | 1 | ECONOMY | DT.NFL.MIDA.CD | 4 | %'NY.GDP.MKTP.CD' |
| XFlowsIMFNonCon%GDP | Net nonconcessional flows from IMF as % of GDP | Percent | 1970-2022 | 1 | ECONOMY | DT.NFL.IMFN.CD | 4 | %'NY.GDP.MKTP.CD' |
| XIMFCredit%GDP | IMF credits as % of GDP | Percent | 1970-2022 | 1 | ECONOMY | DT.DOD.DIMF.CD | 4 | %'NY.GDP.MKTP.CD' |
| XIncPayments%GDP | Income payments as % of GDP | Percent | 1960-2023 | 1 | ECONOMY | BM.GSR.FCTY.CD | 4 | %'NY.GDP.MKTP.CD' |
| XPortBonds%GDP | Portfolio investment in bonds (PPG and PNG) as % of GDP | Percent | 1970-2022 | 1 | ECONOMY | DT.NFL.BOND.CD | 4 | %'NY.GDP.MKTP.CD' |
| XPortEquity%GDP | Portfolio investment in equity as % of GDP | Percent | 1960-2023 | 1 | ECONOMY | BX.PEF.TOTL.CD.WD | 4 | %'NY.GDP.MKTP.CD' |
| XReserves%GDP | Gross international reserves as % of GDP | Percent | 1960-2023 | 1 | ECONOMY | FI.RES.TOTL.CD | 4 | %'NY.GDP.MKTP.CD' |
| XFlowsIMFCon%GDP | Net concessional flows from IMF as % of GDP | Percent | 1970-2022 | 1 | ECONOMY | DT.NFL.IMFC.CD | 4 | %'NY.GDP.MKTP.CD' |
| XIncReceipts%GDP | Income receipts as % of GDP | Percent | 1960-2023 | 1 | ECONOMY | BX.GSR.FCTY.CD | 3 | %'NY.GDP.MKTP.CD' |
| XFlowsIBRD%GDP | Net flows from IBRD as % of GDP | Percent | 1970-2022 | 1 | ECONOMY | DT.NFL.MIBR.CD | 4 | %'NY.GDP.MKTP.CD' |
| XWBLoans%GDP | IBRD loans and IDA credits as % of GDP | Percent | 1970-2022 | 1 | ECONOMY | DT.DOD.MWBG.CD | 4 | %'NY.GDP.MKTP.CD' |
| GovtCurRev%GDP | Current government revenue as % of GDP | Percent | 1972-2022 | 1 | ECONOMY | GC.REV.XGRT.GD.ZS | 3 | %'NY.GDP.MKTP.CD' |
| ExportServices%GDP | Exports of services as % of GDP | Percent | 1960-2023 | 1 | ECONOMY | BX.GSR.NFSV.CD | 4 | %'NY.GDP.MKTP.CD' |
| ExportsMerchandise%GDP | Exports of merchandise as % of GDP | Percent | 1960-2023 | 1 | ECONOMY | TX.VAL.MRCH.CD.WT | 4 | %'NY.GDP.MKTP.CD' |
| ImportServices%GDP | Imports of Services as % of GDP | Percent | 1960-2023 | 1 | ECONOMY | BM.GSR.NFSV.CD | 4 | %'NY.GDP.MKTP.CD' |
| ImportsMerchandise%GDP | Imports of merchandiseas % of GDP | Percent | 1960-2023 | 1 | ECONOMY | TM.VAL.MRCH.CD.WT | 4 | %'NY.GDP.MKTP.CD' |
| XWorkerRemitPaid%GDP | Worker remittances by country where paid as % of GDP | Percent | 1970-2023 | 1 | ECONOMY | BM.TRF.PWKR.CD.DT | 4 | %'NY.GDP.MKTP.CD' |
| XWorkerRemitReceived%GDP | Worker remittances received by country as % of GDP | Percent | 1970-2023 | 1 | ECONOMY | BX.TRF.PWKR.CD.DT | 4 | %'NY.GDP.MKTP.CD' |
| XDebt%GDP | External debt as percentage of gross domestic product | Percent | 1970-2022 | 1 | ECONOMY | DT.DOD.DECT.CD | 4 | %'NY.GDP.MKTP.CD' |
| NetForeignAssets%GDP | Net Foreign Assets (current LCU) as a percent of GDP. | Percent | 1960-2023 | 0 | FM.AST.NFRG.CN | 4 | %'NY.GDP.MKTP.CN' | |
| Labor | Labor force size | Millions | 1991-2023 | 1 | POPULATION | SL.TLF.TOTL.IN | 4 | /1000000 |
| PopulationUrban | Urban population | Millions | 1960-2023 | 1 | POPULATION | SP.URB.TOTL | 4 | /1000000 |
| GDPCurDol | Gross Domestic Product in Current US$ | Billion $ | 1960-2023 | 1 | ENERGY | NY.GDP.MKTP.CD | 4 | /1000000000 |
| Xdebt | External long-term (more than 1 year) debt: public, publically guaranteed and priv nonguaranteed | Billion $ | 1970-2022 | 1 | ECONOMY | DT.DOD.DLXF.CD | 4 | /1000000000 |
| LaborFemale% | Portion of labor force made up by women | Percent | 1991-2023 | 1 | POPULATION | SL.TLF.TOTL.FE.ZS | 4 | |
| LaborSecInd%Tot | Labor in industry as % of total | Percent | 1991-2022 | 0 | SL.IND.EMPL.ZS | 4 | ||
| LaborSecSer%Tot | Labor in services as % of total | Percent | 1991-2022 | 0 | SL.SRV.EMPL.ZS | 4 | ||
| VaddInd% | Value added in industry as percent of GDP | Percent | 1960-2023 | 1 | ECONOMY | NV.IND.TOTL.ZS | 3 | |
| OresMetsIm%MerchIm | Ores and Metals imports as % of merchandise imports | Percent | 1962-2023 | 1 | ECONOMY | TM.VAL.MMTL.ZS.UN | 4 | |
| GovtDebt%GDP | Central government debt as % of GDP | Percent | 1970-1971,1989-2022 | 1 | ECONOMY | GC.DOD.TOTL.GD.ZS | 4 | |
| VaddMan% | Value added in manufacturing as percent of GDP | Percent | 1960-2023 | 1 | ECONOMY | NV.IND.MANF.ZS | 3 | |
| PopForeign% | Foreign population as % of total population | Percent | 1990, 1995, 2000, 2005, 2010, 2015 | 0 | SM.POP.TOTL.ZS | 4 | ||
| LaborAgriSector | Agricultural labor force as % of total employment, ISIC multiple revisions | Percent | 1991-2022 | 1 | ECONOMY | SL.AGR.EMPL.ZS | 3 | |
| GenderUnpaidDomesticWorkTimeFemale | Proportion of time spent on unpaid domestic and care work, female (% of 24 hour day). | Percent | 2000-2022 | 0 | SG.TIM.UWRK.FE | 2 | ||
| GenderUnpaidDomesticWorkTimeMale | Proportion of time spent on unpaid domestic and care work, male (% of 24 hour day). | Percent | 2000-2022 | 1 | POPULATION | SG.TIM.UWRK.MA | 2 | |
| IncBelow2D15c% | Percentage of the population living on less than $2.15 a day at 2017 international prices, estimation by World Bank, Poverty and Inequality Platform. | Percent | 1963-2023 | 0 | SI.POV.DDAY | 4 | ||
| IncBelow3D65c% | Percentage of the population living on less than $3.65 a day at 2017 international prices, estimation by World Bank, Poverty and Inequality Platform. | Percent | 1963-2023 | 0 | SI.POV.LMIC | 4 | ||
| IncBelow6D85c% | Percentage of the population living on less than $6.85 a day at 2017 international prices, estimation by World Bank, Poverty and Inequality Platform. | Percent | 1963-2023 | 0 | SI.POV.UMIC | 4 | ||
| PovGap2D15cperDay | Poverty gap at $2.15 per day (2017PPP), percent, estimation by World Bank, Poverty and Inequality Platform | Percent | 1963-2023 | 1 | ECONOMY | SI.POV.GAPS | 4 | |
| PovGap3D65perDay | Poverty gap at $3.65 per day (2017PPP), percent, estimation by World Bank, Poverty and Inequality Platform | Percent | 1963-2023 | 1 | ECONOMY | SI.POV.LMIC.GP | 4 | |
| PovGap6D85cperDay | Poverty gap at $6.85 per day (2017PPP), percent, estimation by World Bank, Poverty and Inequality Platform | Percent | 1963-2023 | 1 | ECONOMY | SI.POV.UMIC.GP | 4 | |
| ExportGoodSer% | Exports of goods and services as % of GDP | Percent | 1960-2023 | 1 | ECONOMY | NE.EXP.GNFS.ZS | 4 | |
| EnElecTransLoss% | Electric power transmission and distribution losses (% of output) | Percent | 1960-2014 | 1 | INFRASTRUCTURE | EG.ELC.LOSS.ZS | 4 | |
| GovtEdPub%GDP | Educational expenditures (public) as percent of GDP | Percent | 1970-2023 | 1 | ECONOMY | SE.XPD.TOTL.GD.ZS | 4 | |
| GovWBDoingBusinessCostofStarting | Cost of registring a business as a percent of per capita income | Percent | 2003-2019 | 1 | SOCIOPOL | IC.REG.COST.PC.ZS | 4 | |
| GovtMil%GDPWDI | Military expenditures (as percent of GDP). Taiwan, China values filled by SIPRI. | Percent | 1960-2022 | 1 | ECONOMY | MS.MIL.XPND.GD.ZS | 4 | |
| GovCon%GDP | Government (general) final consumption as % of GDP | Percent | 1960-2023 | 1 | ECONOMY | NE.CON.GOVT.ZS | 3 | |
| GovExpense%GDP | Government expense as % of GDP (compare with govt expenditures) | Percent | 1972-2022 | 1 | ECONOMY | GC.XPN.TOTL.GD.ZS | 3 | |
| ImportGoodSer% | Imports of goods and services as % of GDP | Percent | 1960-2023 | 1 | ECONOMY | NE.IMP.GNFS.ZS | 4 | |
| EnElecConsPerCap | Electricity consumption per capita | KWH/Cap | 1960-2019 | 1 | INFRASTRUCTURE | EG.USE.ELEC.KH.PC | 4 | |
| InvestGrCapForm%GDP | Gross capital formation (Investment), percent of GDP | Percent | 1960-2023 | 1 | ECONOMY | NE.GDI.TOTL.ZS | 3 | |
| XFDIInflows%GDP | Foreign direct investment net inflow as % of GDP | Percent | 1970-2022 | 1 | ECONOMY | BX.KLT.DINV.WD.GD.ZS | 4 | |
| XFDIOutflows%GDP | Foreign direct investment net outflow as % of GDP | Percent | 1970-2022 | 1 | ECONOMY | BM.KLT.DINV.WD.GD.ZS | 3 | |
| IncShareL20% | Income share of poorest 20% of population | Percent | 1963-2023 | 1 | ECONOMY | SI.DST.FRST.20 | 3 | |
| LaborUnemploy% | Labor unemployment, % of labor force | Percent | 1991-2023 | 1 | POPULATION | SL.UEM.TOTL.ZS | 3 | |
| TaxImportDuties%Rev | Customs and other import duties (% of tax revenue) | Percent | 1972-2023 | 1 | ECONOMY | GC.TAX.IMPT.ZS | 4 | |
| OresMetsEx%MerchEx | Ores and Metals exports as % of merchandise exports | Percent | 1962-2023 | 1 | ECONOMY | TX.VAL.MMTL.ZS.UN | 4 | |
| PopContrUse%WDI | Prevalence of contraceptive use | Percent | 1961,1963,1965-2021 | 0 | SP.DYN.CONU.ZS | 4 | ||
| EnElecAccess%National | Access to electric energy National (% of population) | percentage | 1990-2022 | 1 | INFRASTRUCTURE | EG.ELC.ACCS.ZS | 4 | |
| EnElecAccess%Rural | Access to electricity in Rural areas (% of population) | percentage | 1990-2022 | 1 | INFRASTRUCTURE | EG.ELC.ACCS.RU.ZS | 4 | |
| EnElecAccess%Urban | Access to electricity in Urban areas (% of population) | percentage | 1990-2022 | 1 | INFRASTRUCTURE | EG.ELC.ACCS.UR.ZS | 4 | |
| MalnChil%WeightWB | Percentage of children under 5 malnourished based on weight; US benchmark | Percent | 1983,1985-2023 | 1 | AGRICULTURE | SH.STA.MALN.ZS | 4 | |
| TaxGoodSer%CurRev | Taxes on goods and services as % of total govt revenue | Percent | 1972-2022 | 1 | ECONOMY | GC.TAX.GSRV.RV.ZS | 3 | |
| TaxSocSec%CurRev | Social security taxes as % of total govt revenue | Percent | 1972-2022 | 1 | ECONOMY | GC.REV.SOCL.ZS | 3 | |
| GiniExtended | Gini index of income inequality (lower = more equal) | Index | 1963-2023 | 1 | ECONOMY | SI.POV.GINI | 3 | |
| ICTInternet%Pop | Percent of population on-line | Percent | 1960,1965,1970,1975-2022 | 1 | SOCIOPOL | IT.NET.USER.ZS | 4 | |
| LaborAgr%TotFemale | Employees, agriculture, female as % of female employment | Percent | 1991-2022 | 1 | POPULATION | SL.AGR.EMPL.FE.ZS | 4 | |
| VaddAg% | Value added in agriculture as percent of GDP | Percent | 1960-2023 | 1 | ECONOMY | NV.AGR.TOTL.ZS | 3 | |
| VaddSer% | Value added in services as percent of GDP | Percent | 1960-2023 | 1 | ECONOMY | NV.SRV.TOTL.ZS | 3 | |
| LaborAgr%TotMale | Employees, agriculture, males as % of male employment | Percent | 1991-2022 | 1 | POPULATION | SL.AGR.EMPL.MA.ZS | 4 | |
| XCurActBal%GDP | Current account balance (% of GDP) | Percent | 1960-2023 | 1 | ECONOMY | BN.CAB.XOKA.GD.ZS | 3 | |
| MaternalMortalityRatio | Maternal deaths per 100,000 live births | Ratio | 2000-2020 | 1 | POPULATION | SH.STA.MMRT | 2 | |
| EnvPMWDI | PM2.5 air pollution, mean annual exposure (micrograms per cubic meter) | micrograms per cubic meter | 1990,1995,2000,2005,2010-2019 | 1 | ENVIRONMENT | EN.ATM.PM25.MC.M3 | 5 | |
| ChildStuntingPercentWDI | Stunting (Height for age) amongst children aged under the age of 5 | Percent | 1983,1985-2023 | 1 | HEALTH | SH.STA.STNT.ZS | 5 | |
| HealthMalarBedNetsWDI | Use of insecticide-treated bed nets (% of under-5 population) | Percent | 1999-2021 | 1 | HEALTH | SH.MLR.NETS.ZS | 3 | |
| AidRecGrant%TotRev | Grants and other revenue include grants from other foreign governments, international organizations, and other government units; | Percent | 1972-2022 | 1 | ECONOMY | GC.REV.GOTR.ZS | 3 | |
| IncBelowNPL%WDI | Population below national poverty line | Percent | 1985-2023 | 1 | ECONOMY | SI.POV.NAHC | 1 | |
| ICTImport%Imp | Imports of ICT goods as % of total goods imports | Percent | 2000-2021 | 0 | TM.VAL.ICTG.ZS.UN | 2 | ||
| ICTExport%Exp | Exports of ICT goods as % of total goods exports | Percent | 2000-2021 | 0 | TX.VAL.ICTG.ZS.UN | 2 |
- Download CSV file from https://datacatalog.worldbank.org/search/dataset/0037712/World-Development-Indicators
- Open the WDICSV.csv file.
- Use the "Code in Source" from the DataDict and "Indicator Code" from WDICSV file to preprare the series.
- Be care of the "Formula", if there is a "%XXXX"(the XXXX is the "Indicator Code"), then you need to use the series divide the series after "%". The series after "%" also in the WDICSV.
- Please keep in mind *100 after you finish the division to make it in "Percent" instead of decimal.
- Always applying "round" function after you applied multiplying 100.
- The "Years" for some series are discountinued, please remove the years with all "Nulls" before importing.
- Blending with Old data in IFsHistSeries:
- A country that has data in the previous release but not anymore. For this case, we need to bring the data in unless we have a solid proof to say they delete a country's data on purpose. For example, in the table GovCon%GDP, Nigeria used to have values, but the new table has all nulls for it because WDI somehow removes values for Nigeria.
- Some historical years of data are missing completely for all countries. WDI does this every now and then. For example, for certain tables, it used to have coverage back to 1960, then along the updates WDI only offers data back to 1980 or even 2000.
