Poverty and Inequality Platform, World Bank: Difference between revisions
Norah.Shamin (talk | contribs) |
Norah.Shamin (talk | contribs) No edit summary |
||
| Line 3: | Line 3: | ||
The last update was in June 2025. This update brought an additional 74 country-year datapoints (countries such as Barbados and Equatorial Guinea) to the PIP database and improved existing data for another 90 country-years. A detailed update can be found [https://documents1.worldbank.org/curated/en/099510306052516849/pdf/IDU-eb272b02-ecd1-4633-9e37-9297e20a711c.pdf here]. | The last update was in June 2025. This update brought an additional 74 country-year datapoints (countries such as Barbados and Equatorial Guinea) to the PIP database and improved existing data for another 90 country-years. A detailed update can be found [https://documents1.worldbank.org/curated/en/099510306052516849/pdf/IDU-eb272b02-ecd1-4633-9e37-9297e20a711c.pdf here]. | ||
Another update in August 2025 which led to the correction of three new tables. This is due to the World Bank adding a new modeling around 2021 PPP. | |||
== Tables in IFs == | == Tables in IFs == | ||
{| class="wikitable" | {| class="wikitable" | ||
|+ | |+ | ||
!Variable | !Variable | ||
!Definition | !Definition | ||
!Name In Source | |||
!UsedInPreprocessor | !UsedInPreprocessor | ||
!UsedInPreprocessorFileName | |||
!UsedInHistAnalog | !UsedInHistAnalog | ||
|- | |- | ||
|IncBelow2D15c%PIP | |IncBelow2D15c%PIP | ||
|Percent of population living on less than $2.15 per day, estimation by PIP | |Percent of population living on less than $2.15 per day, estimation by PIP | ||
|headcount | |||
|1 | |||
|ECONOMY | |||
|TRUE | |TRUE | ||
|- | |- | ||
|IncBelow3D65c%PIP | |IncBelow3D65c%PIP | ||
|Percent of population living on less than $3.65 per day, estimation by PIP | |Percent of population living on less than $3.65 per day, estimation by PIP | ||
|headcount | |||
|1 | |||
|ECONOMY | |||
|TRUE | |TRUE | ||
|- | |- | ||
|IncBelow6D85c%PIP | |IncBelow6D85c%PIP | ||
|Percent of population living on less than $6.85 per day, estimation by PIP | |Percent of population living on less than $6.85 per day, estimation by PIP | ||
|headcount | |||
|1 | |||
|ECONOMY | |||
|TRUE | |TRUE | ||
|- | |- | ||
|IncMedPIP | |IncMedPIP | ||
|Median income estimated by PIP from WorldBank, $2017 PPP per day | |Median income estimated by PIP from WorldBank, $2017 PPP per day | ||
| | |median | ||
| | |0 | ||
| | |||
|FALSE | |FALSE | ||
|- | |- | ||
|PovGap2D15cperDayPIP | |PovGap2D15cperDayPIP | ||
|Mean shortfall in income or consumption from the poverty line $2.15 a day, expressed as a percentage of the poverty line. Estimation by PIP | |Mean shortfall in income or consumption from the poverty line $2.15 a day, expressed as a percentage of the poverty line. Estimation by PIP | ||
| | |poverty_gap | ||
| | |0 | ||
| | |||
|FALSE | |FALSE | ||
|- | |- | ||
|PovGap3D55cperDayPIP | |PovGap3D55cperDayPIP | ||
|Mean shortfall in income or consumption from the poverty line $3.65 a day, expressed as a percentage of the poverty line. Estimation by PIP | |Mean shortfall in income or consumption from the poverty line $3.65 a day, expressed as a percentage of the poverty line. Estimation by PIP | ||
|poverty_gap | |||
|0 | |||
| | |||
|FALSE | |FALSE | ||
|- | |||
|PovGap6D85cperDayPIP | |||
|Mean shortfall in income or consumption from the poverty line $6.85 a day, expressed as a percentage of the poverty line. Estimation by PIP | |||
|poverty_gap | |||
|0 | |||
| | |||
|FALSE | |FALSE | ||
|- | |||
|IncBelow3D00c%PIP | |||
|Percent of population living on less than $3.00 per day, estimation by PIP | |||
|headcount | |||
|1 | |||
|ECONOMY | |||
|TRUE | |||
|- | |||
|IncBelow4D20c%PIP | |||
|Percent of population living on less than $4.20 per day, estimation by PIP | |||
|headcount | |||
|1 | |||
|ECONOMY | |||
|TRUE | |||
|- | |||
|IncBelow8D30c%PIP | |||
|Percent of population living on less than $8.30 per day, estimation by PIP | |||
|headcount | |||
|1 | |||
|ECONOMY | |||
|TRUE | |||
|- | |||
|IncMed2021PPPPIP | |||
|Median income estimated by PIP from WorldBank, $2021 PPP per day | |||
|median | |||
|0 | |||
| | |||
|FALSE | |FALSE | ||
|- | |- | ||
| | |PovGap3D00cperDayPIP | ||
|Mean shortfall in income or consumption from the poverty line $ | |Mean shortfall in income or consumption from the poverty line $3.00 a day, expressed as a percentage of the poverty line. Estimation by PIP | ||
|poverty_gap | |||
|0 | |||
| | |||
|FALSE | |FALSE | ||
|- | |||
|PovGap4D20cperDayPIP | |||
|Mean shortfall in income or consumption from the poverty line $4.20 a day, expressed as a percentage of the poverty line. Estimation by PIP | |||
|poverty_gap | |||
|0 | |||
| | |||
|FALSE | |FALSE | ||
|- | |||
|PovGap8D30cperDayPIP | |||
|Mean shortfall in income or consumption from the poverty line $8.30 a day, expressed as a percentage of the poverty line. Estimation by PIP | |||
|poverty_gap | |||
|0 | |||
| | |||
|FALSE | |FALSE | ||
|} | |} | ||
| Line 58: | Line 117: | ||
== Data Pulling Instructions == | == Data Pulling Instructions == | ||
# Go to this site (https://pip.worldbank.org/home). Make sure the mode is 2017 PPP. [[File:PIP .png|none|thumb|600x600px]] | # Go to this site (https://pip.worldbank.org/home). Make sure the mode is 2017 PPP or 2021 PPP depending on the tables you are updating. [[File:PIP .png|none|thumb|600x600px]] | ||
# Select Poverty Rate. The data you need will show up in one excel (ie if you need the poverty rate and gap for $ | # Select Poverty Rate. The data you need will show up in one excel (ie if you need the poverty rate and gap for $3.00, it will show up in one excel). You do not need to select any other indicator or countries. | ||
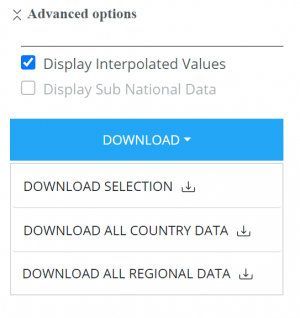
# Click Advanced options and choose Display Interpolated Values. Then click download and choose download all country data. While the excel file has different indicators you do need to download different excels for the different dollar amounts (you will have one excel for $ | # Click Advanced options and choose Display Interpolated Values. Then click download and choose download all country data. While the excel file has different indicators you do need to download different excels for the different dollar amounts (you will have one excel for $4.20, another for $3.00, etc). [[File:PIP Advanced Options .png|none|thumb]] | ||
# Filter your data by national (except for Argentina, we can use urban data. For all the other countries it must be national.) headcount, poverty_gap, and median (median is the same in all excel files) will be the indicators for your data. | # Filter your data by national (except for Argentina, we can use urban data. For all the other countries it must be national.) headcount, poverty_gap, and median (median is the same in all excel files) will be the indicators for your data. | ||
| Line 74: | Line 133: | ||
Multiply the data points by 100 to get the percentage values. | Multiply the data points by 100 to get the percentage values. | ||
The survey type must be consumption and not income. | |||
For Argentina, we can use urban data. For all the other countries it must be national. | For Argentina, we can use urban data. For all the other countries it must be national. | ||
For a country concordance table for the World Bank check this [https://github.com/n1shamin/World-Development-Indicators-Update-2025 GitHub Repo]. | For a country concordance table for the World Bank check this [https://github.com/n1shamin/World-Development-Indicators-Update-2025 GitHub Repo]. | ||
Revision as of 16:52, 29 August 2025
Summary
The Poverty and Inequality Platform (PIP) is an interactive computational tool that offers users quick access to the World Bank’s estimates of poverty, inequality, and shared prosperity. PIP provides a comprehensive view of global, regional, and country-level trends for more than 160 economies around the world. All poverty and inequality indicators are organized under the dropdown “Data”, where users can access the different measures. The visualizations available allow for multiple ways to explore PIP indicators, from cross-country and regional analyses, to country-specific and subnational, while other pages provide in-depth analyses by topic.
The last update was in June 2025. This update brought an additional 74 country-year datapoints (countries such as Barbados and Equatorial Guinea) to the PIP database and improved existing data for another 90 country-years. A detailed update can be found here.
Another update in August 2025 which led to the correction of three new tables. This is due to the World Bank adding a new modeling around 2021 PPP.
Tables in IFs
| Variable | Definition | Name In Source | UsedInPreprocessor | UsedInPreprocessorFileName | UsedInHistAnalog |
|---|---|---|---|---|---|
| IncBelow2D15c%PIP | Percent of population living on less than $2.15 per day, estimation by PIP | headcount | 1 | ECONOMY | TRUE |
| IncBelow3D65c%PIP | Percent of population living on less than $3.65 per day, estimation by PIP | headcount | 1 | ECONOMY | TRUE |
| IncBelow6D85c%PIP | Percent of population living on less than $6.85 per day, estimation by PIP | headcount | 1 | ECONOMY | TRUE |
| IncMedPIP | Median income estimated by PIP from WorldBank, $2017 PPP per day | median | 0 | FALSE | |
| PovGap2D15cperDayPIP | Mean shortfall in income or consumption from the poverty line $2.15 a day, expressed as a percentage of the poverty line. Estimation by PIP | poverty_gap | 0 | FALSE | |
| PovGap3D55cperDayPIP | Mean shortfall in income or consumption from the poverty line $3.65 a day, expressed as a percentage of the poverty line. Estimation by PIP | poverty_gap | 0 | FALSE | |
| PovGap6D85cperDayPIP | Mean shortfall in income or consumption from the poverty line $6.85 a day, expressed as a percentage of the poverty line. Estimation by PIP | poverty_gap | 0 | FALSE | |
| IncBelow3D00c%PIP | Percent of population living on less than $3.00 per day, estimation by PIP | headcount | 1 | ECONOMY | TRUE |
| IncBelow4D20c%PIP | Percent of population living on less than $4.20 per day, estimation by PIP | headcount | 1 | ECONOMY | TRUE |
| IncBelow8D30c%PIP | Percent of population living on less than $8.30 per day, estimation by PIP | headcount | 1 | ECONOMY | TRUE |
| IncMed2021PPPPIP | Median income estimated by PIP from WorldBank, $2021 PPP per day | median | 0 | FALSE | |
| PovGap3D00cperDayPIP | Mean shortfall in income or consumption from the poverty line $3.00 a day, expressed as a percentage of the poverty line. Estimation by PIP | poverty_gap | 0 | FALSE | |
| PovGap4D20cperDayPIP | Mean shortfall in income or consumption from the poverty line $4.20 a day, expressed as a percentage of the poverty line. Estimation by PIP | poverty_gap | 0 | FALSE | |
| PovGap8D30cperDayPIP | Mean shortfall in income or consumption from the poverty line $8.30 a day, expressed as a percentage of the poverty line. Estimation by PIP | poverty_gap | 0 | FALSE |
Data Pulling Instructions
- Go to this site (https://pip.worldbank.org/home). Make sure the mode is 2017 PPP or 2021 PPP depending on the tables you are updating.
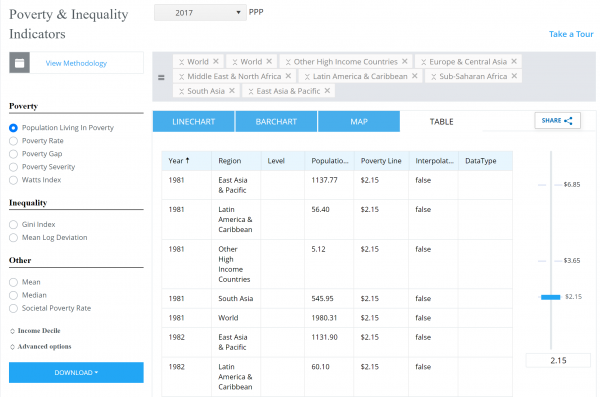
- Select Poverty Rate. The data you need will show up in one excel (ie if you need the poverty rate and gap for $3.00, it will show up in one excel). You do not need to select any other indicator or countries.
- Click Advanced options and choose Display Interpolated Values. Then click download and choose download all country data. While the excel file has different indicators you do need to download different excels for the different dollar amounts (you will have one excel for $4.20, another for $3.00, etc).
- Filter your data by national (except for Argentina, we can use urban data. For all the other countries it must be national.) headcount, poverty_gap, and median (median is the same in all excel files) will be the indicators for your data.


Notes
For the series:
- IncBelow2D15c%PIP
- IncBelow3D65c%PIP
- IncBelow6D85c%PIP
- PovGap2D15cperDayPIP
- PovGap3D55cperDayPIP
- PovGap6D85cperDayPIP
Multiply the data points by 100 to get the percentage values.
The survey type must be consumption and not income.
For Argentina, we can use urban data. For all the other countries it must be national.
For a country concordance table for the World Bank check this GitHub Repo.