Display Menu Options: Difference between revisions
No edit summary |
No edit summary |
||
| Line 55: | Line 55: | ||
With WPOPR[0] at the bottom of your screen, click on "Exit to Display". You can now make a graph of world population growth rate by clicking on graph and then on line. You should be presented with a screen that looks similar to the one below: | With WPOPR[0] at the bottom of your screen, click on "Exit to Display". You can now make a graph of world population growth rate by clicking on graph and then on line. You should be presented with a screen that looks similar to the one below: | ||
[[File:Display1.gif|frame| | [[File:Display1.gif|frame|center|Example graph of population growth rate (Self Managed Display Standard Subset)]]This graph shows you that world population growth rate is expected to fall from about 1.15% in 2000 to about .85% in 2020. | ||
Although you could now use the Standard Display form to choose and display many other variables for the countries/regions of the choice, you want instead to learn to do this exact same selection process from the full variable set. Close the table you have created. | Although you could now use the Standard Display form to choose and display many other variables for the countries/regions of the choice, you want instead to learn to do this exact same selection process from the full variable set. Close the table you have created. | ||
Revision as of 17:30, 27 July 2017
Flexible Display Example
In this example, we will compare the forecasted populations of Norway and South Korea. Firstly, from the main menu of the Self Managed Full Variable/Parameter option of IFs, type POP into the Type Name Box. Hit Enter and this variable will be selected. IFs now wants to know what country/region or group you would like to display. For this example, choose Norway. You will see POP[0] Norway Mil People appear in the Status Box for Display. Repeat the above instructions but instead of selecting Norway, choose Korea, South.
When you have one or more variables in the Status Box, you are ready to go to the display menu and actually display these variables. Click on the "Go to Display" button and you will be taken to the Display Menu. Note that the status box on the Display Menu now also indicates the variables you have selected. You now have a number of different options for displaying the variable. Highlight the Table option to create a table from the variables selected. A table will emerge with all of the variables calculated. Any number can be defined, the drivers can be displayed, the equations used to calculate the number can be displayed or the computer code can be reveled. From the Table display, you can also toggle between whole numbers and percentage change from the base, from displaying the results as cumulative or non-cumulative numbers or whether you would like to see the results as a reflection of internal averages. You also have the option of applying various filters: setting general parameters, maximum filters, minimum filters, rate level filters or range level filters. From the Table display, you can also print, save or change the time horizon.
Returning to the Display Menu, you can also begin to present the results as graphs, charts or plots. Clicking on Graph at the top of the Display Menu will present four options. The first option is to create a line graph. Holding the original variables constant, the population growth rates of South Korea and Norway, click on the line graph option.
Experiment with options on the Display Menu. Start with the creation of a table by choosing the Table option. Note that there are options on the menu of the table form for printing the table, saving it to a comma-separated-variable (.csv) file for use in a spreadsheet program like Excel or Lotus, or switching between looking at the "whole" numbers in the table or the percentage changes from year to year. You can also click on the Graph option and pick either Line or Bar sub-options.
Additionally, the Display Menu allows you to explore a differently organized set of variables that some users may find helpful. Click on the Select Names option on the Display Menu and choose Standard Subset (of variables). Learn more about the Standard Subset of Variables.
Display Options for Self-Managed Display
After you have chosen the variables/parameters you would like to display, click on the Display option. This will bring up a new window. This window is important and useful for a number of reasons. For continued usability, the most important function is choosing the Select Names option on the menu and then Full Set in order to return to the previous screen. If you don’t remember this, you will have to continuously exit the program and re-enter. Most uses will use this screen for creating graphs or tables of their information. The information below helps you walk through those steps.
The following options are available to users from the Display Menu of the Self-Managed Display:
Select Names: This option allows users to
Standard Subset: This Self-Managed Display option provides users with a differently organized set of variables and parameters.
Full Set (of variables and parameters): This Self-Managed Display option allows users to return to the Self-Managed Display Main Menu.
Table
Graph
Display Format:
Set Title, Display Interval or Year: This option allows users to change the presentation of their data. Selecting this will open a window that allows users to change the year they would like to display, the data interval and graph titles.
Currency: This feature allows users to access all currency valuations used in IFs. Users can also flag currencies by clicking the grey box located to the left of the country name. Results will be displayed in a selected currency when it is "flagged".
Format Table Legends: This option allows users to change graph labels.
Horizon: This Display feature allows users to alter the time horizon for which they would like to display.
Display Run Horizon: This allows users to select the time horizon they would like to display.
Run File Horizon Choice: When users are using multiple files, this option allows displays to be either of the shortest time horizon among the files being used or the longest time horizon.
Regional Displays: This feature allows users to display their data in map form, calculate the Gini Coefficient or display a Lorenz Curve.
History: After users have opened the IFs Base/Hist option on the Self Managed Display Full Variable/Parameter section of IFs and they have opened the Display window, this option will become available. From here, users can display data for validation or as a combination graph where the bar graph is the historic empirical data and the line graph is the historic forecast.
Self-Managed Display Standard Subset
The Self Managed Display Standard Subset sub-option can be found under the Display Menu option after experimenting with Self-Managed Display Full Set, which can be found under the Display option of the Main Menu. This display feature is a sleeker version of the Self Managed Display Full Variable/Parameter function of IFs.
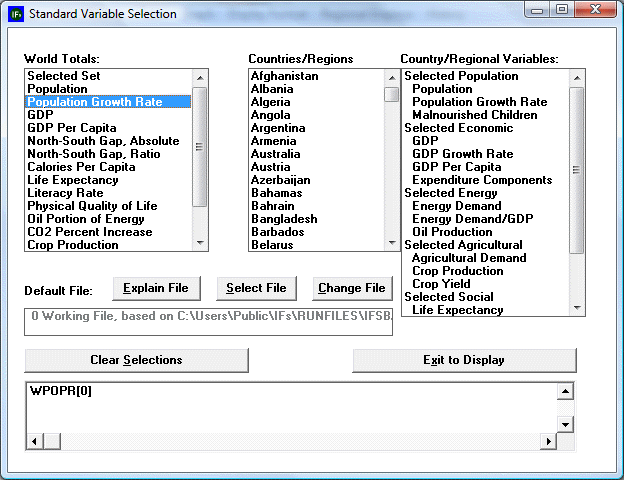
Click on the Select Names option at the top of the screen after choosing Self-Managed Displays and then on the Standard Subset sub-option. You should see the following screen:

This screen would, for example, allow you to select world population for display. First, make sure that the oblong box located at the bottom of the screen is empty by clicking on the "Clear Selections" button. In the box labeled "World Totals," use your mouse to highlight the word "Population Growth Rate." At the bottom of the screen, in what is called the "Status Box," you will see the line "WPOPR[0]." WPOPR is the variable name in the model for world population. IFs uses abbreviated variable names to keep track of variables, but you can always obtain full definitions of the variable names when you forget what they mean. For instance, click your mouse on a variable name in the Status Box and a box with options will pop up. One option provides definitions; another provides equations behind the variable, and so on. The [0] is a file name from which the variable is taken and the Explain File button will explain file names.
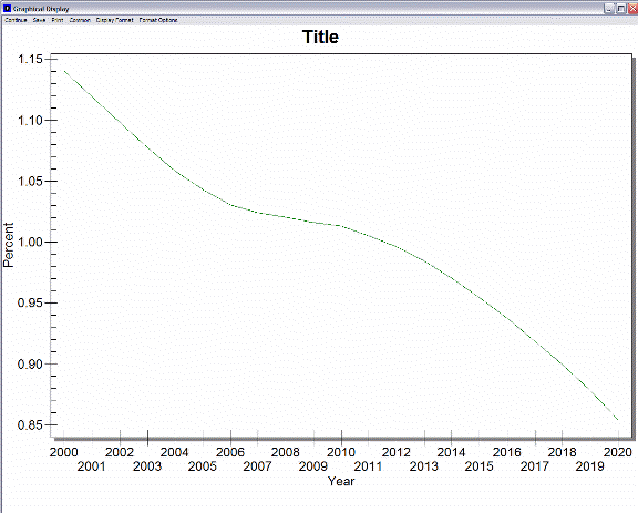
With WPOPR[0] at the bottom of your screen, click on "Exit to Display". You can now make a graph of world population growth rate by clicking on graph and then on line. You should be presented with a screen that looks similar to the one below:

This graph shows you that world population growth rate is expected to fall from about 1.15% in 2000 to about .85% in 2020.
Although you could now use the Standard Display form to choose and display many other variables for the countries/regions of the choice, you want instead to learn to do this exact same selection process from the full variable set. Close the table you have created.
Status Box for Display
This menu option of Self Managed Display Full Set of Variables/Parameters allows users to learn about and manage different scenarios and Run-Result-Files. Through this feature, you can take scenarios that you build in the Quick Scenario Tree and display different variables and parameters.
Explain File Numbering: Selecting this option brings up a new window that provides a brief explanation of Run-Result-Files.
Attach More Scenario Output Files: Most Run-Result-Files will be automatically found by IFs in the Runfiles sub directory of the IFs program directory. Occasionally, Run-Result-Files will have been saved in other locations. Selecting this option allows users to identify paths to additional directories of Run-Result-Files for display. This will open a new window that allows users to browse through their computer until they find the .run file they would like to display. Click the file you would like to display and then Open.
Explain Scenario Analysis: Selecting this option opens a new window that briefly explains scenario analysis.