World Development Indicators, World Bank: Difference between revisions
(→General Pulling Instructions for World Bank Data: Added instructions for the World Bank's WDI database) |
(Added number list) |
||
| Line 39: | Line 39: | ||
= Pulling Instructions for World Bank Data- World Development Indicators (WDI) = | = Pulling Instructions for World Bank Data- World Development Indicators (WDI) = | ||
To pull data from the World Bank's World Development Indicators database, navigate to https://databank.worldbank.org/source/world-development-indicators | |||
# To pull data from the World Bank's World Development Indicators database, navigate to https://databank.worldbank.org/source/world-development-indicators | |||
[[File:WBwdiScreenshot2.jpg|center|frameless|633x633px]] | [[File:WBwdiScreenshot2.jpg|center|frameless|633x633px]] | ||
2. In order to pull data, you'll need to first make selections regarding the database to pull from, countries, series, and time. These variables are on the left hand side. | |||
In order to pull data, you'll need to first make selections regarding the database to pull from, countries, series, and time. These variables are on the left hand side. | |||
[[File:WBwdiScreenshot9.jpg|center|frameless|600x600px]] | [[File:WBwdiScreenshot9.jpg|center|frameless|600x600px]] | ||
3. First, choose a database. This example will stay with WDI. | |||
First, choose a database. This example will stay with WDI. | |||
[[File:WBwdiScreenshot.jpg|center|frameless|606x606px]] | [[File:WBwdiScreenshot.jpg|center|frameless|606x606px]] | ||
4. Second, choose the countries to include in the data. To choose all countries, click the checkbox above the list of country names. | |||
Second, choose the countries to include in the data. To choose all countries, click the checkbox above the list of country names. | |||
[[File:WBwdiScreenshot10.jpg|center|frameless|605x605px]] | [[File:WBwdiScreenshot10.jpg|center|frameless|605x605px]] | ||
5. Third, choose series from keywords or alphabetical list. This example will choose <Access to electricity, (% of population)>. | |||
Third, choose series from keywords or alphabetical list. This example will choose <Access to electricity, (% of population)>. | |||
[[File:WBwdiScreenshot4.jpg|center|frameless|583x583px]] | [[File:WBwdiScreenshot4.jpg|center|frameless|583x583px]] | ||
6. Finally, choose time as range of years. To choose all countries, click the checkbox above the list of years. | |||
Finally, choose time as range of years. To choose all countries, click the checkbox above the list of years. | |||
[[File:WBwdiScreenshot11.jpg|center|frameless|582x582px]] | [[File:WBwdiScreenshot11.jpg|center|frameless|582x582px]] | ||
7. When all variables have been selected, click <Apply Changes>. | |||
When all variables have been selected, click <Apply Changes>. | |||
[[File:WBwdiScreenshot12.jpg|center|frameless|592x592px]] | [[File:WBwdiScreenshot12.jpg|center|frameless|592x592px]] | ||
8. The following preview page will formulate. You can also adjust the layout on the left side under the <Layout> tab, and you can preview data in different formats by clicking on <nowiki><Table>, <Chart>, and <Map>.</nowiki> | |||
The following preview page will formulate. You can also adjust the layout on the left side under the <Layout> tab, and you can preview data in different formats by clicking on <nowiki><Table>, <Chart>, and <Map>.</nowiki> | |||
[[File:WBwdiScreenshot7.jpg|center|frameless|563x563px]] | [[File:WBwdiScreenshot7.jpg|center|frameless|563x563px]] | ||
9. To download, click <Download Options> in right hand corner. Then click <Excel> and an Excel dataset will immediately download. | |||
To download, click <Download Options> in right hand corner. Then click <Excel> and an Excel dataset will immediately download. | |||
[[File:WBwdiScreenshot8.jpg|center|frameless|555x555px]] | [[File:WBwdiScreenshot8.jpg|center|frameless|555x555px]] | ||
# | # | ||
Revision as of 18:00, 12 January 2023
General Pulling Instructions for World Bank Data
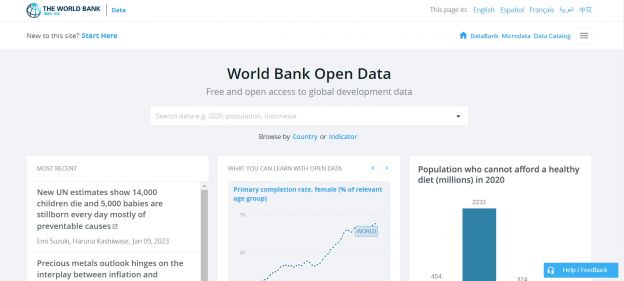
1. To pull data from the world bank, navigate to data.worldbank.org
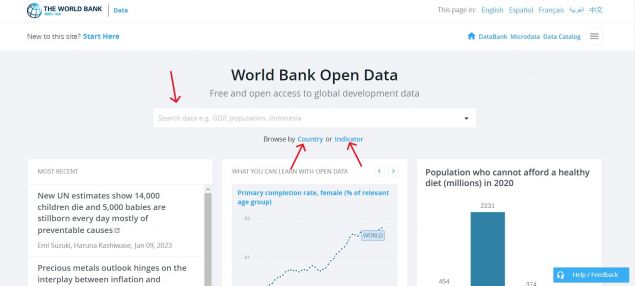
2. To find the series, you can type in the search bar, click <Country> or click <Indicator>
3. Go to step 4 if clicked on <Country> or to step 7 if clicked on <Indicator>
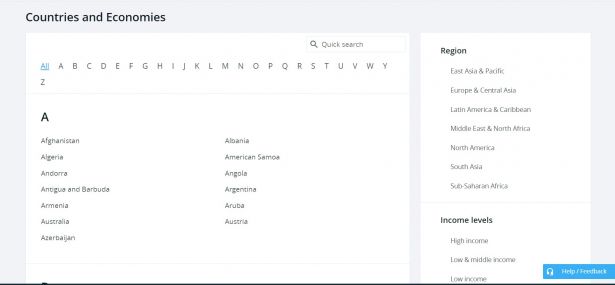
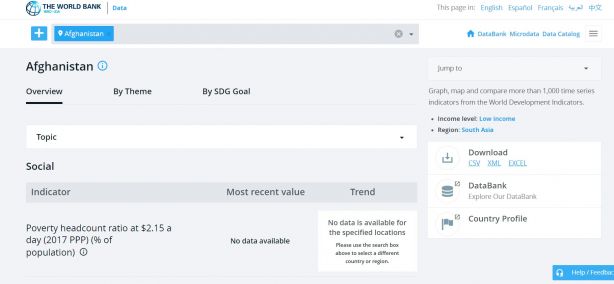
4. If clicked on <Country>, you can click on an individual country or options under various categories, such as <Region> and <Income levels>. This example will use the <High Income> category.
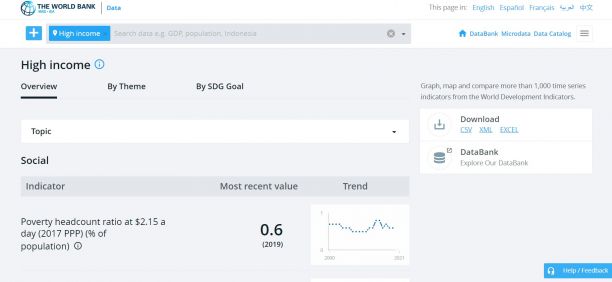
5. If a category is chosen, the following example screen of <High Income> will formulate. From here, choose the relevant topic/theme/SDG Goal, then click on the desired indicator. Then skip to steps 10-12, which show how to download an indicator.
6. If an individual country is chosen, the following example screen will formulate. From here, choose the relevant topic/theme/SDG Goal, then click on the desired indicator. Then skip to steps 10-12, which show how to download an indicator.
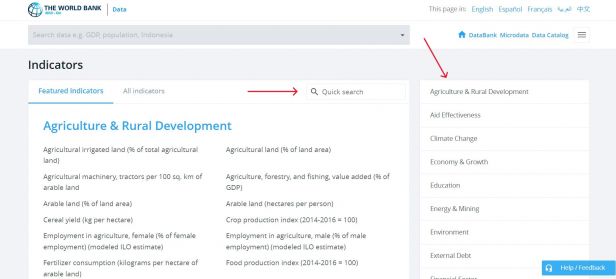
7. If clicked on <Indicator>, navigate to the relevant category of the desired indicator or type in the search bar.
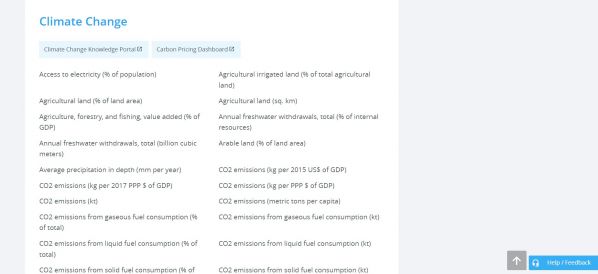
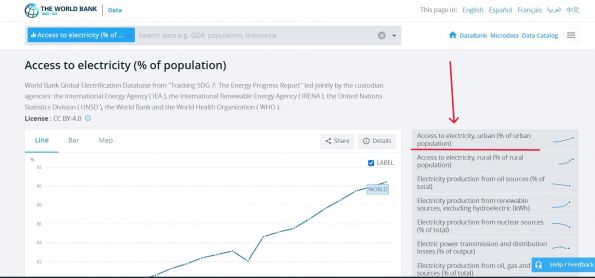
8. The indicator <Access to electricity (% of population)> will be used as an example. For this data, click on the <Climate Change> category.
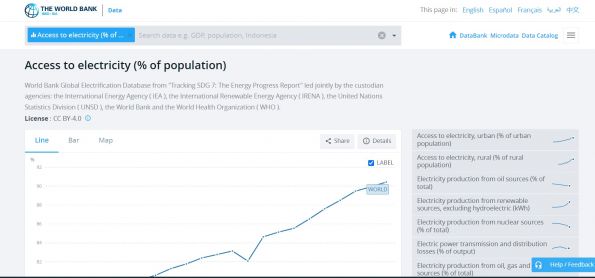
9. Clicking on <Access to electricity (% of population)> will lead to this page.
10. If a more specific variable is desired, click one of the options of the right side. As an example, <Access to electricity, urban (% of urban population)> is showed here.
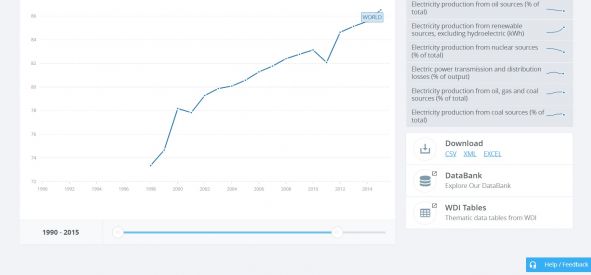
11. Before downloading, select desired time range on the sliding scale beneath the graph.
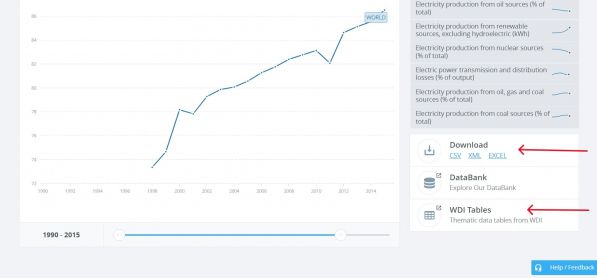
12. On the right side of the graph, under <Download>, click <EXCEL>. An excel data set will immediately download. You may also click <WDI Tables> to see the data in a slightly different format.
Pulling Instructions for World Bank Data- World Development Indicators (WDI)
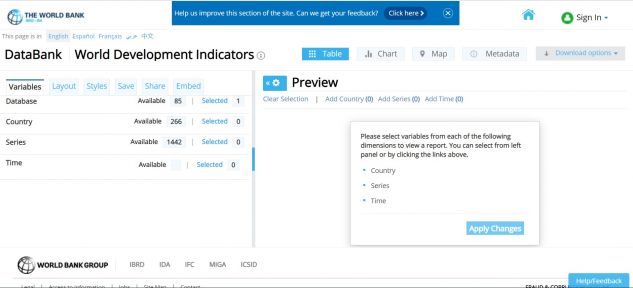
- To pull data from the World Bank's World Development Indicators database, navigate to https://databank.worldbank.org/source/world-development-indicators
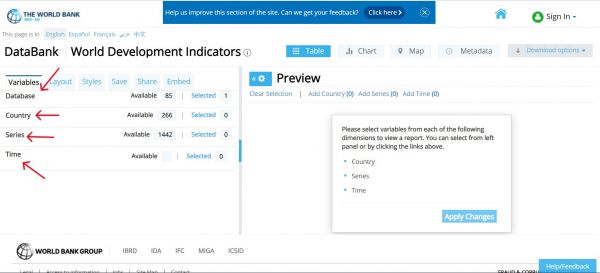
2. In order to pull data, you'll need to first make selections regarding the database to pull from, countries, series, and time. These variables are on the left hand side.
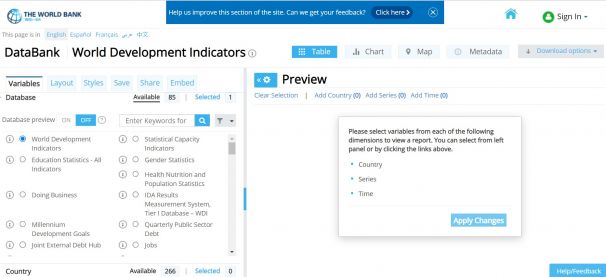
3. First, choose a database. This example will stay with WDI.
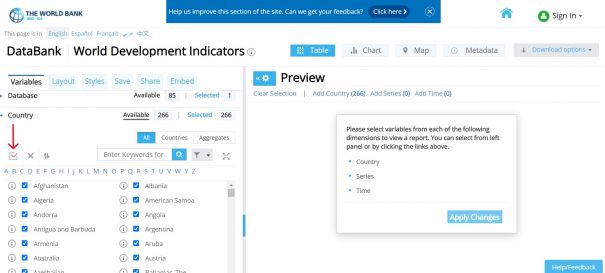
4. Second, choose the countries to include in the data. To choose all countries, click the checkbox above the list of country names.
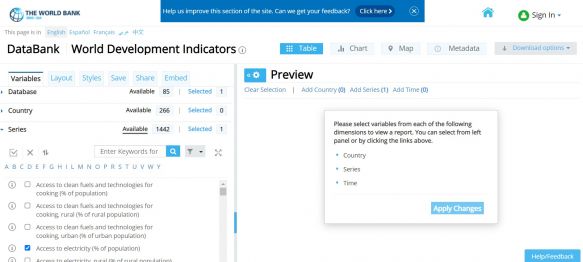
5. Third, choose series from keywords or alphabetical list. This example will choose <Access to electricity, (% of population)>.
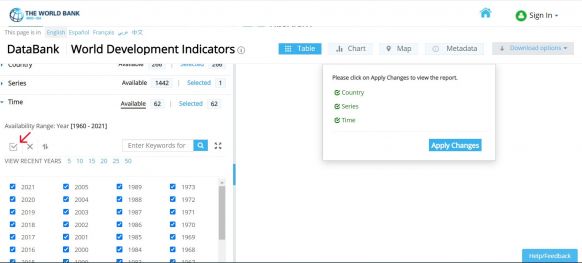
6. Finally, choose time as range of years. To choose all countries, click the checkbox above the list of years.
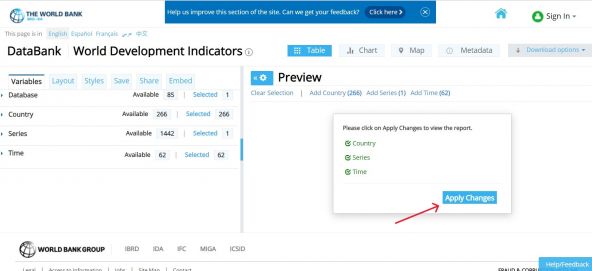
7. When all variables have been selected, click <Apply Changes>.
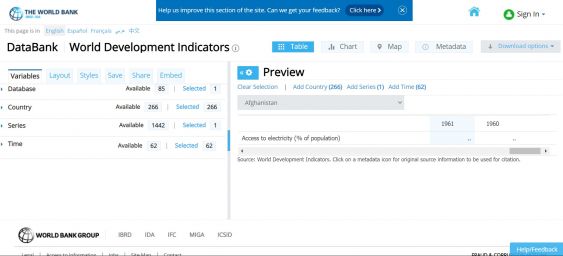
8. The following preview page will formulate. You can also adjust the layout on the left side under the <Layout> tab, and you can preview data in different formats by clicking on <Table>, <Chart>, and <Map>.
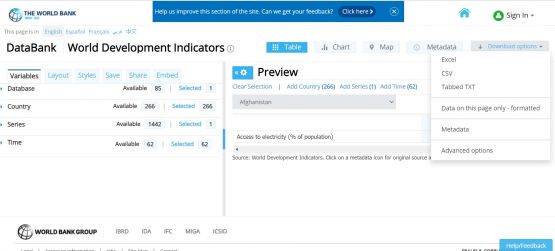
9. To download, click <Download Options> in right hand corner. Then click <Excel> and an Excel dataset will immediately download.
