FAOSTAT Food Security and Nutrition
Summary
FAOSTAT gives users access to food and agriculture data for over 245 countries and territories. Additionally, it covers all FAO regional groupings from 1961 to the most recent year available. The Suite of Food Security Indicators presents the core set of food security indicators. The choice of the indicators has been informed by expert judgment and the availability of data with sufficient coverage to enable comparisons across regions and over time. Many of these indicators are produced and published elsewhere by FAO and other international organizations. More indicators will be added to as more data will become available. Indicators are classified along the four dimensions of food security -- availability, access, utilization and stability.
The data team uses food security indicators for many series, including those related to hunger/malnutrition such as SeriesMalnDietEnSup, SeriesMalnPop%, SeriesMalnCaloricDistribution, SeriesMalnMinNutrRequired. To pull data, follow the instructions below.
FAO Food Security Pulling Steps
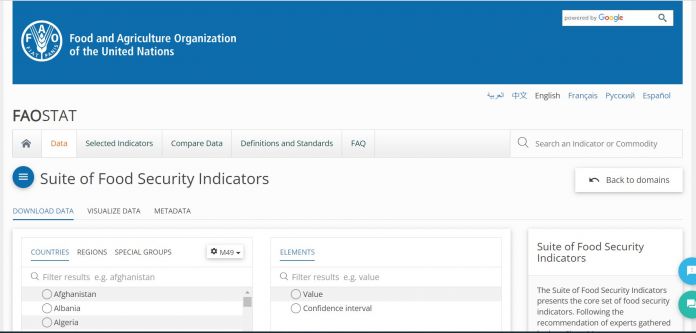
Step 1. Navigate to FAOSTAT Food Securitysite. This site will display a suite of food security indicators.
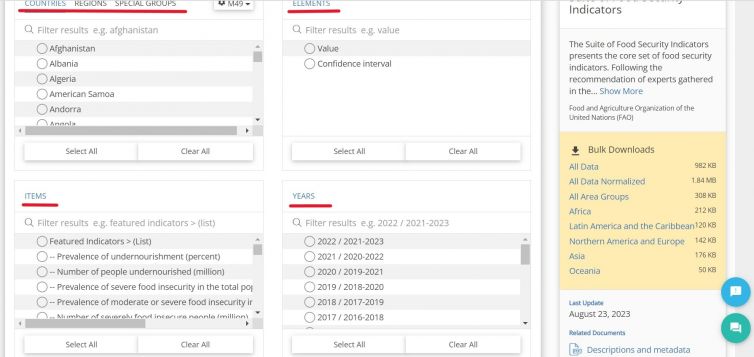
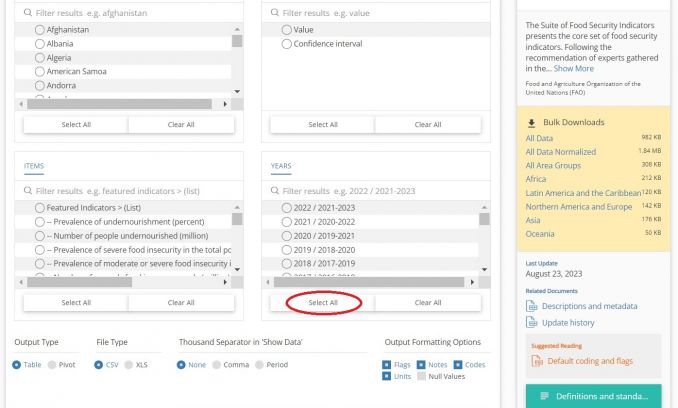
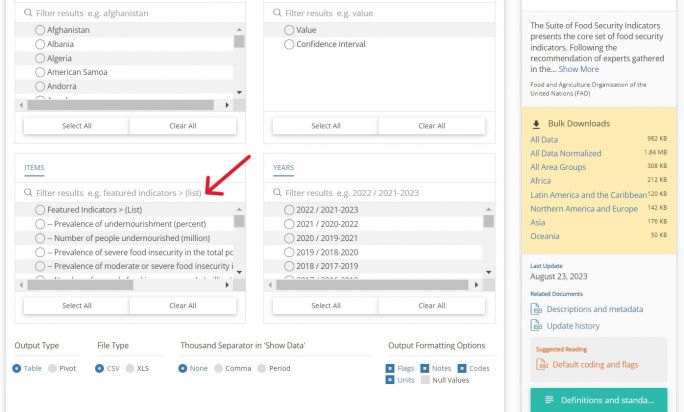
Step 2. The page displays four options that must be selected to download data: Countries/Regions/Special Groups, Elements, Years, and Items. For all these options, you can also type in a search box.
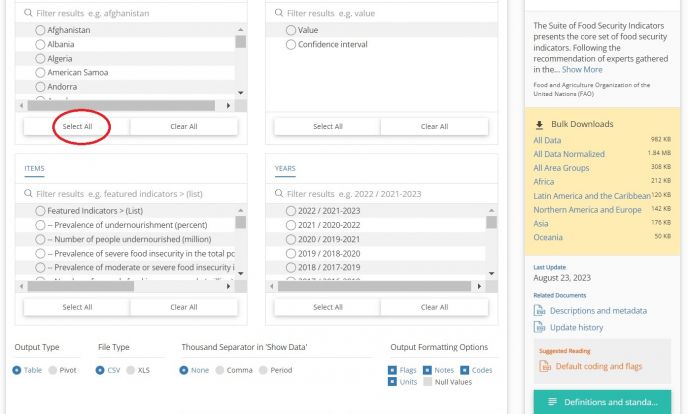
Step 3. For “Countries” options, you will generally want to select “Select All” to capture all country data.
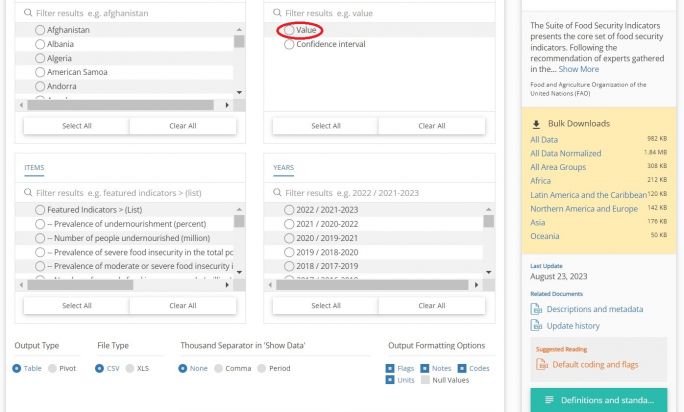
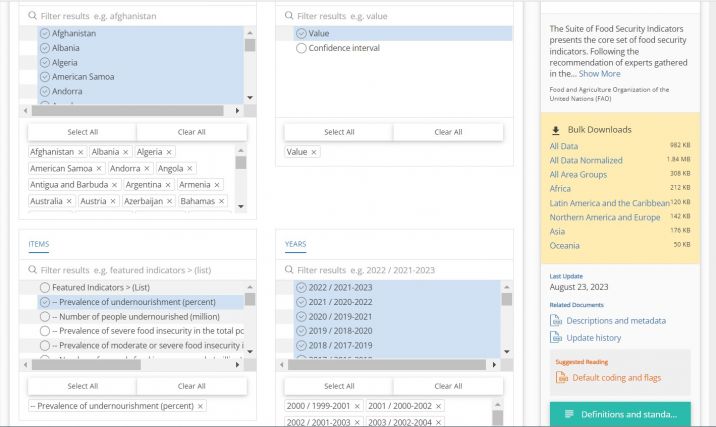
Step 4. For the “Elements” options you will most likely want to select “Value”, depending on the desired dataset.
Step 5. For “Years”, you will generally want to select “Select All” to capture all years of data available.
Step 6. For “Items”, select the desired indicator. You can also type in the search box for the indicator. This example will use “Prevalence of undernourishment (percent)”.
Step 7. After selecting for these for options, the page will display the completed selections.
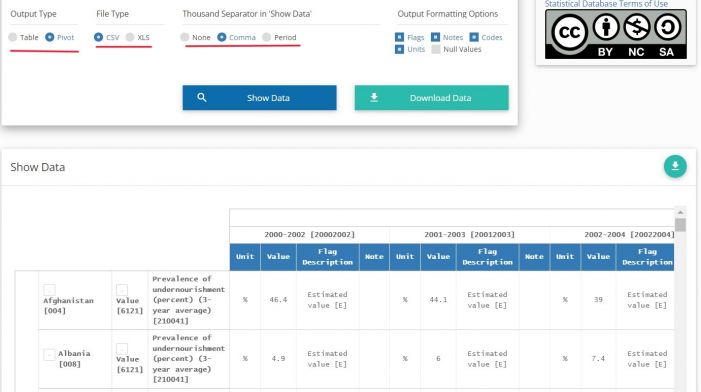
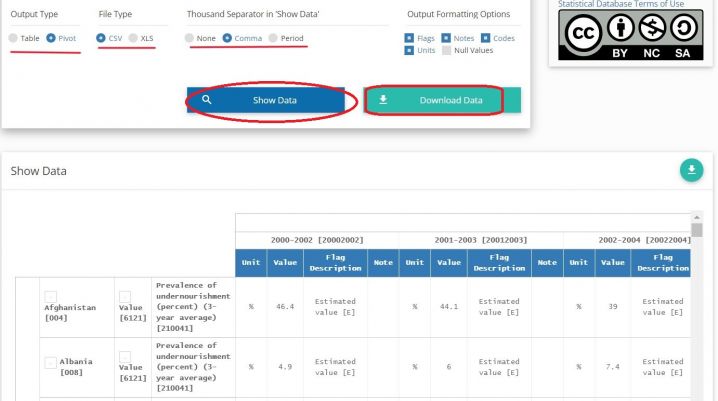
Step 8. Scroll down below the options. You also have options to select the “Output Type”, “File Type”, and “Thousand Separator in ‘Show Data’”. It’s recommended to select “Pivot” under “Output Type” to have easier data cleaning.
Step 9. You may select “Show Data” to look at the data before downloading. This option will populate data at the bottom of the page.
Step 10. Click “Download Data”. Either an Excel or CSV sheet will download. Now you can format the data to upload it into IFs. To import data into IFs, please follow the instructions found in the Importing Data (general instructions) page.
Note: Any data values that include a symbol (ie. <2.5 for Algeria 2018-2022) need to be changed to NULL.
