Joint Monitoring Programme, WHO/UNICEF
WHO/UNICEF Joint Monitoring Program: Water Supply and Sanitation
The water and sanitation series is developed using data from the WHO/UNICEF Joint Monitoring Program for water supply and sanitation (JMP). The JMP reports country, regional and global estimates of progress on drinking water, sanitation and hygiene (WASH) since 2000.
The WSS JMP dataset provides substantial information on water, sanitation and hygiene, broken into national, urban and rural subgroups. Within these subgroups, global estimates are provided that show the proportion of a country's population using improved and unimproved access to water, sanitation and hygiene. For the water dataset, IFs draws primarily on...... For the sanitation dataset, IFs uses the sanitation estimates to break the data down into the proportion of population (%) and the amount of people within a population. To construct these data series, IFs draws primarily on the population served with improved sanitation, unimproved sanitation, other unimproved sanitation, shared sanitation, and open defication sanitation.
The most recent update was in Sept. 2024. There are 8 preprocessors and 100 non-preprocessors.
Instructions on Downloading data
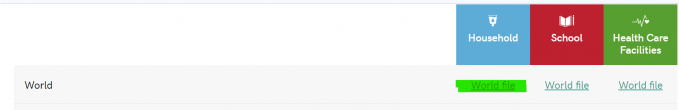
- Go to https://washdata.org/data/downloads#WLD
- Click "World file" under "Household" to download all the data.
- Open the downloaded file. "Enable Editing". Hover the mouse to the tab and right-click. The file will show several options:
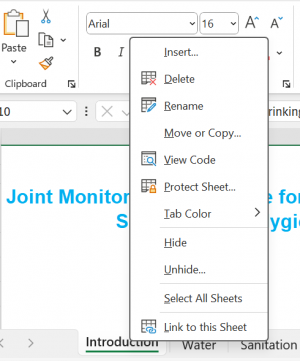
- Click "Unhide", and a view will pop up.
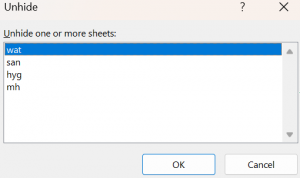
- Press "ctrl" and select "wat" and "san". Click "OK".
- In these 2 tabs, you may find the columns we will use in "Code in Source" listed below.


Instructions on Importing Water Data into IFs
This section explains the methodology to be followed when importing WSS JMP water supply data into IFs. It also describes certain problems that a user might face in interpreting and understanding the data.
Source: Water supply data is published by the WHO/UNICEF JMP. The data is available at the website https://washdata.org/data/downloads#WLD
Country List to be Used: WSS JMP
Ladder and Related code in downloaded data:
IFs include both old and new water systems from WSS JMP. The new system is developed based on the old system, thus, you can find some overlapping variable labels between two systems. Below we listed a mapping between the ladders used in IFs and those being used in WSS JMP.
New system-
| TAB | Ladder in IFs | WSS JMP Variable |
| wat | SafelyManaged | sm |
| wat | AtLeastBasic | basal |
| wat | Basic | basal - sm |
| wat | Limited | lim |
| wat | Unimproved | unimp |
| wat | Surface | ns |
In which, SafelyManaged is the intersaction of following 3 categories (most of time the result is just the minimal among three)
- SMOnPremise = imp_prem; used to be premises
- SMAsNeeded = imp_av; used to be available
- SMNotContam = imp_qual; used to be quality
You can also observe that unimp + imp + ns = 100%, where imp = basal + lim = pip + imp_npip
Old system-
| TAB | Ladder in IFs | WSS JMP Variable |
| wat | OtherImproved | imp_npip |
| wat | Piped | pip |
| wat | OtherUnimproved | unimp |
| wat | Surface | ns |
Types of Data: The following categories of data need to be imported into IFs:
- Can be directly found
- Units is "Percent" - 30 in total
- Units is "Thousands" - 12 in total
- Need Calculation
- Units is 'Percent" - 9 in total
- Units is "Thousands" - 6 in total
Notes:
- Any Pop series cannot be directly found in the excel. Thus, we need to manually calculated.
- pop_t is total population in thousands.
- prop_u is the percentage of urban population in total population.
- 100 - prop_u is the percentage of rural population in total population.
- Except pop_t, the rest of data we will use is in "Percent". To do the calculation for "Pop" series, we need to /100 first to convert the percent to decimal.
- wat_bas changed to wat_basal.
- wat_sur changed to wat_ns.
- Calculated Ladders:
- Basic = At least basic + Safely managed
- Improved = At least basic + Limited = Piped + Non-piped
- Unimproved = 100 - Improved - Surface
Under the raw data (the Excel file downloaded following the instruction above), the TAB column in the mapping below represents the name of the spreadsheet, while the other two columns represent the one-to-one mapping between IFs data table name and WSS JMP variable name. For example, table SeriesWSSJMPWaterSafelyManagedTotal from IFsHistSeries equals to the wsm
Instructions on Importing Sanitation Data into IFs
This section explains the methodology to be followed when importing WSS JMP sanitation data into IFs. It also describes certain problems that a user might face in interpreting and understanding the data.
Source: Sanitation data is published by the WHO/UNICEF JMP. The data is available at the website https://washdata.org/data/household#!/table?geo0=region&geo1=sdg.
Country List to be Used: WSS JMP
Ladder and Related code in downloaded data:
| TAB | Ladder | Ladder(Code) |
| san | AtLeastBasic | basal |
| san | Basic | basal - sm |
| san | Improved | basal + lim |
| san | Limited | lim |
| san | OpenDefecation | ns |
| san | OtherUnimproved | unimp |
| san | SafelyManaged | sm |
| san | Shared | lim |
| san | SMDisposedInsitu | sdo_sm |
| san | SMEmpTreated | fst_sm |
| san | SMWastewaterTreated | sew_sm |
| san | Unimproved | 100 - Improved - ns |
- Can be directly found
- Units is "Percent" - 27 in total
- Units is "Thousands" - 9 in total
- Calculation
- Units is "Percent" - 9 in total
- Units is "Thousands" - 6 in total
Notes:
- Any Pop series cannot be directly found in the excel. Thus, we need to manually calculated.
- pop_t is total population in thousands.
- prop_u is the percentage of urban population in total population.
- 100 - prop_u is the percentage of rural population in total population.
- Except pop_t, the rest of data we will use is in "Percent". To do the calculation for "Pop" series, we need to /100 first to convert the percent to decimal.
- san_bas changed to san_basal.
- san_od changed to san_ns.
- Calculated Ladders:
- Basic = At least basic + Safely managed
- Improved = At least basic + Limited = Sum of Latrines (san_othimp), Septic Tanks (san_sep), Sewer Connections (san_sew)
- Unimproved = 100 - Improved - Open Defecation