Uncategorized files
Jump to navigation
Jump to search
Showing below up to 50 results in range #1,551 to #1,600.
-
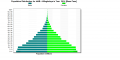
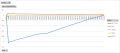
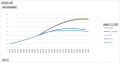
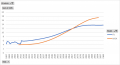
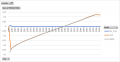
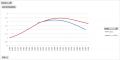 ManipurPopIIASA.png 1,211 × 602; 35 KB
-
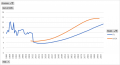
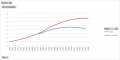
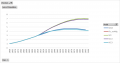
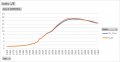
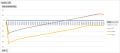
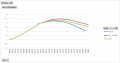 ManipurPopIIASAMgSCE.png 1,140 × 601; 36 KB
-
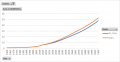
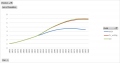
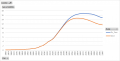
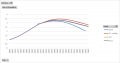 ManipurPopIIASAMgSCE2.png 1,140 × 602; 37 KB
-
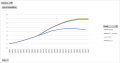
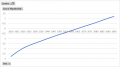
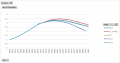 ManipurPopIIASAMgSCE3.png 1,140 × 602; 39 KB
-
 ManipurPopIIASAMgSCE3 5.png 1,141 × 602; 38 KB
-
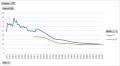
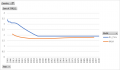
 ManipurTFRIIASA.png 968 × 567; 29 KB
-
 ManufacturingScatter.png 902 × 564; 33 KB
-
 ManufacturingWaterDemandPerUnit.jpg 1,000 × 454; 123 KB
-
 Manufacturing v728.jpg 1,000 × 479; 398 KB
-
 Map.gif 702 × 376; 29 KB
-
 Map1.gif 455 × 291; 16 KB
-
 Map3.gif 624 × 394; 52 KB
-
 Mapp.gif 532 × 395; 71 KB
-
 Mapp1.gif 532 × 395; 91 KB
-
 Mapp2.gif 892 × 617; 47 KB
-
 Mapping Table.png 639 × 1,232; 54 KB
-
 Mapuse.gif 638 × 511; 96 KB
-
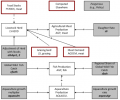 Meat and fish production.png 451 × 376; 20 KB
-
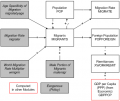
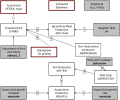 Meat and fish production FlowchartKN.png 493 × 412; 30 KB
-
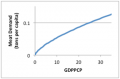 Meat demand.png 288 × 190; 11 KB
-
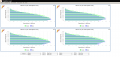
 Meghalaya2014ASC.png 1,245 × 626; 40 KB
-
 MeghalayaCBRIIASA.png 974 × 537; 35 KB
-
 MeghalayaCDRIIASA.png 1,042 × 568; 40 KB
-
 MeghalayaGDPPCSCE3.png 929 × 481; 30 KB
-
 MeghalayaGDPSCE2.png 1,161 × 595; 38 KB
-
 MeghalayaMigIIASA.png 941 × 529; 20 KB
-
 MeghalayaMigIIASASCE.png 1,029 × 543; 37 KB
-
 MeghalayaMigIIASASCE2.png 1,249 × 568; 43 KB
-
 MeghalayaMigIIASASCE3.png 1,298 × 568; 38 KB
-
 MeghalayaPopIIASA.png 1,212 × 602; 33 KB
-
 MeghalayaPopIIASAMgSCE.png 1,140 × 601; 35 KB
-
 MeghalayaPopIIASAMgSCE2.png 1,140 × 602; 36 KB
-
 MeghalayaPopIIASAMgSCE3.png 1,141 × 602; 38 KB
-
 MeghalayaPopIIASAMgSCE3 5.png 1,141 × 602; 37 KB
-
 MeghalayaTFRIIASA.png 968 × 567; 28 KB
-
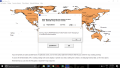
 Mexico Compare Country View from Population Graph.png 1,900 × 904; 87 KB
-
 Mexico Comparison 2030.png 1,903 × 897; 87 KB
-
 Mexico Population Distribution.gif 1,918 × 951; 81 KB
-
 Mexico Population Graph 2030.png 1,915 × 886; 59 KB
-
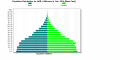
 Mexico Population Pyramid.png 1,915 × 883; 57 KB
-
 MigrantStocks.png 1,920 × 1,080; 341 KB
-
 Migration.png 412 × 348; 18 KB
-
 Mizoram2014ASC.png 1,245 × 626; 44 KB
-
 MizoramCBRIIASA.png 975 × 537; 30 KB
-
 MizoramCDRIIASA.png 1,041 × 568; 38 KB
-
 MizoramGDPPCSCE3.png 929 × 481; 31 KB
-
 MizoramGDPSCE2.png 1,162 × 595; 39 KB
-
 MizoramMigIIASA.png 941 × 529; 23 KB
-
 MizoramMigIIASASCE.png 1,044 × 543; 40 KB
-
 MizoramMigIIASASCE2.png 1,275 × 568; 49 KB


