Unused files
Jump to navigation
Jump to search
The following files exist but are not embedded in any page. Please note that other websites may link to a file with a direct URL, and so may still be listed here despite being in active use.
Showing below up to 35 results in range #501 to #535.
-
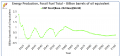
 Mortality and Disability Years Graph.png 2,533 × 1,237; 89 KB
-
 Morbidity by Age, Sex, and Cause.png 2,559 × 1,214; 121 KB
-
 Example of Population by Age and Sex Screen.jpg 1,915 × 937; 226 KB
-
 Mexico Population Distribution.gif 1,918 × 951; 81 KB
-
 Example of Compare Countries Option Under Distribution Type.gif 1,918 × 945; 133 KB
-
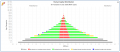
 Mexico Population Pyramid.png 1,915 × 883; 57 KB
-
 Mexico Compare Country View from Population Graph.png 1,900 × 904; 87 KB
-
 Projected educational attainment by cohort and sex of Tanzania.png 2,681 × 1,315; 967 KB
-
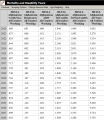 Mortality and Disability Years Table.png 965 × 1,114; 190 KB
-
 Test2.png 1,847 × 855; 117 KB
-
 Wiki Edu page- Tanzania 2030.png 1,255 × 547; 54 KB
-
 All variable Map for World Map, Lorenz, and Gini specialized display.png 1,756 × 936; 434 KB
-
 Logo.png 160 × 160; 4 KB
-
 SDG Overview.png 1,918 × 916; 193 KB
-
 IMF GFS Table Navigation.png 2,211 × 911; 184 KB
-
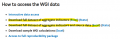 WGI Where to Download.png 723 × 232; 37 KB
-
 Advanced Sustainability Analysis Display.png 1,681 × 925; 160 KB
-
 Geographically-fixed Display Example.png 1,600 × 919; 175 KB
-
 ClimateWatch Emissions Data.png 2,372 × 1,092; 223 KB
-
 CCKP World Bank Data.png 1,820 × 1,322; 256 KB
-
 Example of SelectVars Formula Name page.png 730 × 406; 17 KB
-
 Example of the Computations for variable seleciton.png 1,153 × 709; 37 KB
-
 Example of the File Management options.png 1,920 × 1,200; 592 KB
-
 Flex Displays.png 1,922 × 921; 208 KB
-
 Example of Display Map.png 1,785 × 889; 411 KB
-
 Example of Analyze Across Countries.png 1,482 × 886; 138 KB
-
 Example of the Select Countries from Analyze Across Time.png 1,641 × 892; 94 KB
-
 Step 1- Upload Excel-CSV File.png 1,396 × 281; 23 KB
-
 Screenshot 2025-11-18 at 9.06.20 AM.png 2,880 × 1,800; 387 KB
-
 Flex display.png 2,768 × 1,511; 296 KB
-
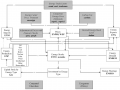 IFs Energy Model Overview. .png 864 × 648; 137 KB
-
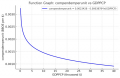 Figure 6- Relationship between compendemperunit and GDP per capita .png 690 × 450; 134 KB
-
 Picture 1.png ifs.png 418 × 204; 37 KB
-
 Screenshot 2026-03-31 at 1.27.07 PM.png 2,880 × 1,800; 655 KB
-
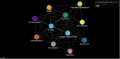
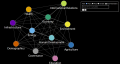 Network diagram frontpage1.png 975 × 516; 162 KB


