Uncategorized files
Jump to navigation
Jump to search
Showing below up to 50 results in range #651 to #700.
-
 Equation44 3SAM 3.4.jpg 751 × 244; 30 KB
-
 Equation45 3SAM 3.5.1.1.jpg 805 × 672; 90 KB
-
 Equation46 3SAM 3.5.1.1.jpg 847 × 163; 25 KB
-
 Equation47 3SAM 3.5.1.1.jpg 444 × 37; 7 KB
-
 Equation48 3SAM 3.5.1.1.jpg 432 × 37; 7 KB
-
 Equation49 3SAM 3.5.1.1.jpg 604 × 39; 10 KB
-
 Equation5.jpg 376 × 52; 6 KB
-
 Equation6.jpg 330 × 84; 5 KB
-
 Equation7.jpg 508 × 286; 24 KB
-
 Equation8.jpg 567 × 115; 16 KB
-
 Equation9.jpg 846 × 192; 31 KB
-
 Evalprior.gif 630 × 417; 38 KB
-
 Example Compare Countries Mortality Display.png 1,765 × 883; 126 KB
-
 Example of Analyze Across .png 950 × 568; 251 KB
-
 Example of Analyze Across Countries.png 1,482 × 886; 138 KB
-
 Example of Analyze Across Time.png 1,621 × 930; 184 KB
-
 Example of Basic Report.png 1,789 × 942; 188 KB
-
 Example of Batch Run page.png 1,849 × 928; 106 KB
-
 Example of Bivariate Function page.png 1,581 × 943; 131 KB
-
 Example of Change Multivariate Function Sreen.png 1,303 × 649; 44 KB
-
 Example of Compare Countries Option Under Distribution Type.gif 1,918 × 945; 133 KB
-
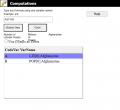
 Example of Computations Formula name prompt.png 822 × 502; 17 KB
-
 Example of Country Profile.png 1,914 × 930; 209 KB
-
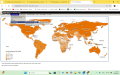
 Example of Display Map.png 1,785 × 889; 411 KB
-
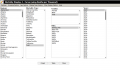
 Example of Edit List page to create to variable.png 1,896 × 946; 134 KB
-
 Example of File Management.png 1,766 × 912; 434 KB
-
 Example of Multivariate Functions page.png 1,732 × 925; 243 KB
-
 Example of Parameter Adjustment on Scenario Tree.png 1,893 × 934; 147 KB
-
 Example of Parameter Search Option.png 1,837 × 895; 59 KB
-
 Example of Plot for Across Countries.png 1,875 × 892; 105 KB
-
 Example of Plot option Analyze Across Time.png 1,876 × 901; 73 KB
-
 Example of Population by Age and Sex Screen.jpg 1,915 × 937; 226 KB
-
 Example of Running the Model.png 1,858 × 913; 112 KB
-
 Example of Scenario Tree usage.png 1,918 × 937; 124 KB
-
 Example of Search Variable from Analyze Across Countries.png 1,519 × 754; 52 KB
-
 Example of SelectVars Formula Name page.png 730 × 406; 17 KB
-
 Example of Select Countries Analyze Across Time.png 1,626 × 913; 88 KB
-
 Example of Show Computed Functions.png 1,751 × 879; 66 KB
-
 Example of Statistics Page from Analyze Across Country.png 1,786 × 909; 28 KB
-
 Example of Successful Scenario Run.png 1,873 × 918; 133 KB
-
 Example of TCI Calculation.png 1,101 × 701; 237 KB
-
 Example of the Bilateral Specialized Display.png 1,918 × 928; 160 KB
-
 Example of the Computations 1.png 721 × 394; 20 KB
-
 Example of the Computations for variable seleciton.png 1,153 × 709; 37 KB
-
 Example of the Computations for variable seleciton1.png 771 × 709; 35 KB
-
 Example of the File Management options.png 1,920 × 1,200; 592 KB
-
 Example of the Fully Customize Parameter option.png 1,918 × 918; 58 KB
-
 Example of the Mortality Display J-curve.png 1,563 × 940; 148 KB
-
 Example of the Quick Scenario Guide.png 1,908 × 939; 78 KB
-
 Example of the Run option.png 1,650 × 586; 18 KB


