Uncategorized files
Jump to navigation
Jump to search
Showing below up to 50 results in range #751 to #800.
-
 FISHSTATJ IMG STEP 06.jpg 1,915 × 1,009; 148 KB
-
 FISHSTATJ IMG STEP 07(2).jpg 1,911 × 1,005; 127 KB
-
 FISHSTATJ IMG STEP 07(3).jpg 1,917 × 1,005; 130 KB
-
 FISHSTATJ IMG STEP 07.jpg 1,920 × 1,003; 95 KB
-
 FISHSTATJ IMG STEP 08.jpg 1,906 × 1,003; 143 KB
-
 FISHSTATJ IMG STEP 09(2).jpg 1,920 × 999; 384 KB
-
 FISHSTATJ IMG STEP 09.jpg 1,917 × 1,006; 379 KB
-
 FISHSTATJ IMG STEP 10(2).jpg 1,915 × 1,005; 428 KB
-
 FISHSTATJ IMG STEP 10.jpg 1,920 × 946; 403 KB
-
 FISHSTATJ IMG STEP 11.jpg 1,915 × 1,005; 431 KB
-
 FIW Step1.png 2,880 × 1,566; 868 KB
-
FIW Step2.png 6,000 × 3,263; 579 KB
-
FIW Step3.png 6,001 × 3,263; 579 KB
-
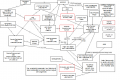 FLOCHART2.png 648 × 432; 41 KB
-
 Fao sdg 1.png 1,048 × 908; 110 KB
-
 Farris et al., 2022.png 417 × 450; 50 KB
-
 Feat1.gif 638 × 320; 49 KB
-
 Feat2.gif 430 × 570; 33 KB
-
 Feat3.gif 459 × 420; 45 KB
-
 Feat4.gif 699 × 477; 38 KB
-
 Feat5.gif 478 × 478; 28 KB
-
 Feat6.gif 607 × 474; 29 KB
-
 Feed demand for crops.png 278 × 183; 12 KB
-
 Feed demand for crops 2.png 288 × 190; 10 KB
-
 FeeddemandKN.png 577 × 241; 25 KB
-
 Fertility.png 577 × 291; 22 KB
-
 Fertility1.PNG 689 × 52; 5 KB
-
 Fertility2.PNG 259 × 25; 2 KB
-
 Figure 3.1.jpg 1,224 × 864; 99 KB
-
-
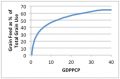
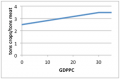
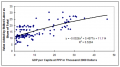
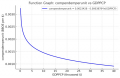 Figure 6- Relationship between compendemperunit and GDP per capita .png 690 × 450; 134 KB
-
-
-
-
-
 File1.gif 621 × 459; 36 KB
-
 Files in Zipped Folder.png 1,303 × 421; 56 KB
-
 Financial constraint on food dd.png 412 × 298; 11 KB
-
 Financial constraint on food demand KN.png 410 × 296; 13 KB
-
 Firmaccounts.png 577 × 361; 26 KB
-
 FishDimension.png 575 × 252; 36 KB
-
 Fish demand.png 269 × 178; 11 KB
-
 Flex Displays.png 1,922 × 921; 208 KB
-
 Flex display.png 2,768 × 1,511; 296 KB
-
 Flexibledisplay.gif 798 × 600; 46 KB
-
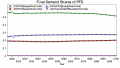
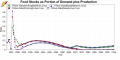 Food Stocks as Portion of Demand plus Production .png 975 × 484; 159 KB
-
 Food dd for crops.png 453 × 367; 18 KB
-
 Food dd for meat and fish.png 428 × 488; 25 KB
-
 Food demand flowchart KN.png 453 × 366; 16 KB
-
 ForwardLinkagesOverview.jpg 762 × 503; 48 KB

.jpg)
.jpg)


.jpg)

.jpg)


