FishStatJ Software for Fishery and Aquaculture Statistical Time Series
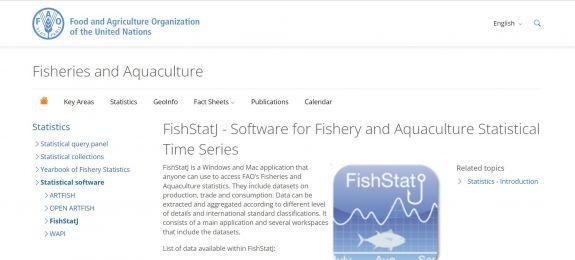
Step 1. To pull data from FAO's Fisheries and Aquaculture Statistical Time Series software, FishStatJ, navigate to https://www.fao.org/fishery/en/topic/166235
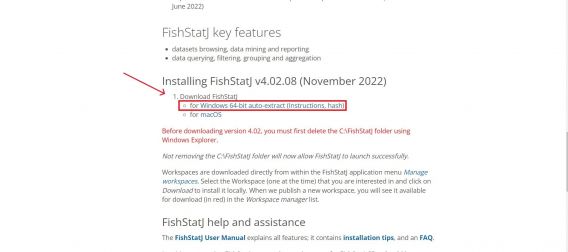
Step 2. Scroll down the page until you reach <Installing FishStatJ v.4.02.08 (November 2022)>. Under <Download FishStatJ>, click on the desired operating system to download the software. This example will use the Windows version.
NOTE: Make sure your Windows version is compatible with FishStatJ before downloading. FishStatJ is compatible with Windows 10; 64-bit version; it cannot work with Windows 32-bit.
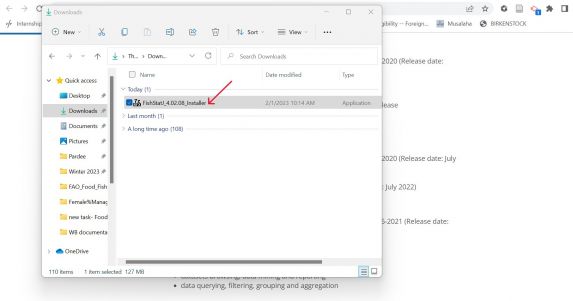
Step 3. After installing, go to your downloads and right click on <FishStatJ_4.02.08_Installer> and click <Open>.
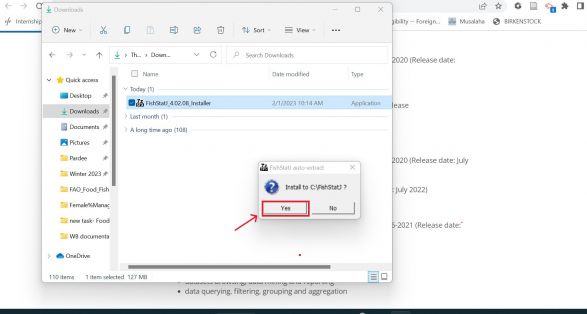
Step 4. The following permission window will pop up. Click <Yes> to finish installing and launch.
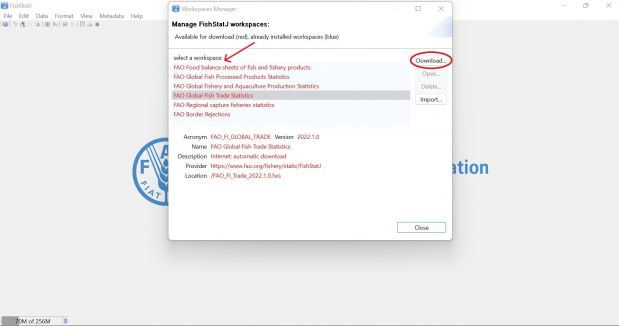
Step 5. FishStatJ will immediately launch at this point. The <Workspaces Manager> page should also open automatically after launching.
Step 6. Select the desired workspace, then click <Download> on the right side. This example will pull data from <FAO Global Fish Trade Statistics>.
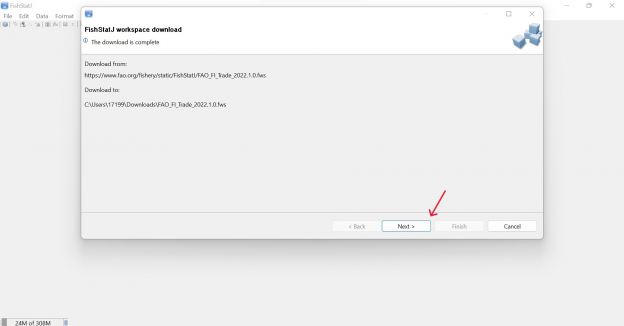
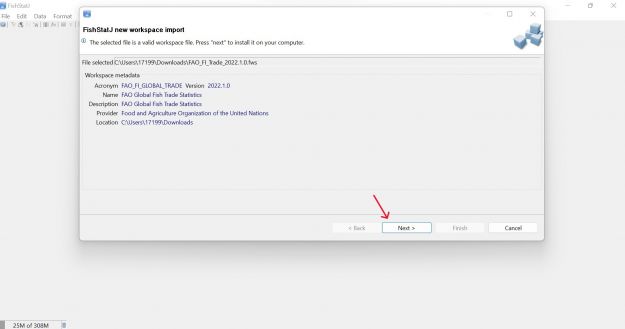
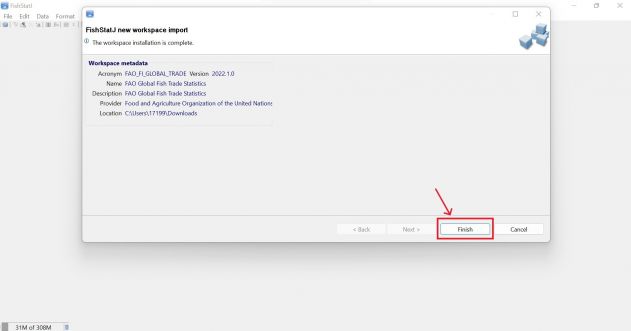
Step 7. The following page will populate. Click <Next> two times, then click <Finish>.
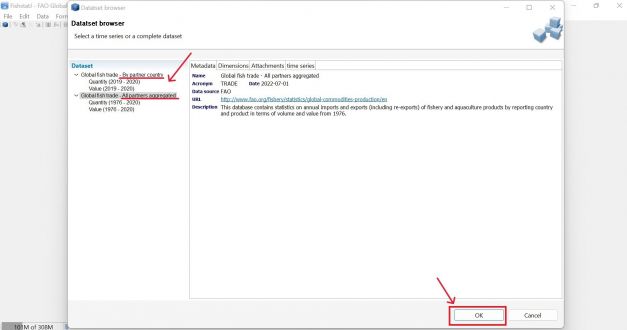
Step 8. The <Dataset Browser> page will then pop up. You can select to have the dataset by partner country or all partners aggregated. This example will select <All partners aggregated>. Click <OK> on bottom right of page to open up the dataset.
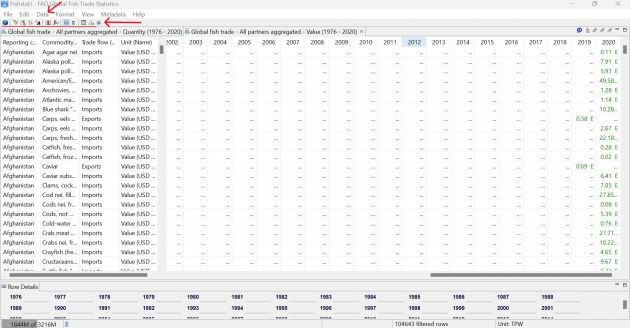
Step 9. The following page will populate. There are a variety of functions in FishStatJ that can be used to organize data. Hovering over the various icons above the dataset will give options like <Each dimension can be detailed, group or aggregated>, <Change sort order>, etc. Data can also be organized by hovering over <Data> and then selecting from options like <Filter<, <Aggregate>, <Columns>, <Sort>, <Custom Groups>, etc.
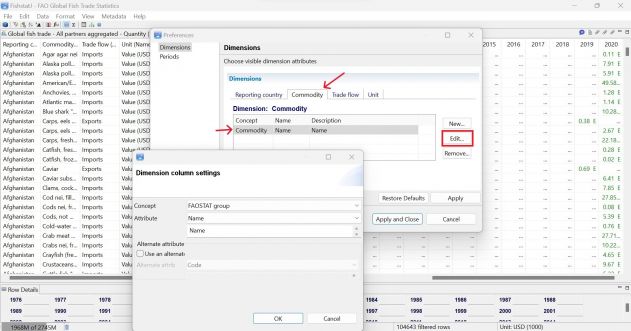
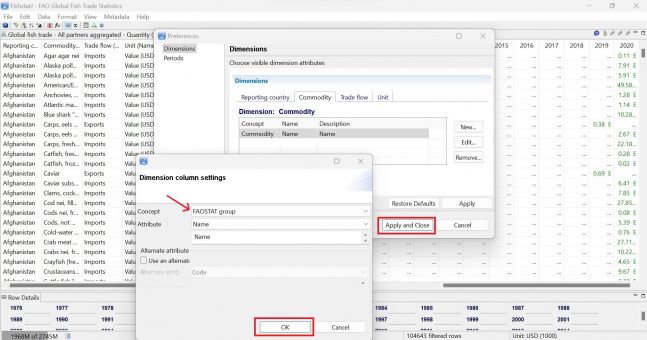
Step 10. To change column dimensions, hover over <Data> then select <Columns>. Select the dimension desired (<Commodity> in this example) and then select the text under <Concept>. Click on <Edit>.
Step 11. The following window will pop up after clicking <Edit>. To the right of <Concept>, select the desired group from the dropdown menu. This example uses <FAOSTAT group>. Then, click <OK>. Finally, click <Apply and Close>. The dimension in the data should change immediately.
A note on aggregation: Most fish data in IFs is disaggregated into different types of fish based on the FAOSTAT group. However, it is not necessary to use that aggregation group when it concerns fish trade data from FishStatJ.
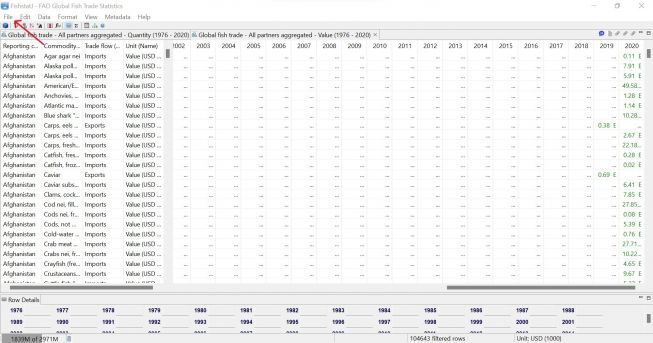
Step 12. To export the data, click on <File> in the top left corner, then select <Export Selection (CSV file)...> OR use command Ctrl + S. Name the CSV file then save it into an appropriate place.
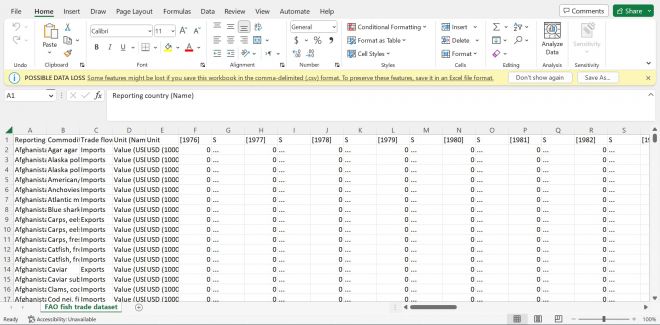
NOTE: Null values in FishStatJ will download automatically as 0 in Excel. Make sure to take note of actual zeroes before downloading.
Step 13. Opening up the CSV file in Excel will formulate the following page. Make sure to save the file as an *.xls or *.xlsx to prevent any possible data loss.
