UNODC
UNODC is a global leader in the fight against illicit drugs and international crime. Established in 1997 through a merger between the United Nations Drug Control Programme and the Centre for International Crime Prevention, UNODC operates in all regions of the world through an extensive network of field offices. UNODC relies on voluntary contributions, mainly from Governments, for 90 per cent of its budget.
UNODC is mandated to assist Member States in their struggle against illicit drugs, crime and terrorism. In the Millennium Declaration, Member States also resolved to intensify efforts to fight transnational crime in all its dimensions, to redouble the efforts to implement the commitment to counter the world drug problem and to take concerted action against international terrorism.
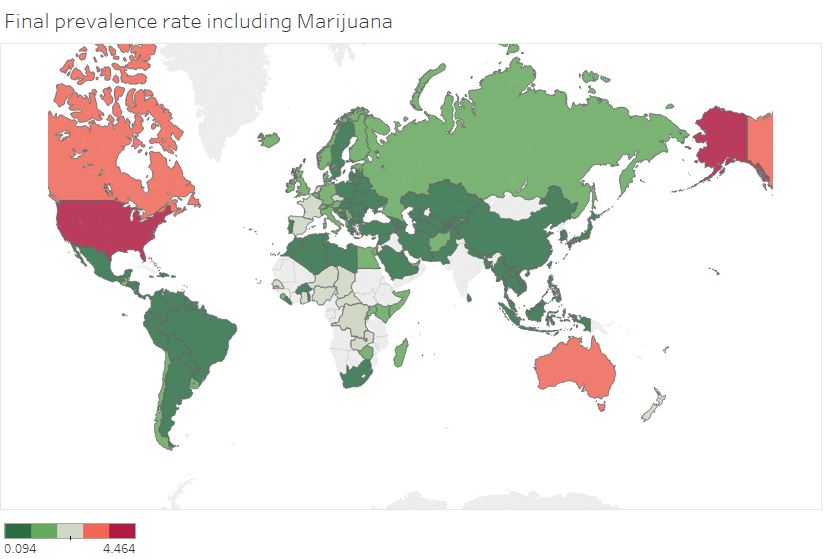
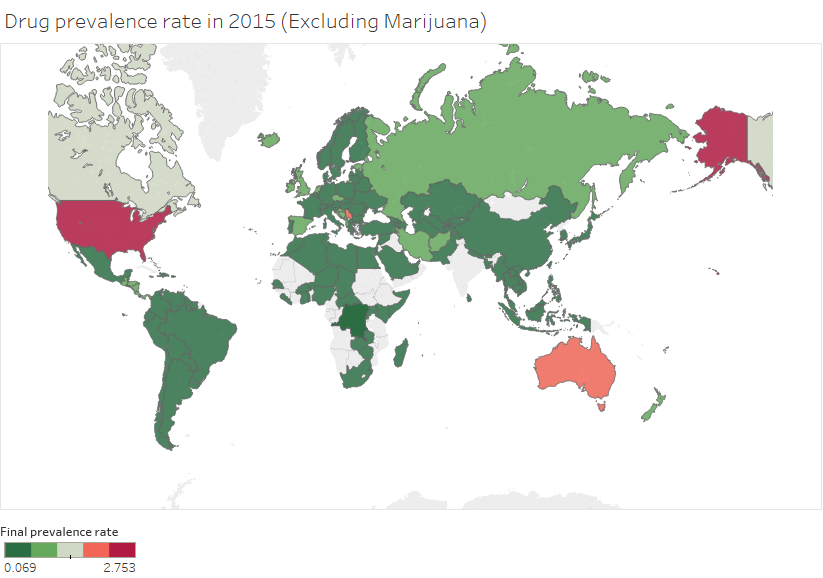
This page describes the steps followed to compute the overall drug prevalence rates including and excluding cannabis. The first section of the document explains how the UNODC computes drug prevalence rates by country and how these are aggregated. The next sections explain how we compile data from the UNODC, the methodology used to fill holes and the methodology used to derive an aggregate measure of drug prevalence.[1]
Methodology followed by the UNODC
Drug prevalence is one of the major indicators compiled and used by the UNODC. Data for the same is collected by the UNODC through the use of ARQs (Annual report questionnaires).In cases where prevalence rates are not available for a particular country. The UNODC mentions that the quantity of information provided on illicit drug supply is much better than information provided on drug demand. Where other data is available from different sources, data from the ARQs is supplemented with data from other sources.
A global estimate of the level of use of a specific drug involves the following steps,
- Identification and analysis of appropriate sources
- Identification of key benchmark figures when it comes to measuring drug prevalence (annual prevalence amongst the population 15-64 has been chosen as the key metric)
- Standardization of the existing data if reported with a different reference population
- Imputation of data for countries where no data is available based on the countries in the same sub-region.
- Extrapolation of available results for a sub region are calculated for sub-regions where prevalence rate estimates for at least two countries covering at least 20% of the population are available. If a sub-regional estimate was not extrapolated, a regional calculation was extrapolated based on the 10th and 90th percentile of the distribution of the data available from countries in the region.
- Aggregation of regional estimates rolled-up into regional results to arrive at global estimates.
- When deriving overall prevalence of drug use in any country, total prevalence was calculated and this was divided by 1.12 to account for usage of different drugs by the same individual.
How we computed our drug prevalence rate
For the purpose of computing total prevalence rates we used drug prevalence datasets from the UNODC. These datasets can be found here- https://data.unodc.org/. We computed two main measures, total drug prevalence rate including cannabis and total drug prevalence rate excluding cannabis. Prevalence rates were computed for each drug type namely,
- Amphetamines
- Cannabis
- Cocaine
- Ecstasy
- Opiates
- Opioids
- Prescription Opioids
- Tranquilizers and sedatives
To make all of these drug datasets comparable, holes were filled for country years using
- Interpolation and extrapolation, where holes had to be filled for countries with data for some years
- Sub-regional averages at the sub-region year value were used to fill holes where no data was available for country years
- Regional averages were used to fill holes where sub-regional averages were not available.
One important point to note is that no hole filling was done where the UNODC did not report prevalence rates for a particular country for any drug. For example, the UNODC did not report data for any drug for Angola, therefore no data was filled in for the country using the steps described above.
Finally, when deriving the total prevalence rate, the average prevalence rate was divided by 1.12 to account for usage of multiple drugs by the same user. As mentioned earlier, this is in line with the methodology used by the UNODC.

