Aquastat FAO's Global Information System on Water and Agriculture
SUMMARY
AQUASTAT is the UN's Food and Agriculture Organization (FAO) global information system on water resources and agricultural water management. It collects, analyzes, and provides free access to over 180 variables and indicators by country and year from 1960. AQUASTAT plays an important role in monitoring of the UN's Sustainable Development Goal 6 that sets out to "ensure availability and sustainable management of water and sanitation for all". Additionally, AQUASTAT's new dissemination system allows users to download up to 100,000 data points and the data is made available yearly.
The data team uses AQUASTAT for a number of series including SeriesDesalinatedWater, SeriesLandCultivatedArea, and SeriesLandIrWaterLogged to name a few. To pull data into IFs, please follow the instructions found in the Data Pull instructions page.
GENERAL STEPS TO PULL DATA FROM AQUASTAT
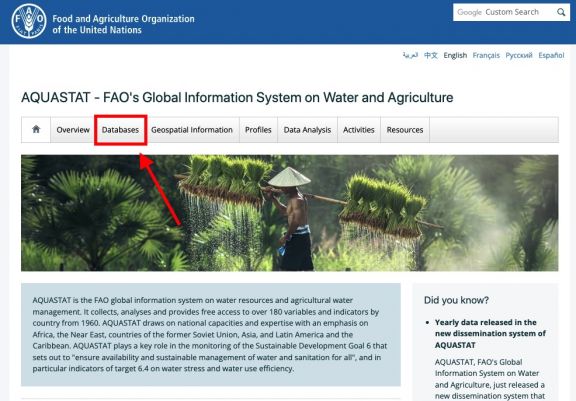
Step 1.) Navigate to the home page of AQUASTAT FAO's Global Information System on Water and Agriculture,
Step 2.) Near the top of the page, click on the tab labeled "Database"
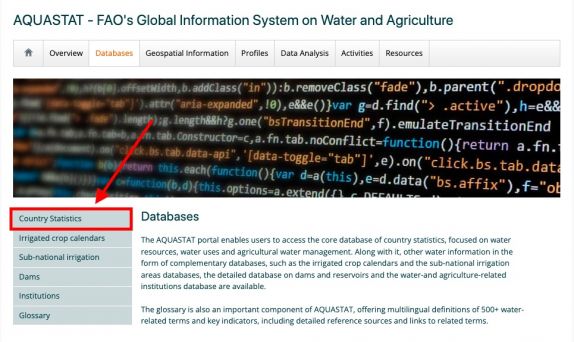
Step 3.) On the left hand side of the page, click on the tab labeled "Country Statistics"
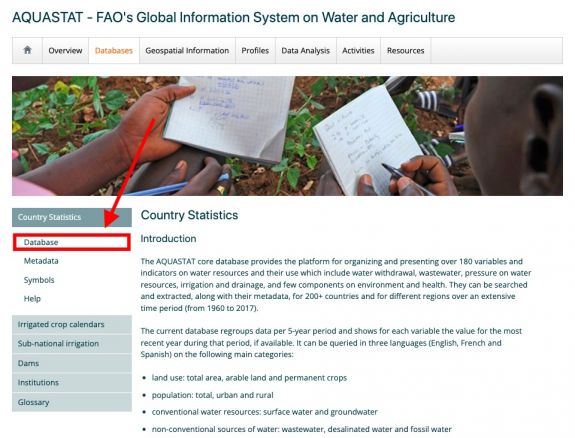
Step 4.) On the left hand side of the page, click on the tab labeled "Database", under "Country Statistics"
THIS WILL OPEN A PAGE ON ANOTHER TAB
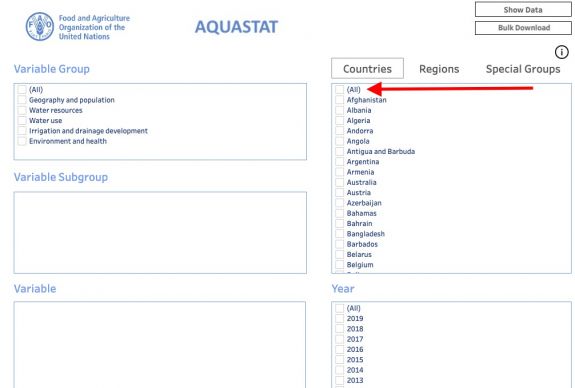
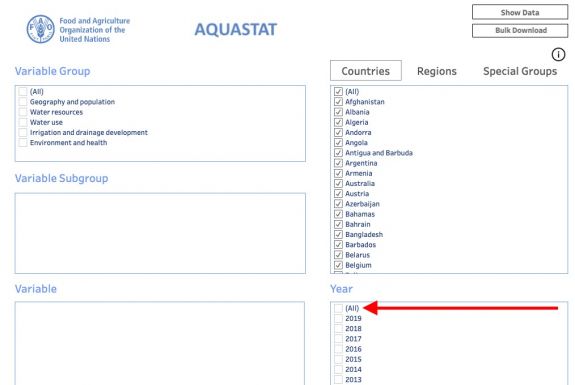
Step 5.) Under the "Countries" section on the right side, select (ALL) to select all countries
Step 6.) Under the "Year" section on the right side, select (ALL) to select all years from 1960 to the most recent
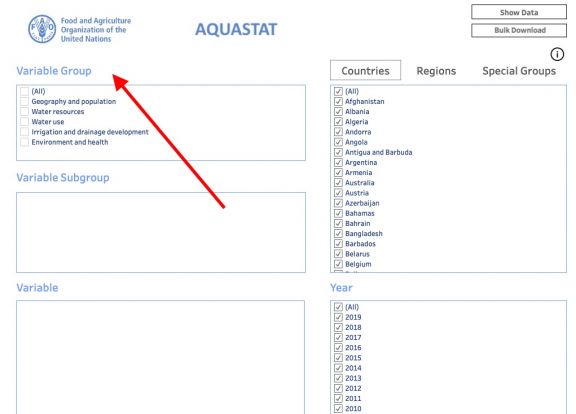
Step 7.) To find your specific variable, click which "Variable Group" it is in, then the "Variable Subgroup", and finally your "Variable"
SPECIFIC VARIABLE EXAMPLE: SeriesIrrigatedCropIntensity
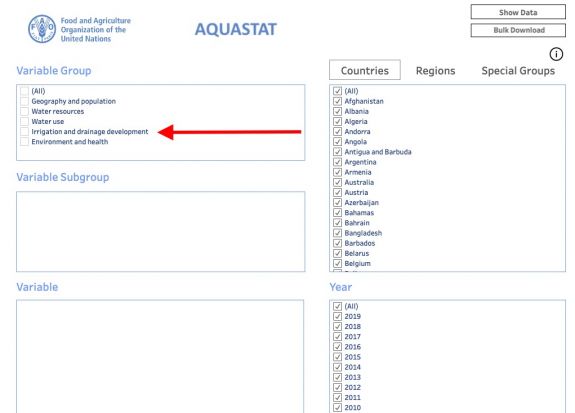
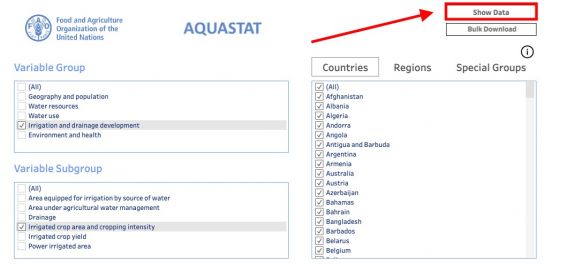
Step 8.) On the left hand side, under "Variable Group", select "Irrigation and drainage development"
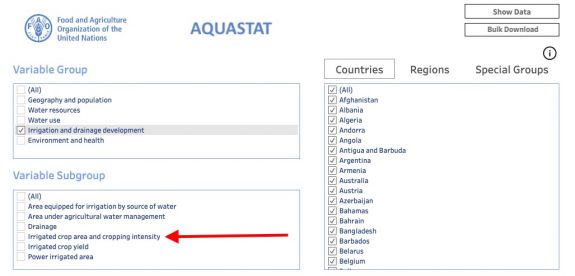
Step 9.) The "Variable Subgroup" section under "Variable Group" should now be populated with different subgroups. Select the subgroup "Irrigated crop area and cropping intensity"
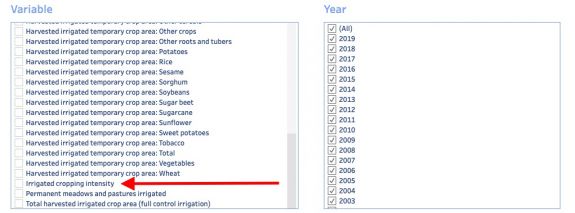
Step 10.) The "Variable" section under "Variable Subgroup" should now be populated with different variables. Select the variable "Irrigated cropping intensity"
Step 11.) On the top left side of the page, click "Show Data"
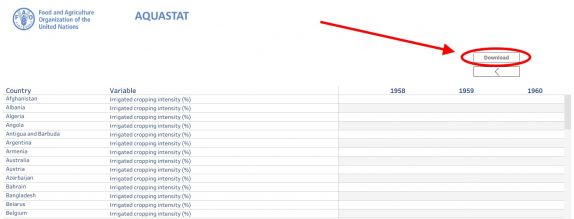
Step 12.) A NEW PAGE WILL POPULATE ON A NEW TAB... on the top right side click on "Download"
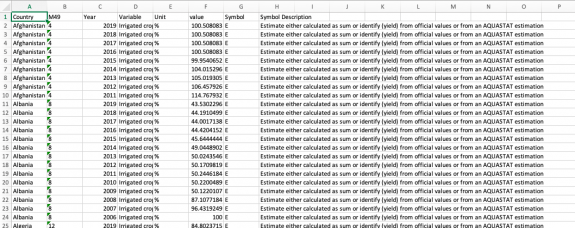
13. An Excel sheet will download. Now you can format the data to upload it into IFs. To import data into IFs, please follow the instructions found in the Importing Data (general instructions) page
