File:ED Section 6, equation 1 6.4.2.png

Original file (944 × 852 pixels, file size: 112 KB, MIME type: image/png)
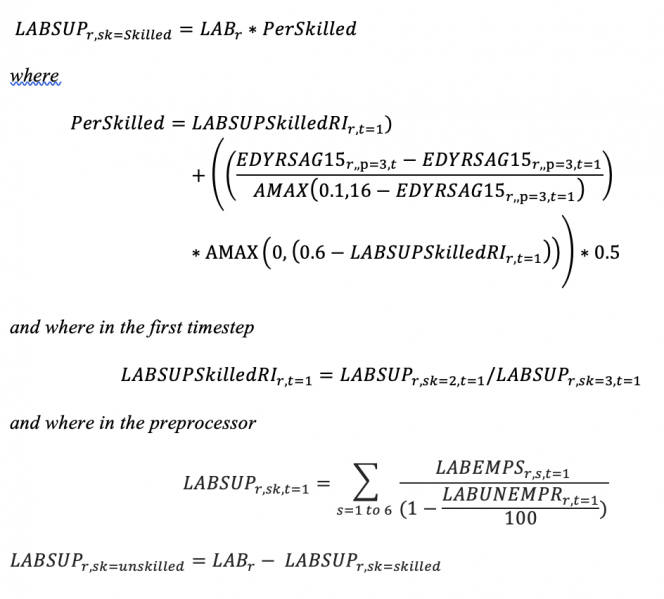
Therefore, an analysis of labor demand by skill level was done in the Base Case of the model across countries and income levels, and that analysis was used algorithmically (basically by trial and error) to create a function for the education inflation needed to be in the percentage skilled, so that the actual PerSkilled supply generally matches the pattern of skilled demand in the work force. As years of education rise to the value in the model’s base year, each point of increase can raise the portion of labor that is skilled by a maximum of 0.5 points. But it is reasonable also that the increase in skilled labor also diminishes as its percentage of the total labor force increases; the presumption based on examining data on the saturation of skilled share across countries is that as that share approaches 60 percent, the contribution of additional education steadily declines to zero.
File history
Click on a date/time to view the file as it appeared at that time.
| Date/Time | Thumbnail | Dimensions | User | Comment | |
|---|---|---|---|---|---|
| current | ★ Approved revision 19:07, 10 May 2023 | | 944 × 852 (112 KB) | Julia.Detar (talk | contribs) |
You cannot overwrite this file.
File usage
There are no pages that use this file.