File:ED Section 6, equation 1 6.4.4.png
Original file (1,076 × 614 pixels, file size: 102 KB, MIME type: image/png)
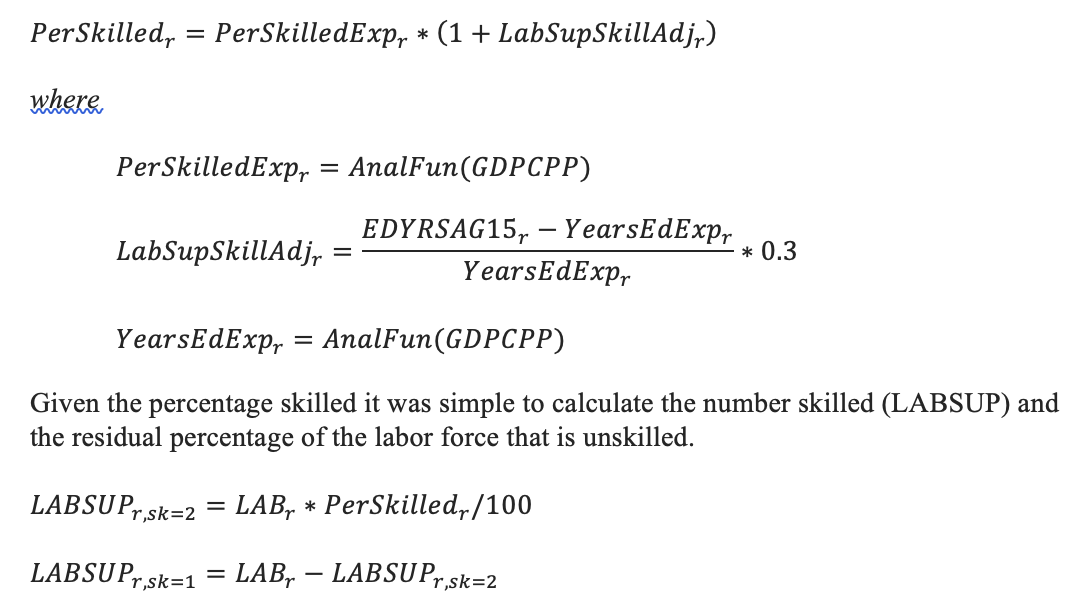
The replacement forecasting process began by using a function estimated from the relationship between GDPPCP and GTAP data on the share of value added accruing to skilled workers to estimate the share of the labor force that is skilled (PerSkilled); that was known to be wrong, but remember that we do not need the exact share, what we need is the change over time. And the model used that same function over time to estimate the expected share of skilled labor, all else equal, over time. But all is not equal and it is unequal to the extent that education levels rise higher than those that we would expect in the same development process. Hence there was an adjustment term in the calculation (LabSupSkillAdj) that looked at the difference between the actual years of education in the population and the expected years (YearsEdExp), again computed by an analytical function with GDP per capita at PPP. A fraction of the proportional difference of actual with expected was added to the percentage skilled.
File history
Click on a date/time to view the file as it appeared at that time.
| Date/Time | Thumbnail | Dimensions | User | Comment | |
|---|---|---|---|---|---|
| current | ★ Approved revision 19:16, 10 May 2023 | | 1,076 × 614 (102 KB) | Julia.Detar (talk | contribs) |
You cannot overwrite this file.
File usage
There are no pages that use this file.