File:Figure 6.2 Percentage of population skilled as function of GDP per capita. Source- Barry Hughes..png
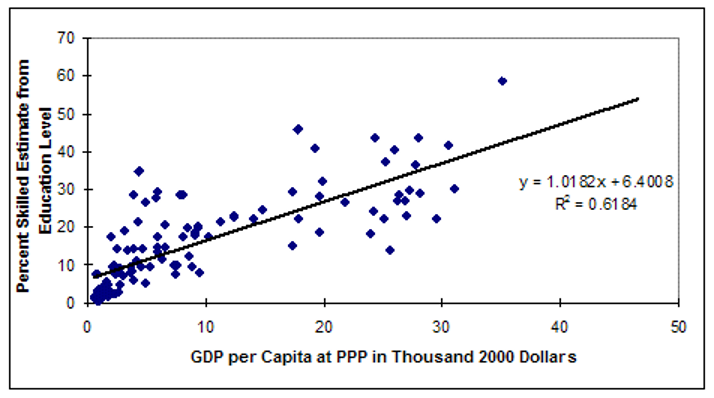
Figure_6.2_Percentage_of_population_skilled_as_function_of_GDP_per_capita._Source-_Barry_Hughes..png (714 × 398 pixels, file size: 82 KB, MIME type: image/png)
All approaches to specifying labor skill in IFs have involved looking at the formal educational attainment levels of the adult population. The cross-sectional representation in Figure 6.2 shows the portion of the population 25 years and older with tertiary education plus ½ of that with secondary education. That is a very arbitrary and crude definition of skilled labor, but is one possible starting point―and analysis of change in the share of labor that is skilled is more important in the subsequent calculation of Gini than is the exact initial definition of the share. The value of tying the size of skilled and unskilled labor forces to education completion is that the education module of IFs forecasts sizes of population with various educational attainment levels and those can be driven by agent-class interventions. And it is the change in share of skilled labor that is most important, not the absolute numbers—the Gini coefficient data can be used to adjust the initial conditions of income distribution and the change in labor force sizes can help us forecast the change in Gini.
File history
Click on a date/time to view the file as it appeared at that time.
| Date/Time | Thumbnail | Dimensions | User | Comment | |
|---|---|---|---|---|---|
| current | ★ Approved revision 19:09, 10 May 2023 | | 714 × 398 (82 KB) | Julia.Detar (talk | contribs) |
You cannot overwrite this file.
File usage
The following page uses this file: