File:Figure 6.4 Value added by skilled labor as function of GDP per capita Source- Barry Hughes..png
Jump to navigation
Jump to search

No higher resolution available.
Figure_6.4_Value_added_by_skilled_labor_as_function_of_GDP_per_capita_Source-_Barry_Hughes..png (714 × 398 pixels, file size: 86 KB, MIME type: image/png)
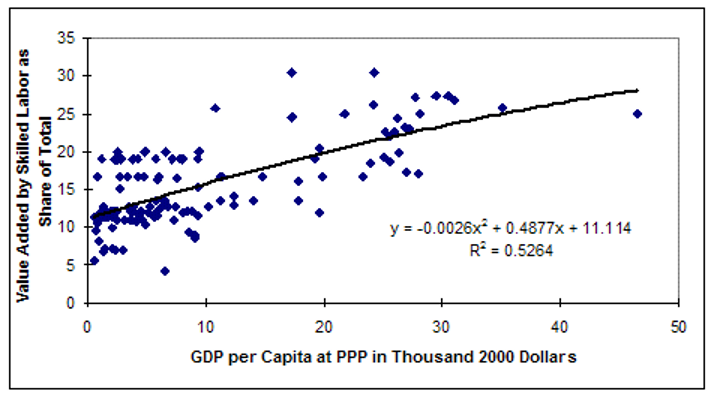
How do we know that an absence of skilled labor in the poorest countries is an exaggeration? In addition to common sense, it can be seen from the GTAP data on the income share of skilled labor in Figure 6.4. That shows that they obtain a substantial share of value added even at the lowest levels of GDP per capita. The two cross-sectional plots in Figures 6.4 and 6.5 show the shares of value added accruing to skilled and unskilled labor, respectively.
File history
Click on a date/time to view the file as it appeared at that time.
| Date/Time | Thumbnail | Dimensions | User | Comment | |
|---|---|---|---|---|---|
| current | ★ Approved revision 19:13, 10 May 2023 | | 714 × 398 (86 KB) | Julia.Detar (talk | contribs) |
You cannot overwrite this file.
File usage
The following page uses this file: