Socio-Political
The most recent and complete socio-political model documentation is available on Pardee's website. Although the text in this interactive system is, for some IFs models, often significantly out of date, you may still find the basic description useful to you.
A substantial portion of the socio-political model of IFs is scattered throughout the other models. There are "policy handles" or intervention points throughout those models. For instance, in the population model, multipliers on the total fertility rate can reflect policy decisions (although they can also reflect the model user's judgment concerning social changes in the country or region, independent of policy). Patterns of regulation, subsidy, tax incidence, and provision of state services are so diffuse and complicated that we resort to looking at their aggregate consequences through various "policy handles" rather than trying to represent them explicitly.
For more information on this module, please use the links below or read more at Socio-Political Equations Overview.
Structure and Agent System: Socio-Political
System/Subsystem
|
Socio-political
|
Organizing Structure
|
Social fabric
|
Stocks
|
Levels of human well-being and institutional development (human and social capital) Cultural structures
|
Flows
|
Social expenditures Value change
|
Key Aggregate Relationships (illustrative, not comprehensive)
|
Growth in literacy and human development; Democratic development, state failure
|
Key Agent-Class Behavior Relationships (illustrative, not comprehensive)
|
Government efforts to develop human capital through spending on health, education, R&D
|
Unlike the use of cohort-component structures in demographics and of markets and social accounting matrices for economics, there is no standard organizing structure that is widely used for representing socio-political systems. In the context of the TERRA project, IFs developed a multi-component approach to structure that might be called the "social fabric" (a la Robert Pestel).
Although representation of agent-class behavior would be of special interest in a socio-political module, most relationships in IFs remain at the level of aggregate specifications.
Dominant Relations: Socio-political
Domestic Socio-Political Change: Dominant Relations
Social and political change occurs on three dimensions (social characteristics or individual life conditions, values, socio-political institutions and process). Although GDP per capita is strongly correlated with all dimensions of change, it might be more appropriate to conceptualize a syndrome or complex of developmental change than to portray an economically-driven process.
For causal diagram see Socio-Political Flow Charts Overview.
For equations see, for example, Socio-Political Equations Overview.
Key dynamics are directly linked to the dominant relations:
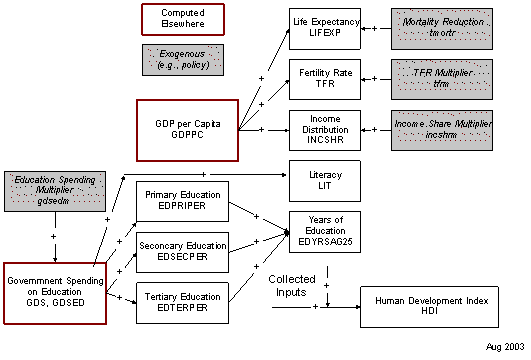
- The model computes some key social characteristics/life conditions, including life expectancy and fertility rates in the demographic model, but the user can affect them via multipliers (mortm, tfrm). Literacy rate is an endogenous function of education spending, which the user can influence (via gdsm).
- The model computes value or cultural change on three dimensions: traditional versus secular-rational, survival versus self-expression, and modernism versus postmodernism, which the user can affect via additive factors (tradsrateadd, survseadd, matpostradd).
- Freedom, democracy (the POLITY measure), autocracy, economic freedom, and the status of women are all computed endogenously but can all be shifted by the user via multipliers (freedomm, democm, autocm, econfreem, gemm)
Domestic Socio-Political Change: Selected Added Value
The larger socio-political model provides representation and control over government spending on education, health, the military, R&D, foreign aid, and a residual category. Military spending is linked to interstate politics, both as a driver of threat and as a result of action-and-reaction based arms spending. The sub-model provides aggregated indicators of the physical quality of life and the human development index.
Socio-political Flow Charts
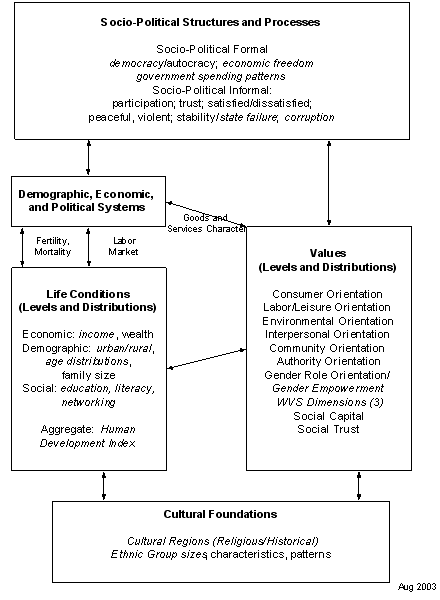
The social and political module represents a complex of interacting structures and processes. These include:
- The various social characteristics or life conditions of individuals
- Human values, beliefs, and orientations’
- Social and political structures, informal as well as formal
- Social and political processes, both domestic and international
Cultural foundations frame all of these components. And all of the components interact closely with human demographic and economic systems.
The socio-political elements of IFs are among the most dynamically evolving aspects of the overall modeling system. Much, but not everything in the above figure has been fully represented yet within IFs; the figure indicates direction of development and shows implemented elements in italics.
For more, please read the links below.
Social Characteristics: Life Conditions
Individuals are the foundations of society. Many social indicators are actually aggregated indicators of their condition. The Human Development Index (HDI) is a widely-used summary measure of that life condition, based on life expectancy, educational attainment, and GDP per capita.
Physical Quality of Life (PQLI)
The Overseas Development Council (then under the leadership of Jim Grant) developed and pu
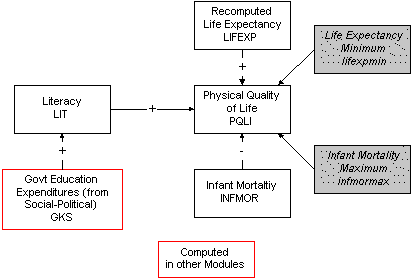
blicized a measure of (physical) quality of life (the PQLI) many years ago. It combines literarcy rate, infant mortality rate, and life expectancy, using scales from the lowest to the highest values in the global system. It weights the three scales equally. The literacy rate is, in turn, a function of the per capita spending levels on education, estimated cross-sectionally. In many respects the PQLI was a predecessor of the human development index (HDI).
Based on country/region-specific Physical Quality of Life, it is possible to compute world quality of life (WPQLI) and the North-South gap in quality of life (NSPQLI). Given country-specific literacy rates, it is also possible to compute world literacy (WLIT).
Income Distribution
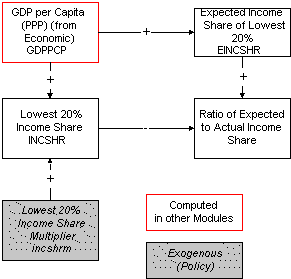
Income distribution is represented by the share of national income earned by the poorest 20 percent of the population. That share is obtained from data whenever possible, but is estimated from a cross-sectional relationship when necessary and changed over time by that relationship (the values tend, however, to be very stable both in the real world and in the model). Because initial conditions of variables affected by income share, such as fertility and mortality rates, already reflect existing income distributions, it is only the changes in that distribution relative to the expected value that the model uses in such relationships. A parameter (incshrm) is available to change income share and thus affect those variables influenced by it.
Social Characteristics: Networking
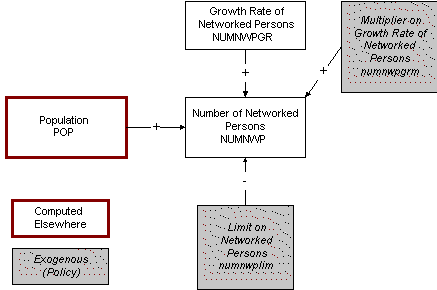
Being electronically networked is an increasingly important aspect of human life condition. The numb
er of networked persons (NUMNWP) is a function primarily of the growth rate in that number (NUMNWPGR). It is ultimately constrained, however, by the size of the population and by the number of connections and organizational memberships that people can have (numnwplim). The growth in networked person number slows as it approaches the ultimate limit. The model user can affect the growth pattern via a multiplier on the growth rate (numnwpgrm).
This approach was added to IFs during the TERRA project and draws on the thinking of Tom Tesch and Pol Descamps <header><hgroup>
Social Values and Cultural Evolution
</hgroup></header> IFs computes change in three cultural dimensions identified by the World Values Survey (Inglehart 1997). Those are dimensions of materialism/post-materialism, survival/self-expression, and traditional/secular-rational values.
Inglehart has identified large cultural regions that have substantially different patterns on these value dimensions and IFs represents those regions, using them to compute shifts in value patterns specific to them.
Levels on the three cultural dimensions are predicted not only for the country/regional populations as a whole, but in each of 6 age cohorts. Not shown in the flow chart is the option, controlled by the parameter "wvsagesw," of computing country/region change over time in the three dimensions by functions for each cohort (value of wvsagesw = 1) or by computing change only in the first cohort and then advancting that through time (value of wvsagesw = 2).
The model uses country-specific data from the World Values Survey project to compute a variety of parameters in the first year by cultural region (English-speaking, Orthodox, Islamic, etc.). The key parameters for the model user are the three country/region-specific additive factors on each value/cultural dimension (matpostradd, etc.).
Finally, the model contains data on the size (percentage of population) of the two largest ethnic/cultural groupings. At this point these parameters have no forward linkages to other variables in the model.
