Uploads by Wikiadmin
Jump to navigation
Jump to search
This special page shows all uploaded files.
| Date | Name | Thumbnail | Size | Description | Versions |
|---|---|---|---|---|---|
| 18:23, 7 September 2018 | NetworkedPersons2.gif (file) |  |
5 KB | 1 | |
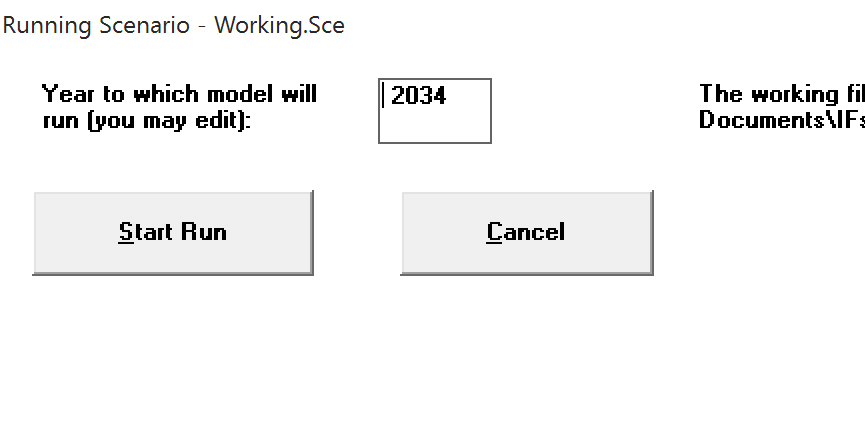
| 22:34, 8 December 2016 | RunScreenWithOptionOff.png (file) |  |
13 KB | Run Screen with Menu Option 1 turned off. | 1 |
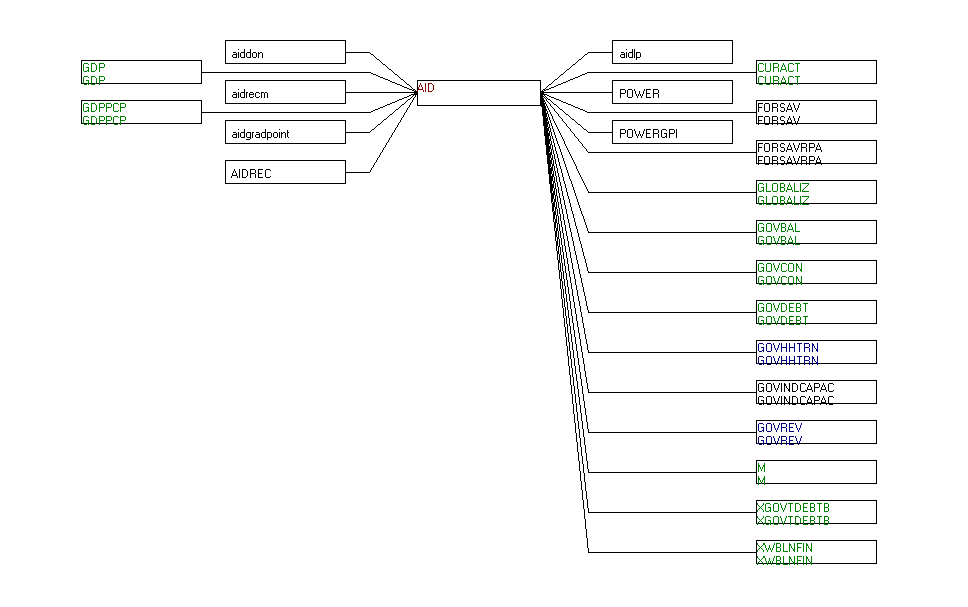
| 20:41, 8 December 2016 | AidDrivers.png (file) |  |
21 KB | Drivers of AID (foreign) | 1 |
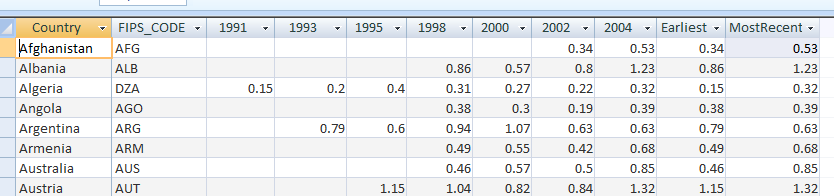
| 22:49, 28 March 2016 | IfsHistSeries.png (file) | 23 KB | 1 | ||
| 21:32, 28 March 2016 | Test.png (file) | 23 KB | 1 | ||
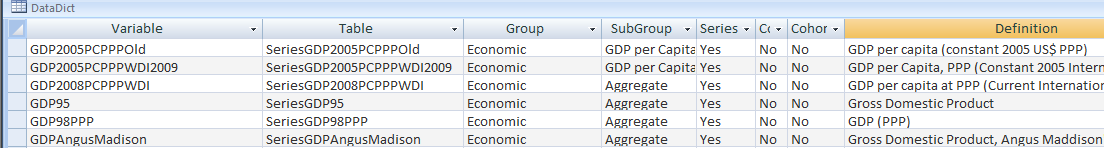
| 22:51, 28 March 2016 | DataDict.png (file) | 25 KB | 1 | ||
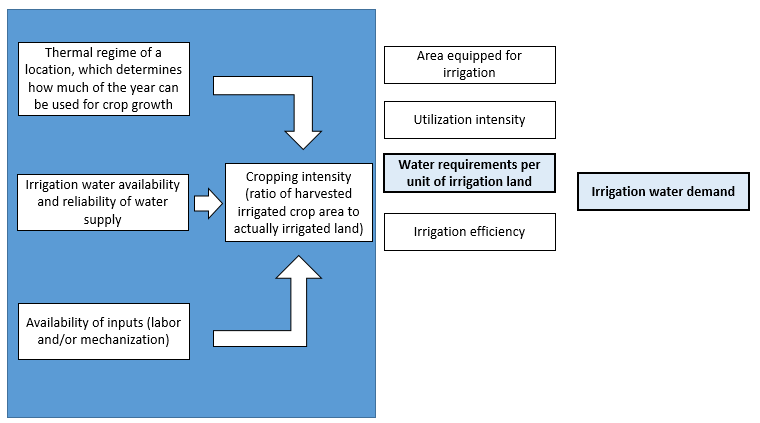
| 21:11, 24 August 2017 | WaterRequirementsPerIrrigatedLand.png (file) |  |
26 KB | 1 | |
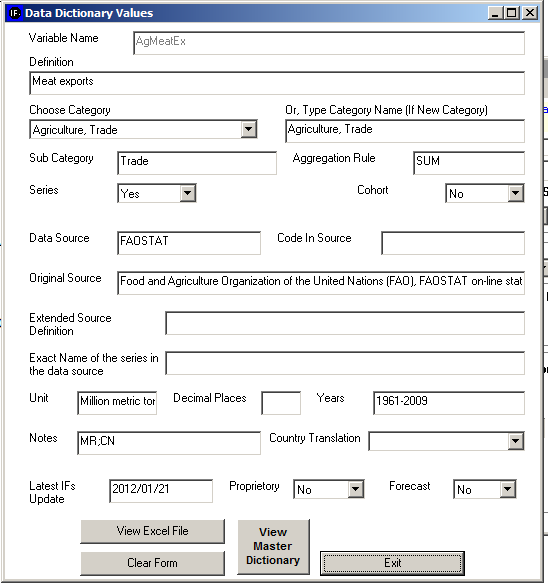
| 23:00, 28 March 2016 | DataDictWizard.png (file) |  |
26 KB | 1 | |
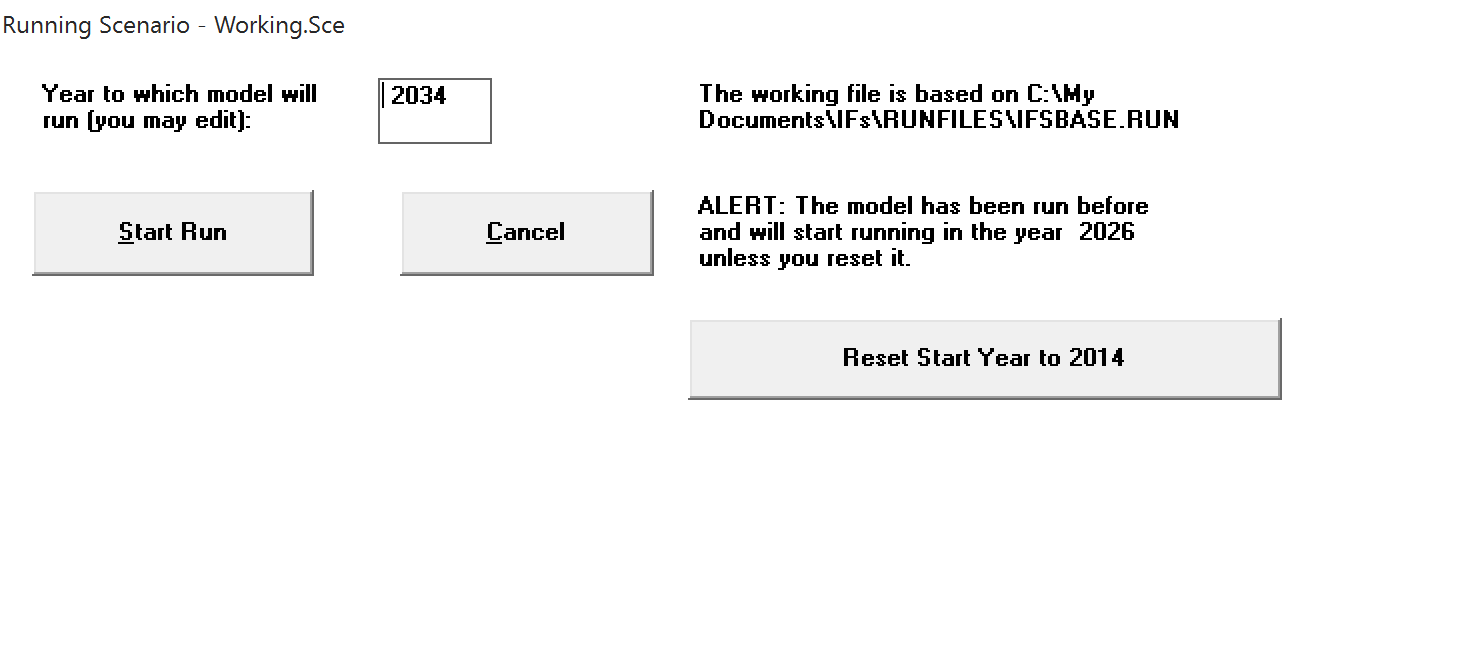
| 22:33, 8 December 2016 | RunScreenWithOptionOn.png (file) |  |
27 KB | Run Screen with Menu Option 1 turned on. | 1 |
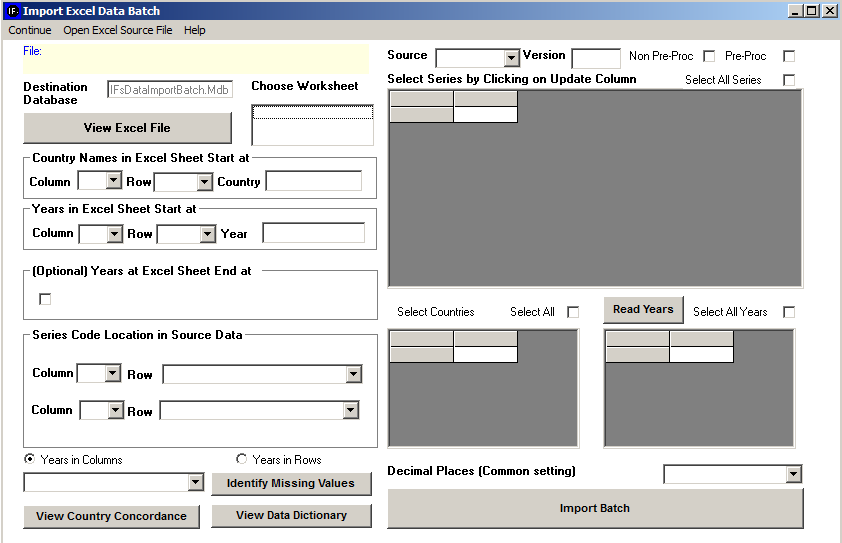
| 23:20, 28 March 2016 | BatchImportWizard.png (file) |  |
29 KB | 2 | |
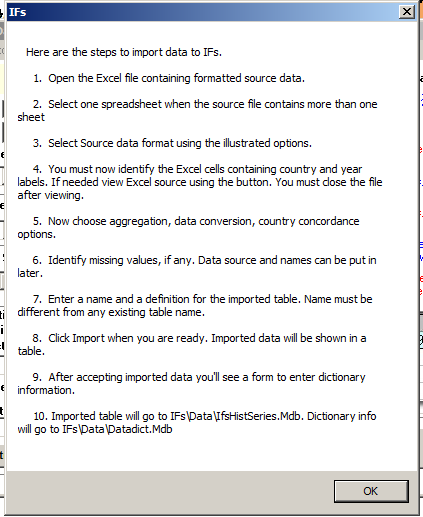
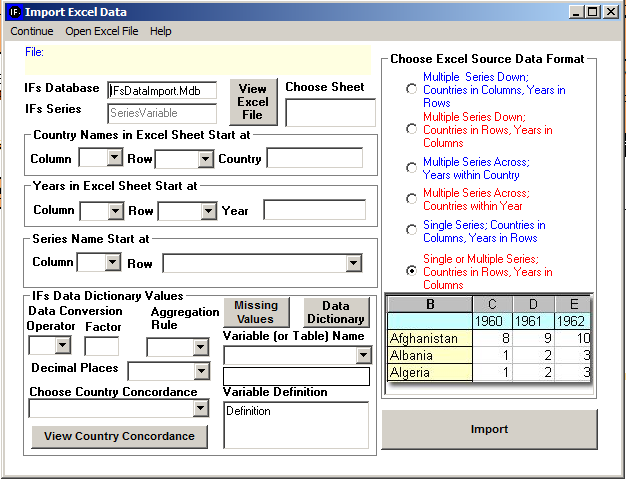
| 22:59, 28 March 2016 | ImportDataInstructions.png (file) |  |
32 KB | 1 | |
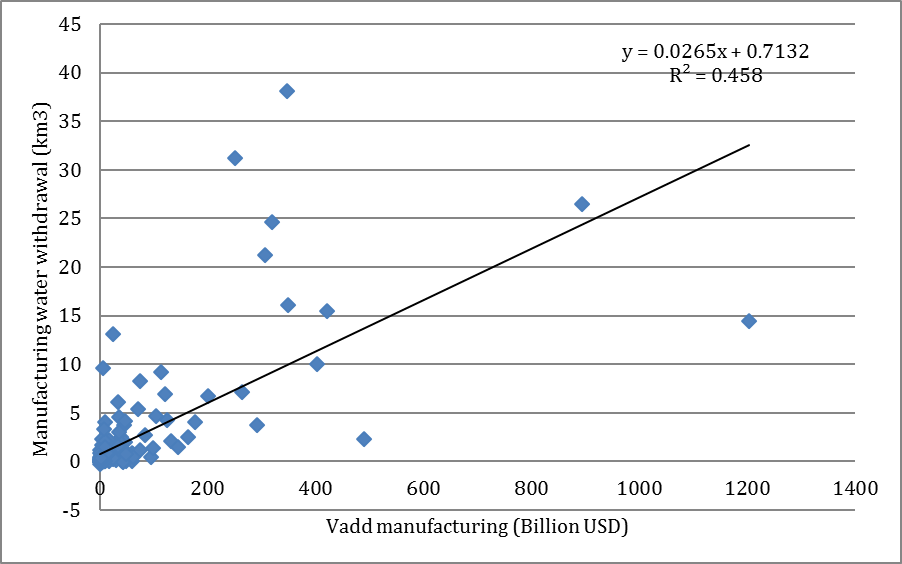
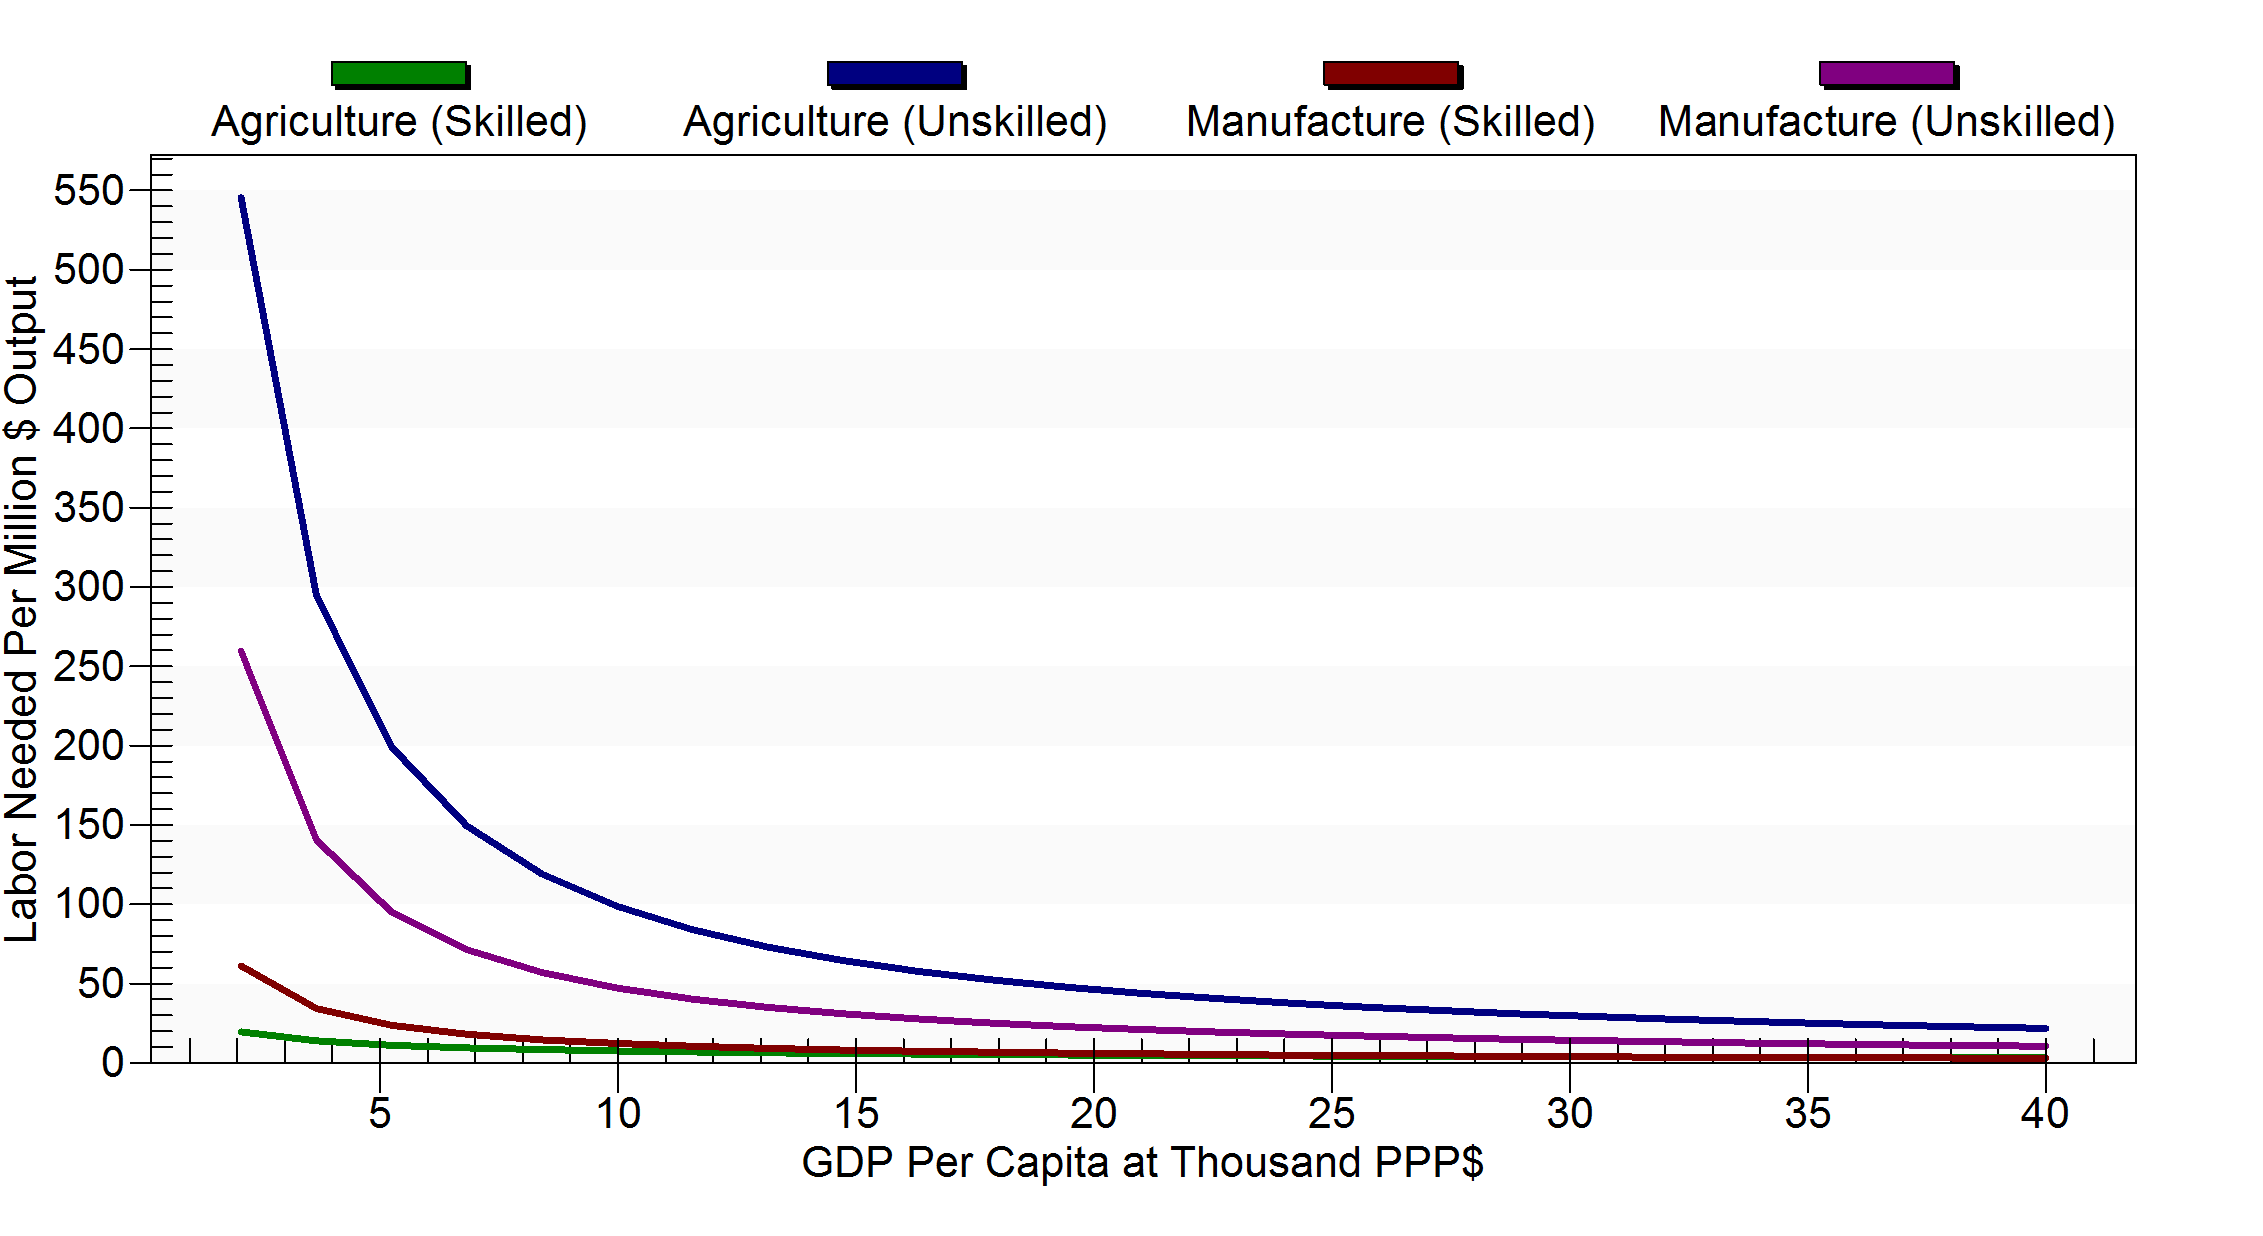
| 23:33, 24 August 2017 | ManufacturingScatter.png (file) |  |
33 KB | 1 | |
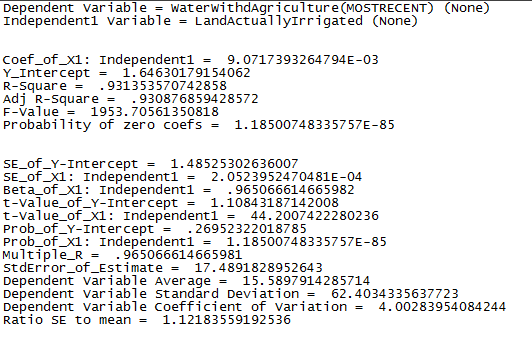
| 21:14, 24 August 2017 | WaterWithDAgRegression.png (file) |  |
33 KB | 1 | |
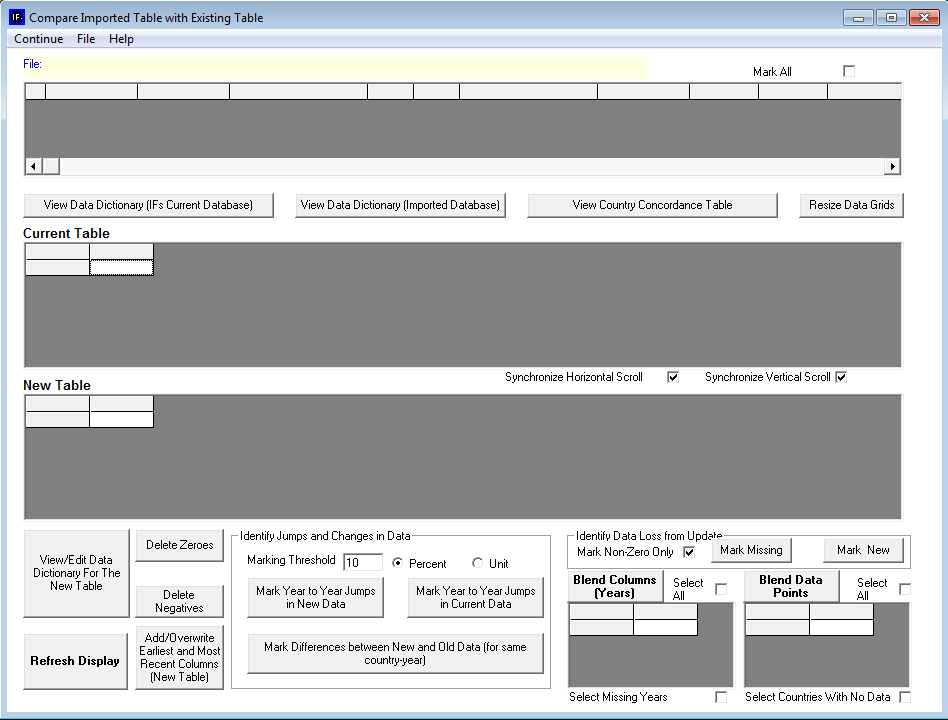
| 21:45, 31 March 2016 | VetDataCompareWizard.png (file) |  |
35 KB | 1 | |
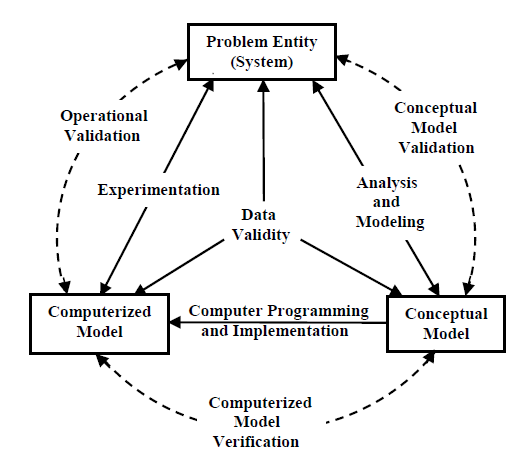
| 08:45, 16 September 2016 | ModellingProcessSargent.png (file) |  |
36 KB | 1 | |
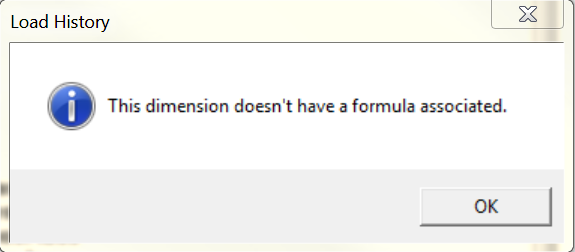
| 16:10, 2 May 2016 | FishDimension.png (file) |  |
36 KB | Dimension doesn't have formula attached. | 1 |
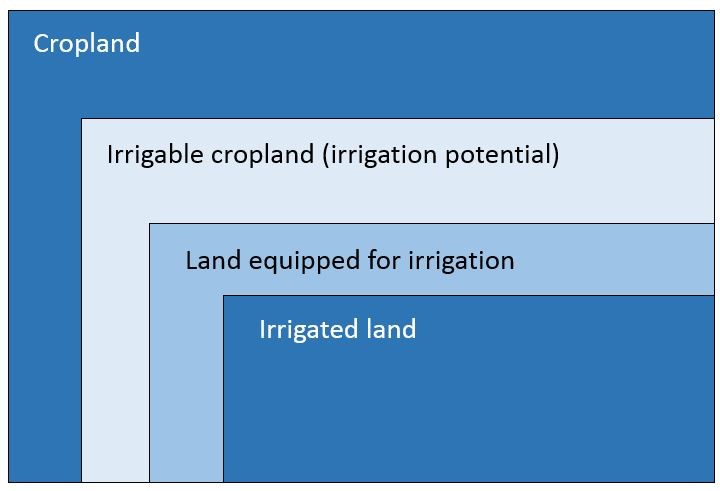
| 19:30, 7 September 2018 | LandSubsets.jpg (file) |  |
37 KB | 1 | |
| 21:22, 10 September 2017 | WaterwithdrawWhenWDExceedLimit.jpg (file) |  |
37 KB | 1 | |
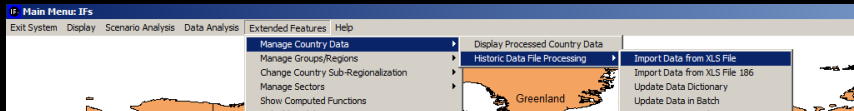
| 22:56, 28 March 2016 | ImportDataFromXLSFile.png (file) | 41 KB | 1 | ||
| 21:09, 24 August 2017 | IrrigationRegression.png (file) |  |
42 KB | 1 | |
| 17:39, 1 August 2018 | Geo 186.png (file) |  |
44 KB | 3 | |
| 20:42, 24 August 2017 | ForwardLinkagesOverview.jpg (file) |  |
48 KB | 1 | |
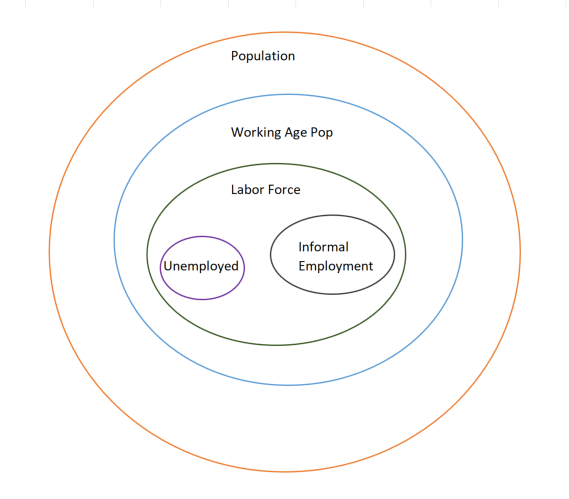
| 22:37, 7 September 2018 | LaborSubsets.png (file) |  |
52 KB | 1 | |
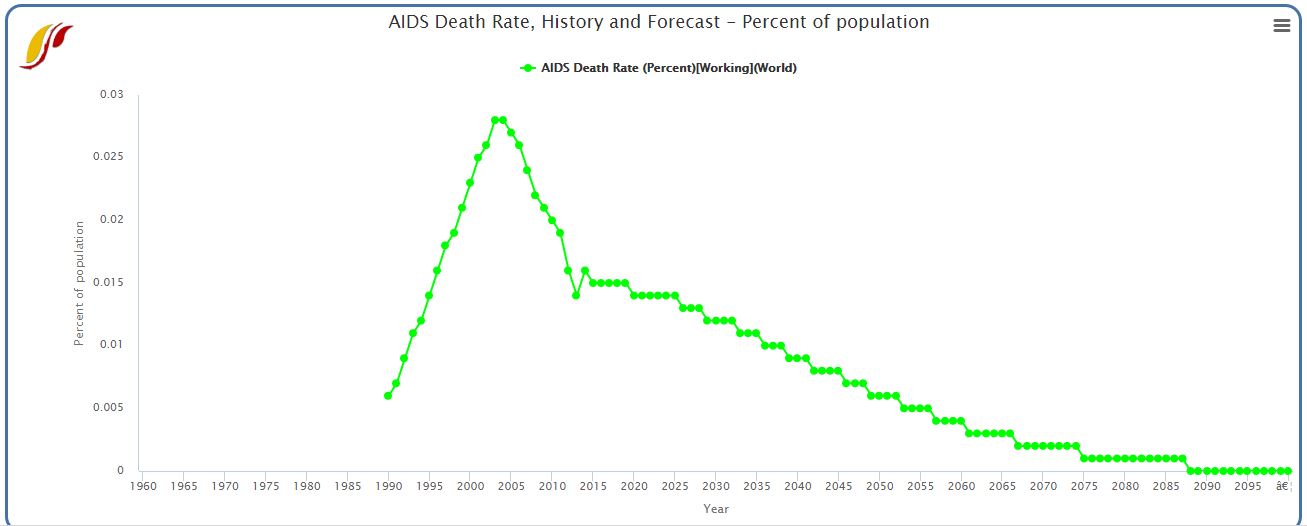
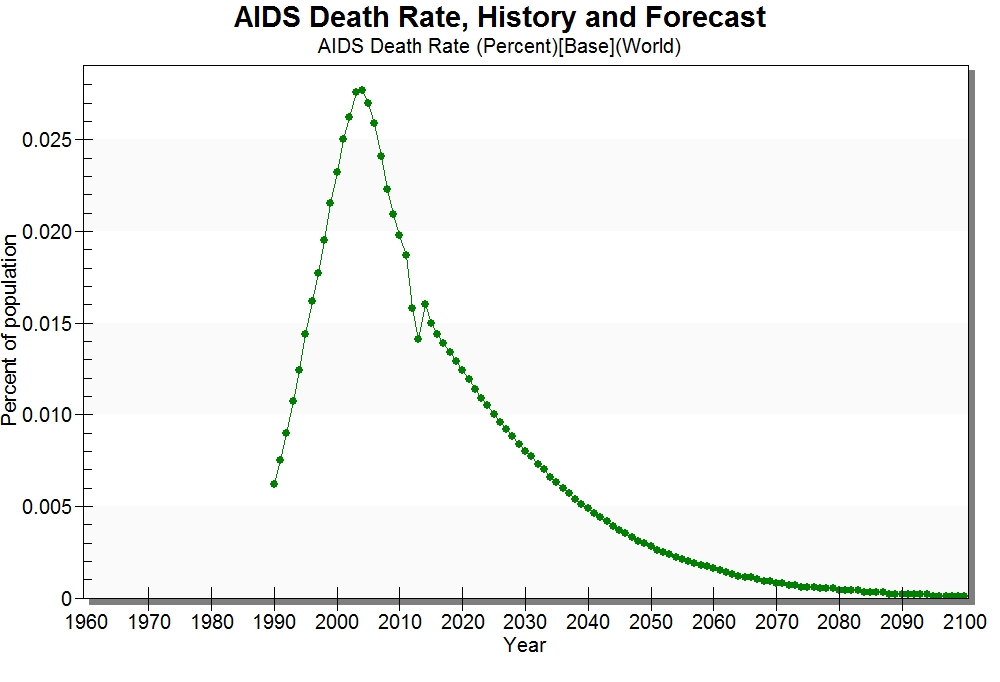
| 18:11, 9 December 2016 | AIDSDEaths726.JPG (file) |  |
55 KB | AIDS death rate, IFs 7.26 | 1 |
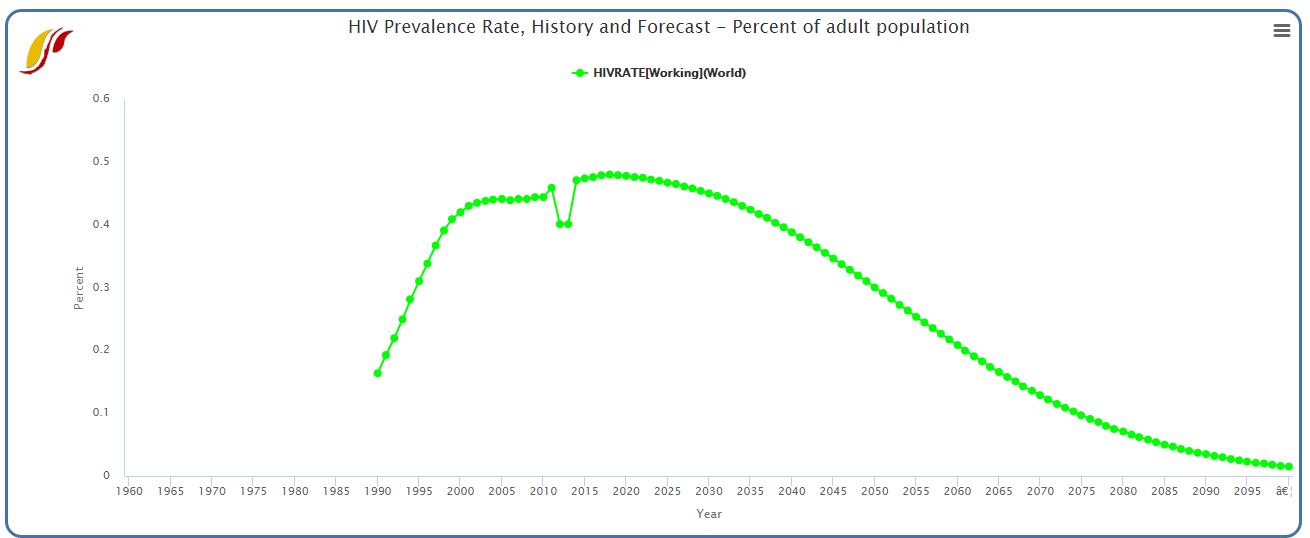
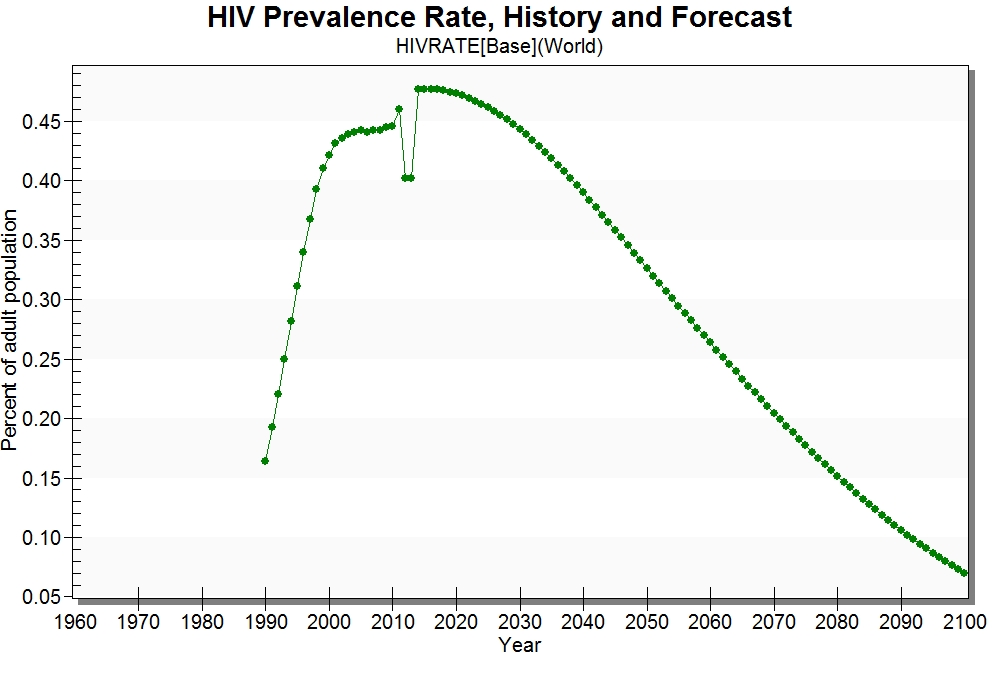
| 18:12, 9 December 2016 | HIVPrevalence726.JPG (file) |  |
56 KB | Prevalence of HIV, IFs 7.26 | 1 |
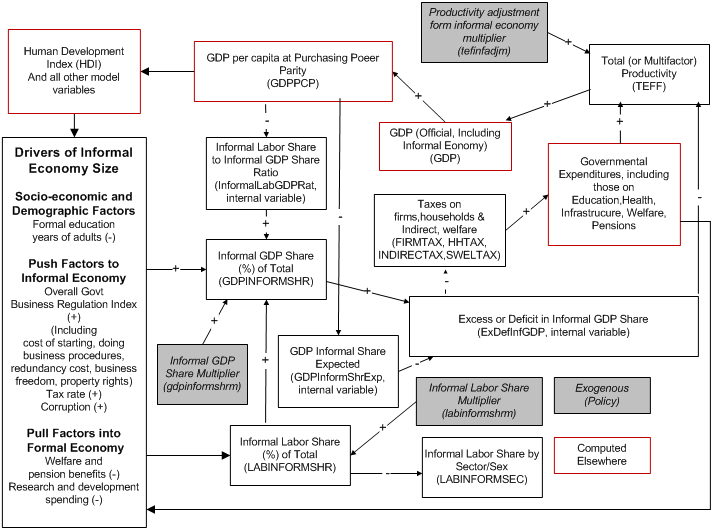
| 22:51, 17 August 2017 | InformalEconomyOverview.png (file) |  |
57 KB | 1 | |
| 22:58, 28 March 2016 | ImportDataWizard.png (file) |  |
58 KB | 1 | |
| 22:52, 7 September 2018 | LaborCoefficientFunctions.png (file) |  |
61 KB | 1 | |
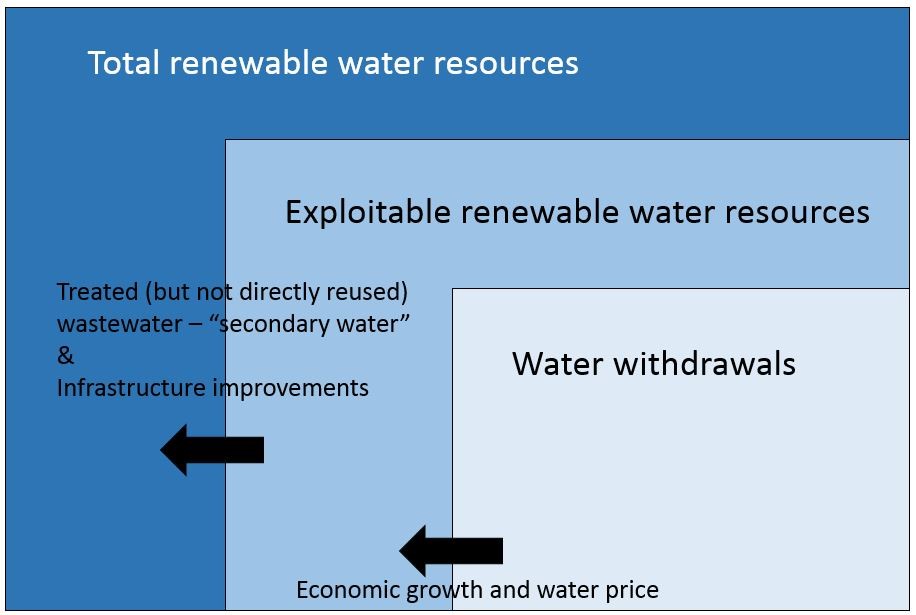
| 23:52, 24 August 2017 | SurfaceAndGroundResources.jpg (file) |  |
66 KB | 1 | |
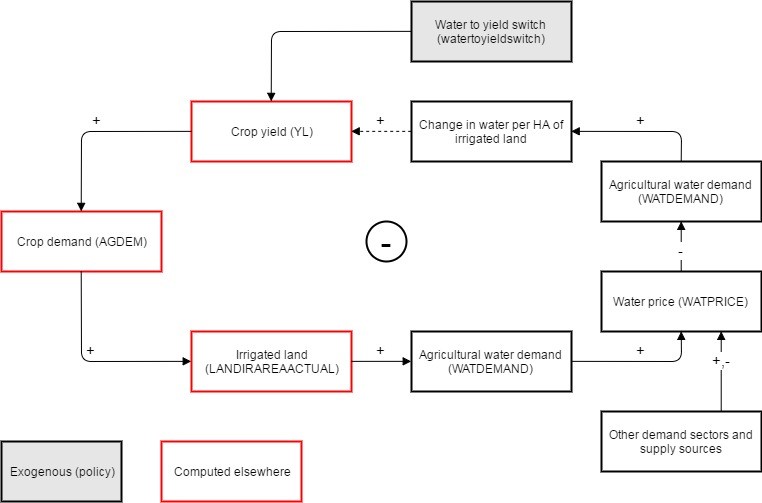
| 20:34, 24 August 2017 | WaterOverview.jpg (file) |  |
84 KB | 1 | |
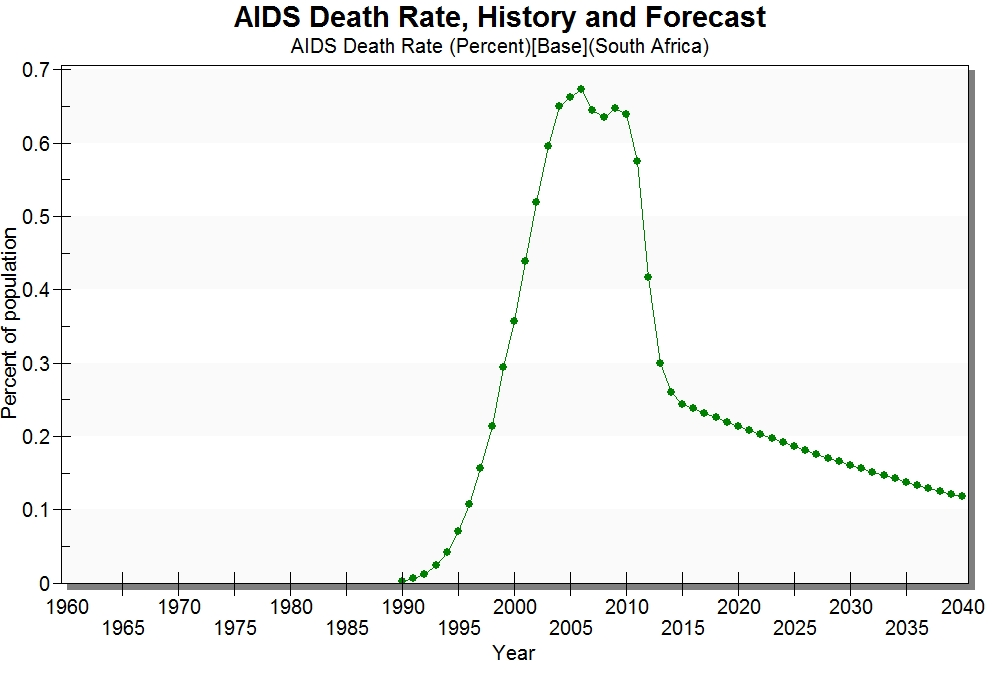
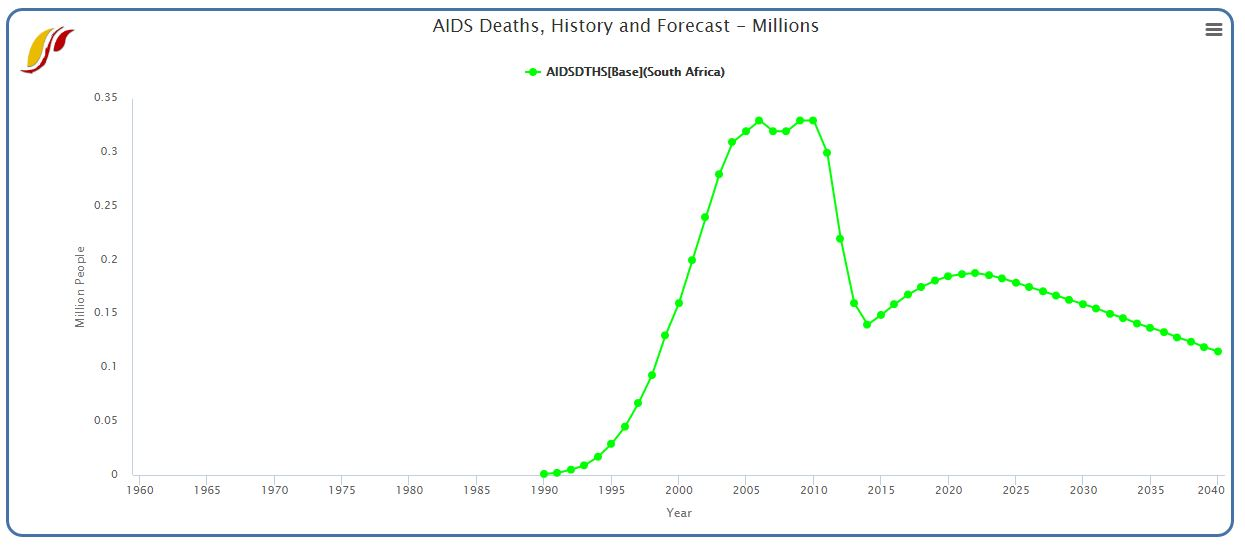
| 22:19, 8 December 2016 | AidsDeaths727.png (file) |  |
101 KB | AIDs death rate from IFs 7.27 B1 for South Africa. | 1 |
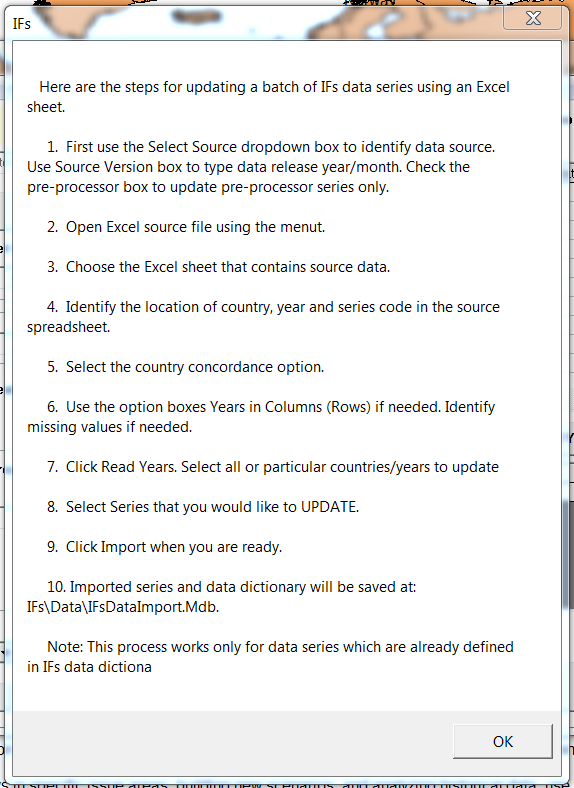
| 23:06, 28 March 2016 | BatchImportInstructions.png (file) |  |
104 KB | Step by step guide to batch update. (Note: Step 10 has the filename wrong. Extracted data actually goes to IFsDataImportBatch.Mdb as described below). | 1 |
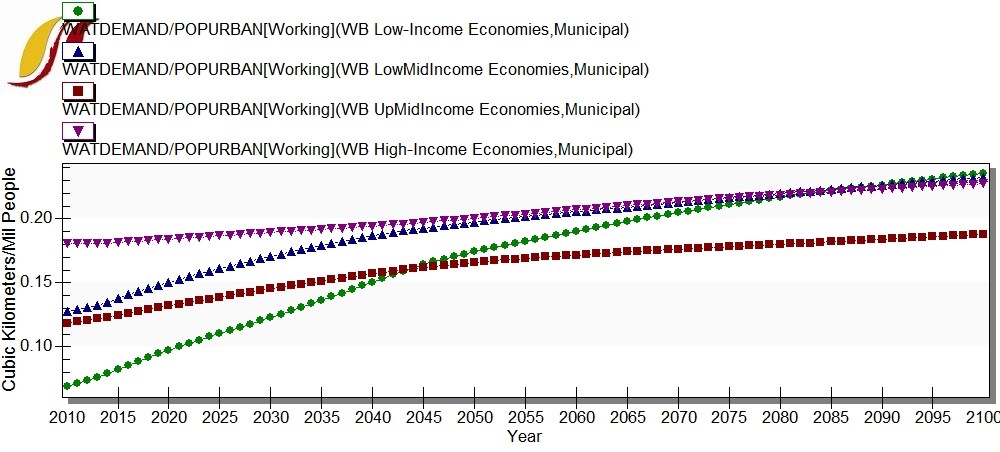
| 21:30, 24 August 2017 | MunDemandPerCapitaChart.jpg (file) |  |
111 KB | 1 | |
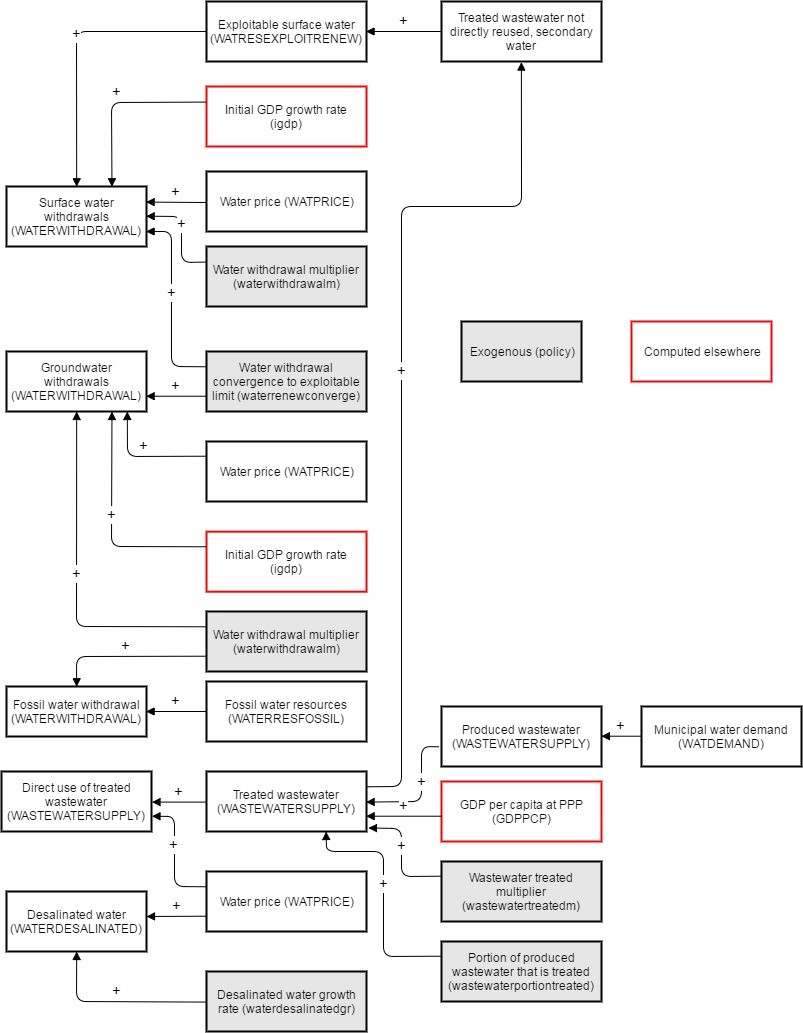
| 20:42, 24 August 2017 | SuppleOverview.jpg (file) |  |
121 KB | 1 | |
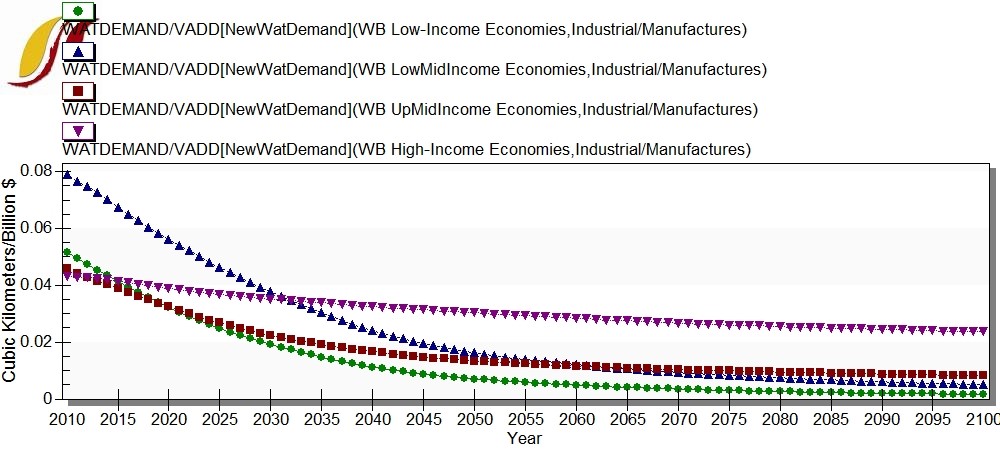
| 23:44, 24 August 2017 | ManufacturingWaterDemandPerUnit.jpg (file) |  |
123 KB | 1 | |
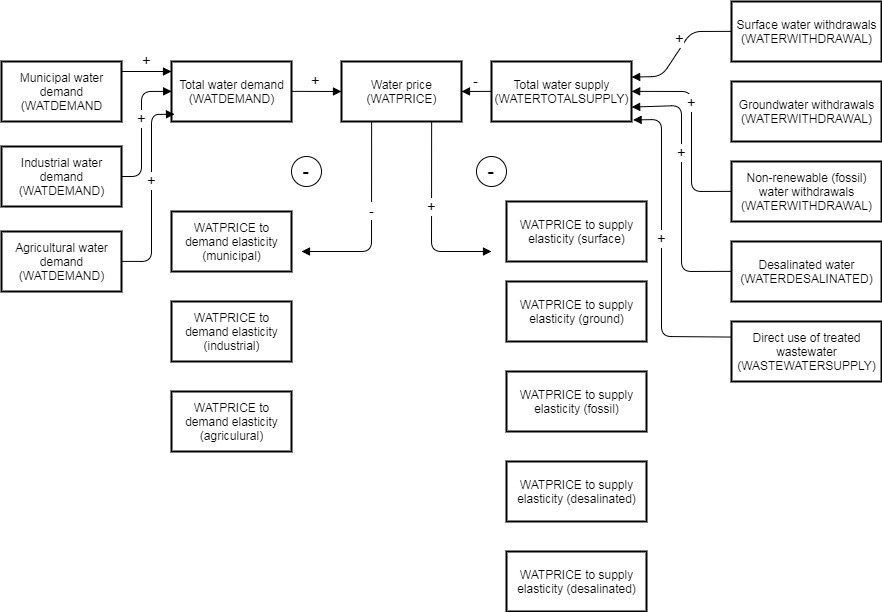
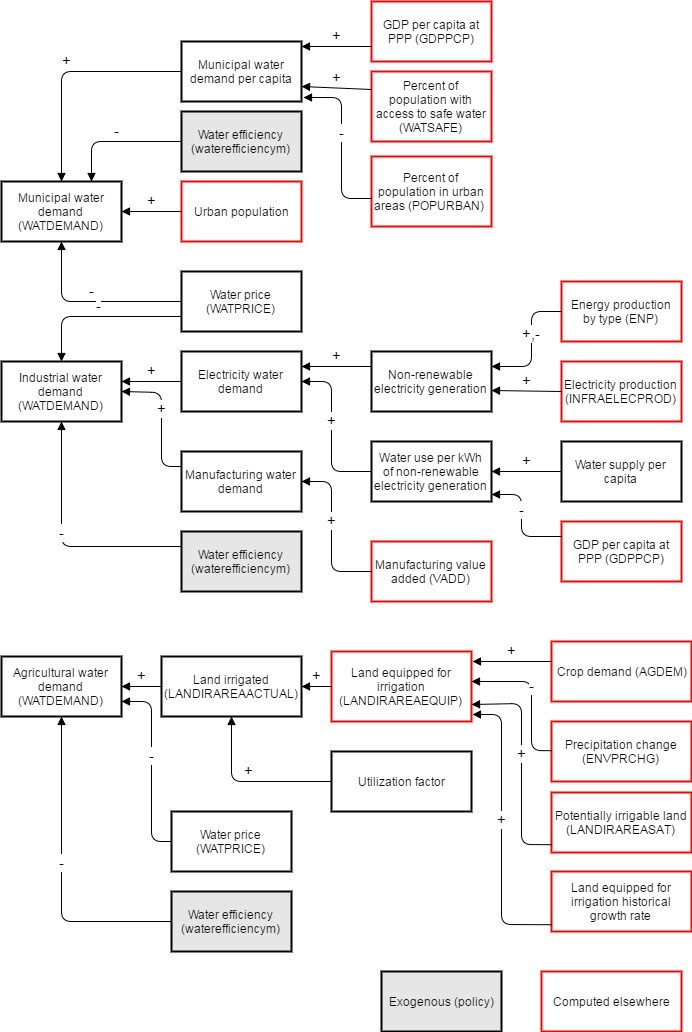
| 20:41, 24 August 2017 | DemandOverview.jpg (file) |  |
131 KB | 1 | |
| 22:18, 8 December 2016 | AidsDeaths726.png (file) |  |
143 KB | Aids death rate from IFs 7.26 for South Africa. | 1 |
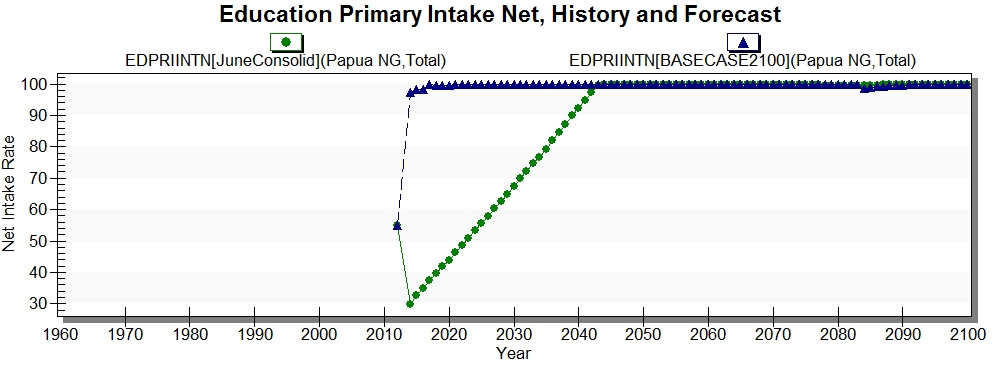
| 23:43, 1 July 2016 | PapuaPriIR.jpg (file) |  |
149 KB | Change in primary intake rates in Papua New Guinea | 1 |
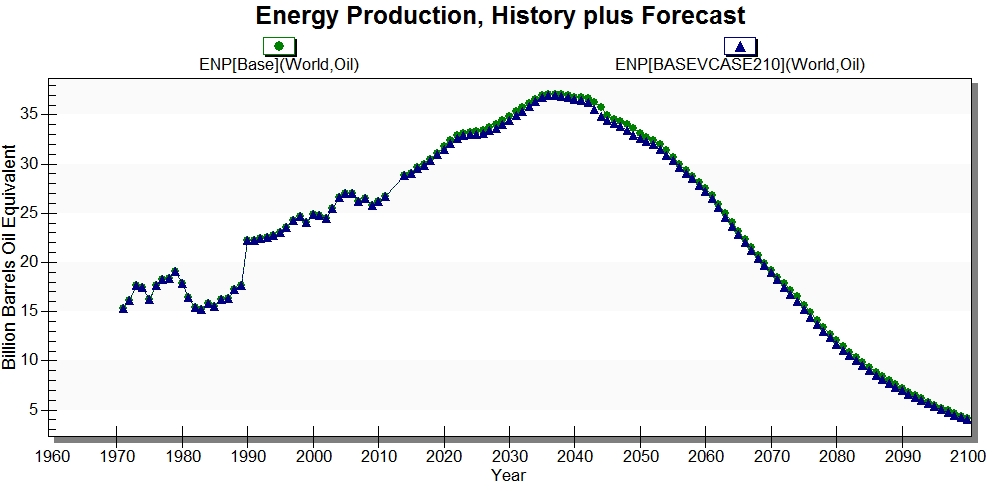
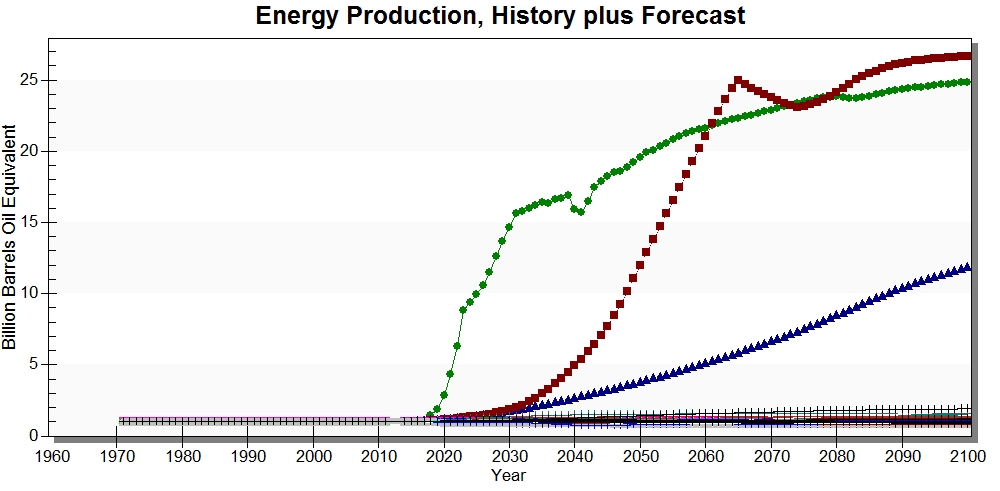
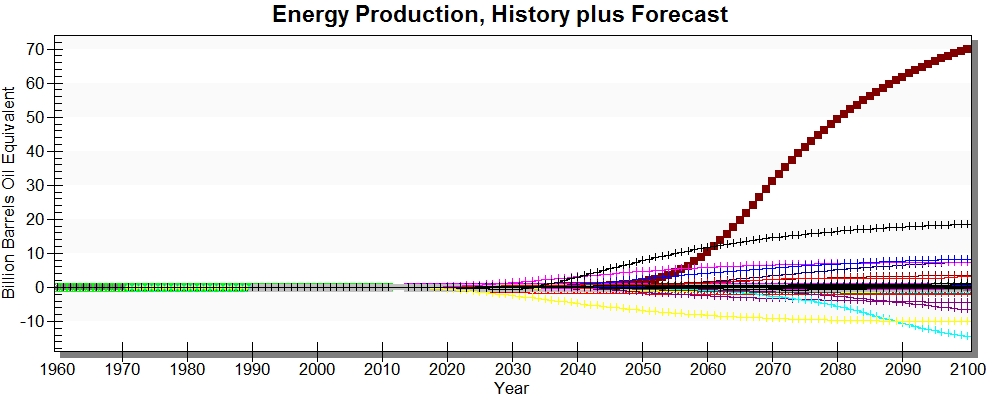
| 17:13, 1 May 2016 | GlobalOil.jpg (file) |  |
149 KB | Global oil production in the Base Case (7.21) and the new Base Case. | 1 |
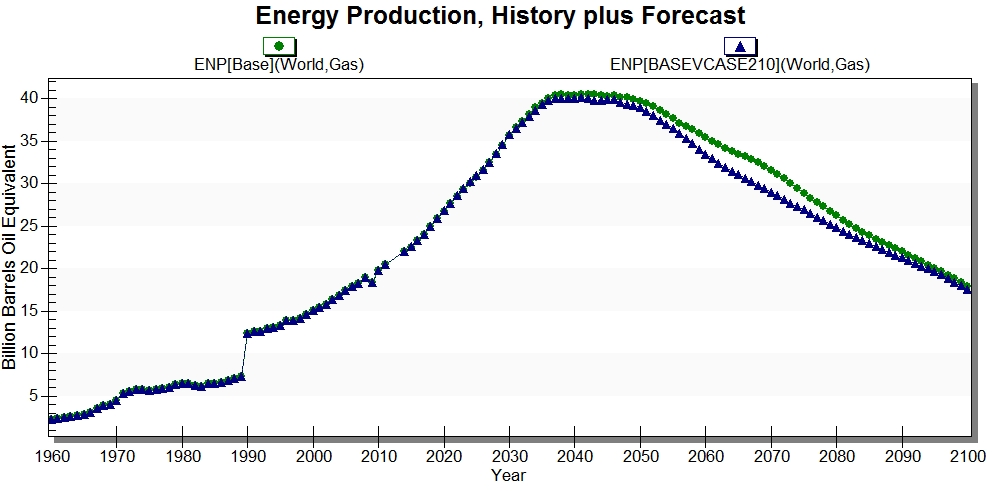
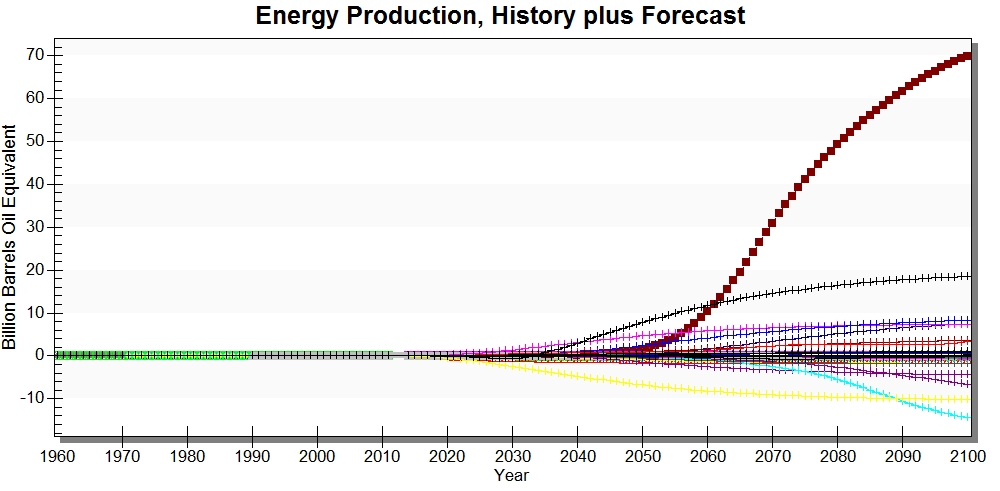
| 15:25, 2 May 2016 | GlobalGasProduction.jpg (file) |  |
158 KB | Global gas production in the Base Case (7.21) and after adding BGR resources and reserves data. | 2 |
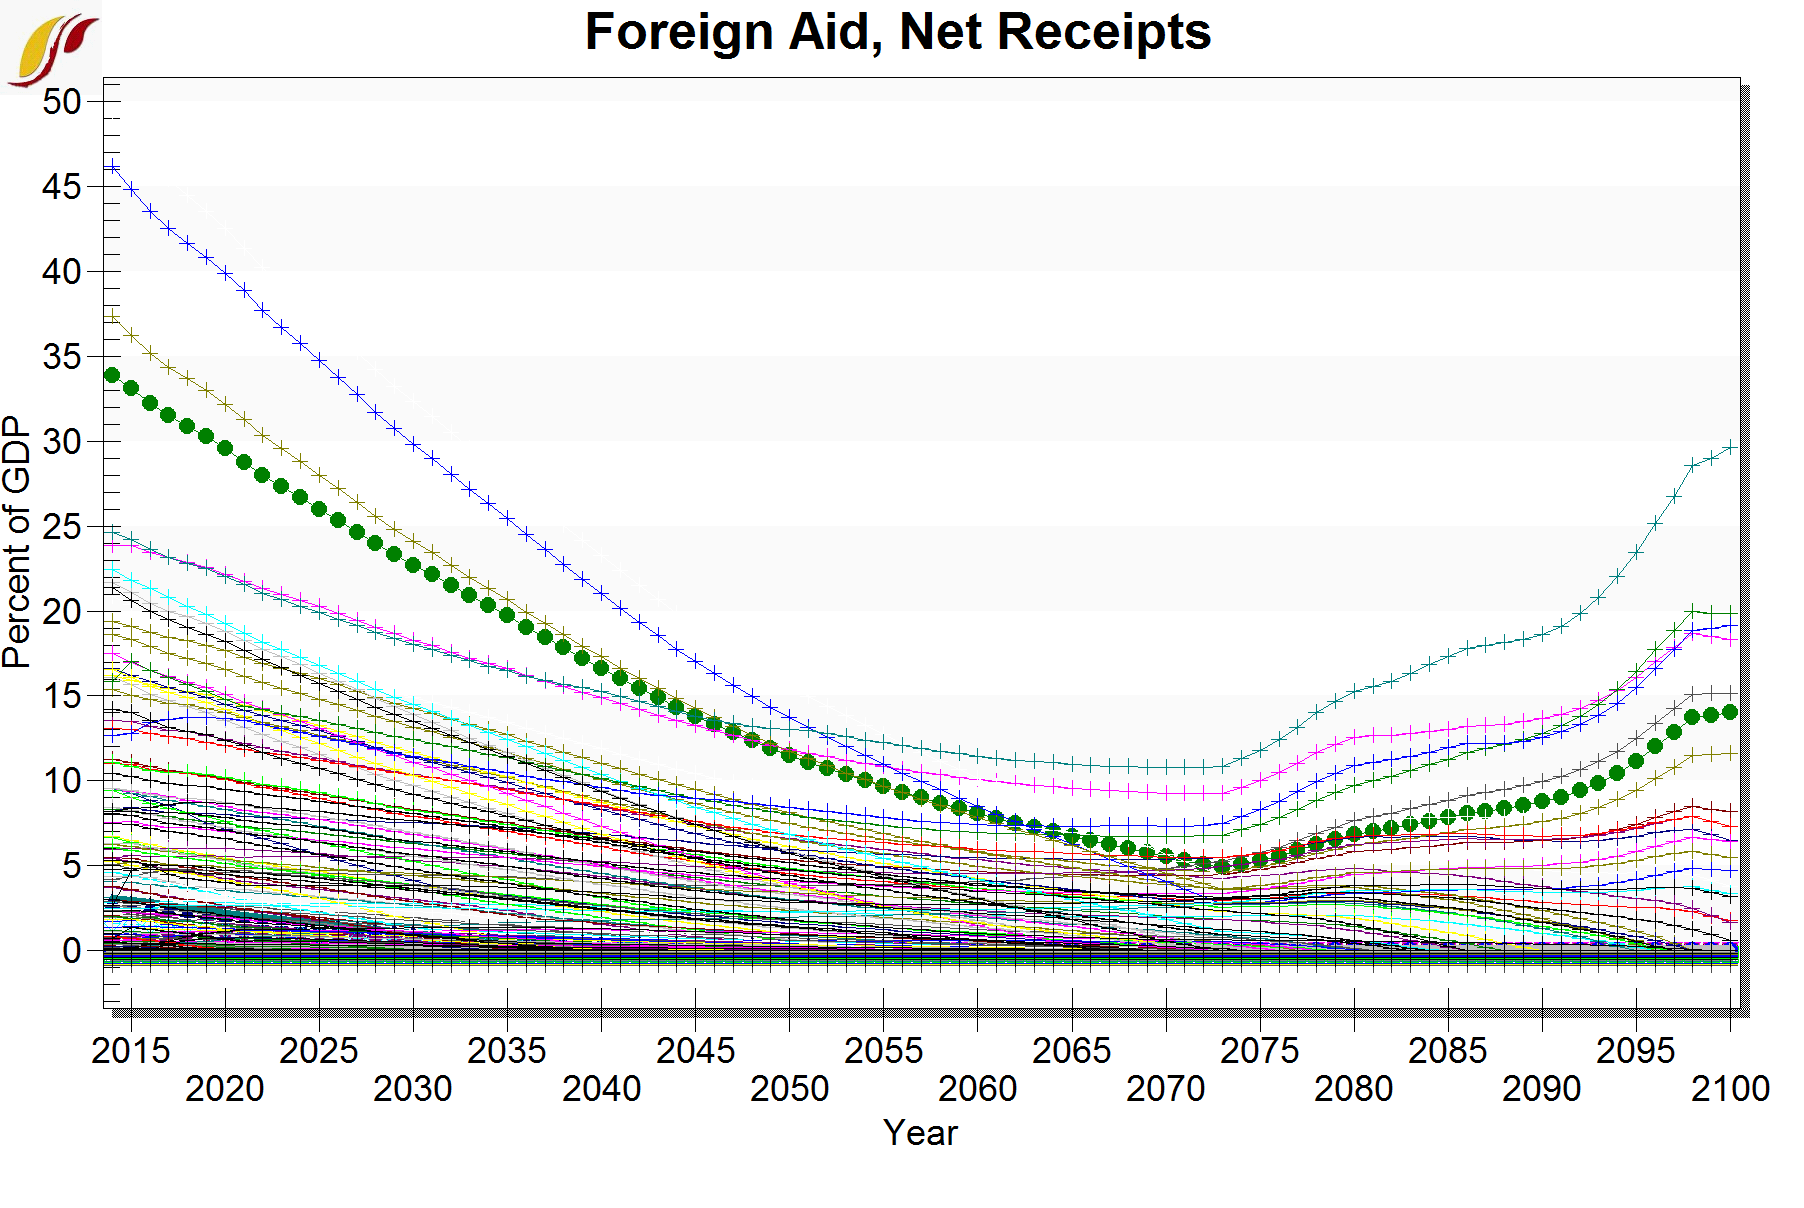
| 22:02, 8 December 2016 | Aidin727.png (file) |  |
158 KB | Foreign aid, net receipts as a percent of GDP for all countries taken from the development version of 7.27 B1. | 1 |
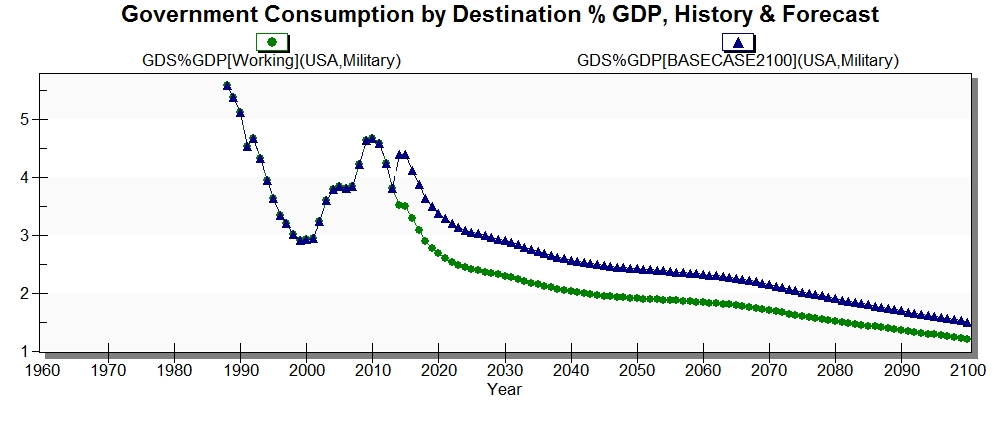
| 15:30, 1 July 2016 | USAMilSpending.jpg (file) |  |
163 KB | Change in US military spending after updating SIPRI data. | 1 |
| 18:27, 9 December 2016 | AIDSDeathRate727.jpg (file) |  |
169 KB | 2 | |
| 18:59, 30 April 2016 | OilIncreases.jpg (file) |  |
171 KB | Increases in oil production (new Base Case divided by old Base Case). Largest increases in Mongolia (green), Pakistan (red), and Niger (blue). | 1 |
| 18:57, 30 April 2016 | Sss.jpg (file) |  |
171 KB | Increases in oil production (new Base Case divided by old Base Case). Largest increases in Mongolia (green), Pakistan (red), and Niger (blue). | 1 |
| 18:27, 9 December 2016 | HIVPrevalence727.jpg (file) |  |
174 KB | 2 | |
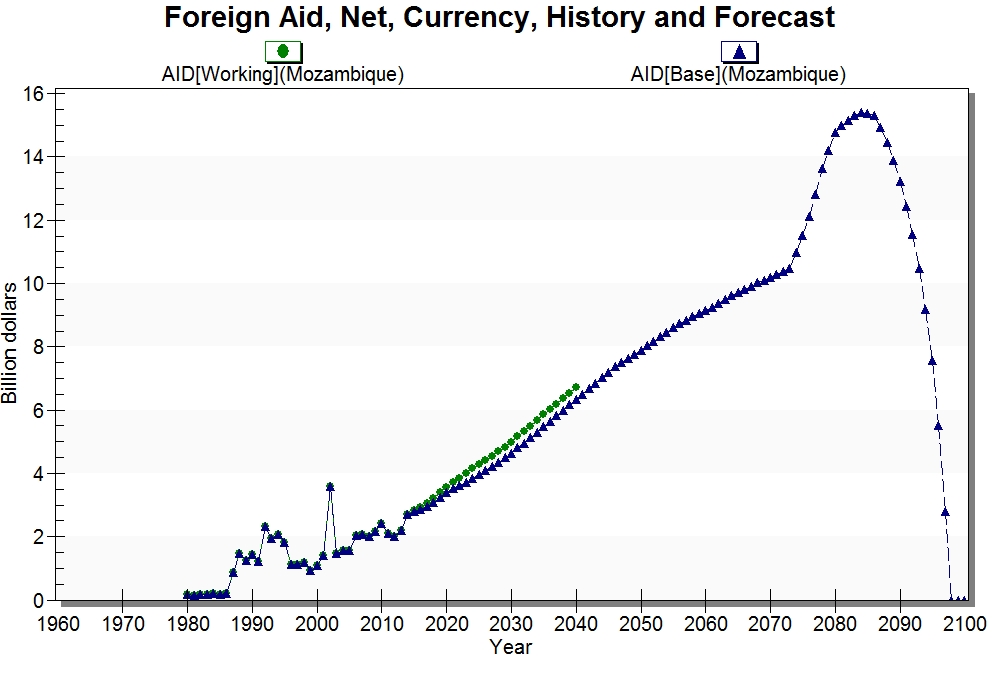
| 17:37, 9 December 2016 | MozambiqueAID.jpg (file) |  |
179 KB | Aid in Mozambique (net), IFs version 7.27 B1 | 1 |
| 18:49, 1 May 2016 | GasProductionByCountry.jpg (file) |  |
179 KB | Gas production changes by country (cumulative) from the old Base Case (7.21) and the new Base Case. | 1 |
| 15:29, 2 May 2016 | GasProductionbyCountry.jpg (file) |  |
186 KB | Changes in gas production in absolute BBOE (cumulative) in the Base Case of 7.21 compared to the new Base Case after adding new BGR data on resources and reserves. | 1 |
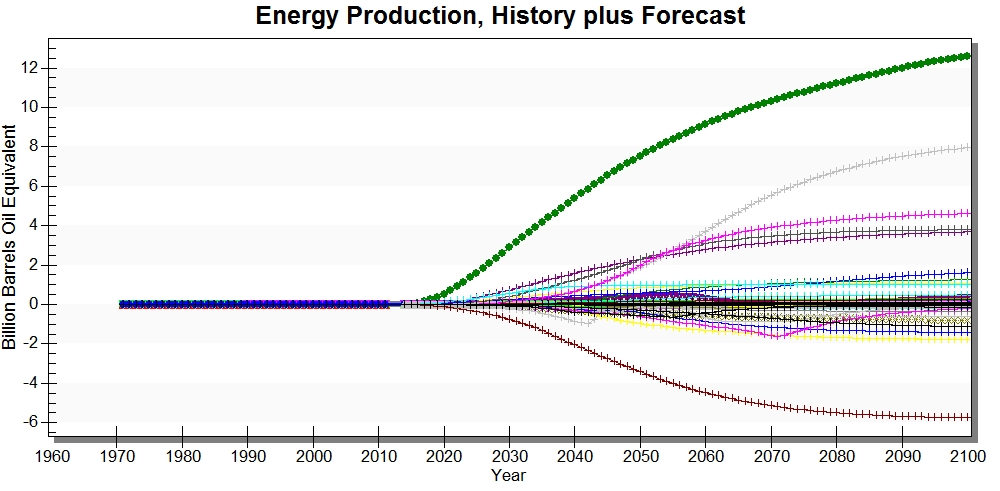
| 17:24, 1 May 2016 | AbsoluteChangesinOilProduction.jpg (file) |  |
220 KB | Changes in oil production (BBOE) by country, cumulative. The largest increase is in the US (green), followed by Pakistan (grey), and Russia (pink). The largest decrease is in China (brown). | 1 |