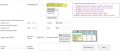
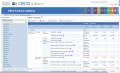
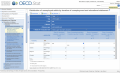
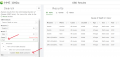
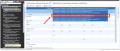
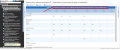
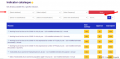
Gallery of new files
Jump to navigation
Jump to search
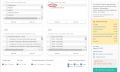
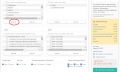
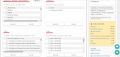
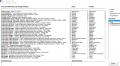
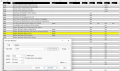
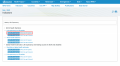
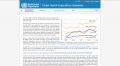
This special page shows the last uploaded files.


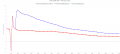
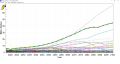
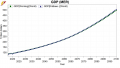
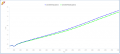
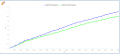
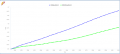
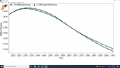
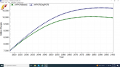
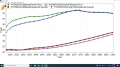
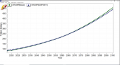
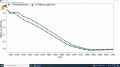
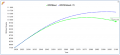
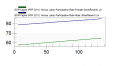
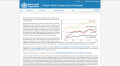
 Oman GDPPC Comparison- Green - Updated Data; Blue - Packaged Base Case.png Norah.Shamin
18:02, 29 March 2024
975 × 442; 43 KB
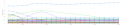
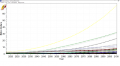
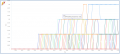
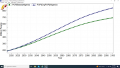
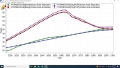
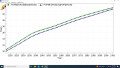
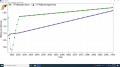
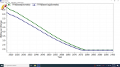
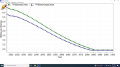
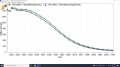
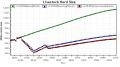
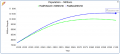
 Bahrain Run Comparison GDP Growth Rate, Percent; Red-Green - Updated Migration Data Runs, Blue - Packaged Base.png Norah.Shamin
17:50, 29 March 2024
975 × 437; 43 KB
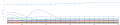
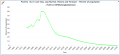
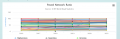
 All Updates Base- Migrants in, Millions; To 2040.png Norah.Shamin
17:46, 29 March 2024
975 × 203; 108 KB
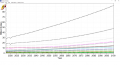
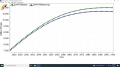
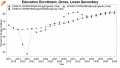 Education Enrollment, Gross, Lower-Secondary.png Norah.Shamin
18:32, 28 March 2024
959 × 541; 129 KB
 GOVCORRUPTBase(World) vs GOVCORRUPTGEMorg(World).png Norah.Shamin
18:17, 28 March 2024
975 × 436; 38 KB
 DEMOCPOLITYBase(World) vs DEMOCPOLITYGEMorg(World).png Norah.Shamin
18:09, 28 March 2024
973 × 438; 39 KB
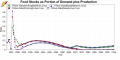 Food Stocks as Portion of Demand plus Production .png Norah.Shamin
17:58, 28 March 2024
975 × 484; 159 KB
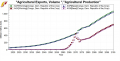 Agricultural Export, Volume, Agricultural Production.png Norah.Shamin
17:56, 28 March 2024
975 × 492; 165 KB
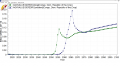
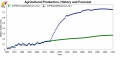 Agricultural Production, History and Forecast .png Norah.Shamin
17:54, 28 March 2024
975 × 484; 115 KB
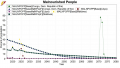
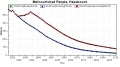
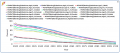
 Malnourished People; Congo Dem., Maldives, Libya, Bahamas Fixed Model.png Norah.Shamin
17:53, 28 March 2024
975 × 475; 125 KB
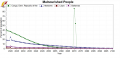
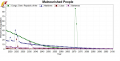 Malnourished People; Congo Dem., Maldives, Libya, Bahamas .png Norah.Shamin
17:52, 28 March 2024
975 × 495; 130 KB
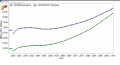
 AGXVALUEWorking(Congo, Dem. Republic of the, Crop) vs AGXVALUEDRCproblem (Congo, Dem. Republic of the, Crop).png Norah.Shamin
17:47, 28 March 2024
975 × 535; 117 KB

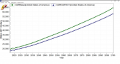
 INCOMELT190NBase(World) vs INCOMELT190NOrg(World).png Norah.Shamin
00:06, 27 March 2024
975 × 548; 131 KB
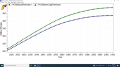
 POPMEDAGEBase(Syrian Arab Republic and United Arab Emirates) vs POPMEDAGEOrgPOP(Syrian Arab Republic and United Arab Emirates).png Norah.Shamin
00:00, 27 March 2024
975 × 549; 167 KB
 POPMEDAGEBase(Puerto Rico and Equatorial Guinea) vs POPMEDAGEOrgPOP(Puerto Rico and Equatorial Guinea).png Norah.Shamin
23:59, 26 March 2024
975 × 548; 155 KB
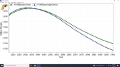
 POPMEDAGEBase(World) vs POPMEDAGEOrgPOP(World).png Norah.Shamin
23:57, 26 March 2024
975 × 549; 119 KB
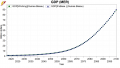
 GDPBase(United States of America) vs GDPGDP2011(United States of America).png Norah.Shamin
23:52, 26 March 2024
975 × 519; 117 KB
 INCOMELT190LNBase(World) vs INCOMELT190LNBaseOrg(World) .png Norah.Shamin
23:37, 26 March 2024
975 × 548; 129 KB
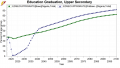
 Education Graduation, Gross, Upper Secondary .png Norah.Shamin
23:22, 26 March 2024
959 × 541; 118 KB
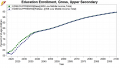
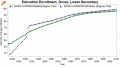 Education Enrollment, Gross, Lower Secondary .png Norah.Shamin
23:20, 26 March 2024
959 × 541; 120 KB
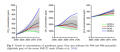 Trends in Concentrations of Greenhouses Gases .png Norah.Shamin
23:16, 26 March 2024
792 × 344; 142 KB
 SFINTLWARALL Working(Nigeria) - SFINTLWARALLWorking(Nigeria).png Norah.Shamin
22:44, 26 March 2024
975 × 431; 61 KB
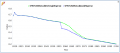
 Poverty $2.15 Percent of Population Forecast Graph .png Norah.Shamin
22:25, 26 March 2024
975 × 444; 72 KB

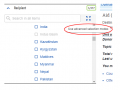


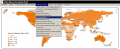

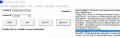
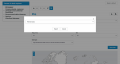
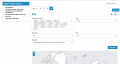
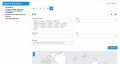
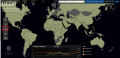
 Continent and Country selector Road Networks.png Greg.Gillen
17:46, 20 September 2023
855 × 483; 64 KB

- Error creating thumbnail: File with dimensions greater than 12.5 MP

- Error creating thumbnail: File with dimensions greater than 12.5 MP
- Error creating thumbnail: File with dimensions greater than 12.5 MP

- Error creating thumbnail: File with dimensions greater than 12.5 MP
- Error creating thumbnail: File with dimensions greater than 12.5 MP
- Error creating thumbnail: File with dimensions greater than 12.5 MP
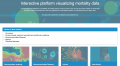
 Screenshot 2023-09-19 at 10.27.25 AM.png Tania.Blanga
16:27, 19 September 2023
2,880 × 1,566; 1.41 MB
 Screenshot 2023-09-19 at 10.22.37 AM.png Tania.Blanga
16:25, 19 September 2023
2,880 × 1,566; 1.43 MB


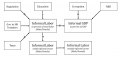
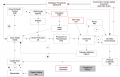

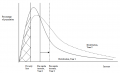
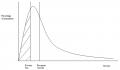
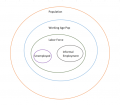 ED 12.14.1 Fig 2- Relationship among various labor measurements.png Julia.Detar
19:02, 6 July 2023
734 × 644; 105 KB
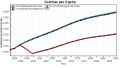
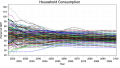 ED Section 4 Figure 4.12 Household consumption as percentage of GDP across countries Source- IFs version 7.95..png Julia.Detar
20:06, 7 June 2023
752 × 424; 270 KB
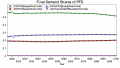 Figure 4.11 ED Section 4 Final demand shares of PFD-GDP, global Source- IFs version 7.95..png Julia.Detar
20:06, 7 June 2023
750 × 422; 68 KB
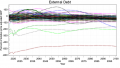 ED Section 4 Figure 4.10 External debt as percentage of GDP across countries Source- IFs version 7.95..png Julia.Detar
20:04, 7 June 2023
726 × 410; 169 KB
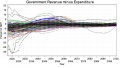 ED Section 4 Figure 4.9 Government revenues minus expenditures as percentage of GDP, countries Source- IFs version 7.95..png Julia.Detar
20:03, 7 June 2023
864 × 486; 223 KB
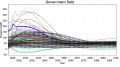 ED Section 4 Figure 4.8 Government debt as percentage of GDP across countries Source- IFs version 7.95..png Julia.Detar
20:02, 7 June 2023
812 × 456; 267 KB
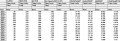
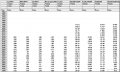 ED Section 4 Table 4.4 Final demand and international flow analysis of Yemen Source- IFs version 7.95..png Julia.Detar
20:00, 7 June 2023
864 × 518; 124 KB
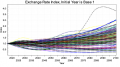 ED Section 4 Figure 4.7 Exchange rates of countries Source- IFs version 7.95..png Julia.Detar
20:00, 7 June 2023
726 × 408; 224 KB
 ED Section 4-Table 4.3 Final demand and international flow analysis of Timor-Leste Source- IFs version 7.95..png Julia.Detar
19:58, 7 June 2023
864 × 292; 89 KB
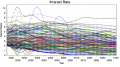 ED Section 4- Figure 4.6 Interest rate of countries Source- IFs version 7.95..png Julia.Detar
19:57, 7 June 2023
776 × 436; 410 KB
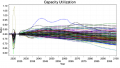 ED Section 4- Figure 4.5 Capacity utilization of countries Source- IFs version 7.95..png Julia.Detar
19:56, 7 June 2023
730 × 412; 196 KB
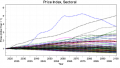 ED Section 4- Figure 4.4 Price indices of countries Source- IFs version 7.95..png Julia.Detar
19:54, 7 June 2023
706 × 398; 156 KB
 ED Section 4 Table 4.2 Final demand and international financial analysis of Sao Tome and Principe. Source- IFs version 7.95..png Julia.Detar
19:53, 7 June 2023
862 × 292; 91 KB
 Table 4.2 Final demand and international financial analysis of Sao Tome and Principe. Source- IFs version 7.95..png Julia.Detar
19:51, 7 June 2023
864 × 292; 91 KB
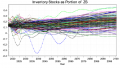 ED Section 4Figure 4.3 Inventory stocks as portion of gross production, all countries. Source- IFs version 7.95..png Julia.Detar
19:49, 7 June 2023
864 × 486; 327 KB
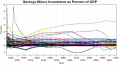
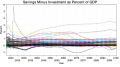 ED Section 4 Figure 4.2 Savings minus investment as a percent of GDP, all countries. Source- IFs version 7.95..png Julia.Detar
19:46, 7 June 2023
758 × 426; 156 KB
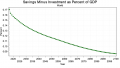 ED Section 4 Figure 4.1 Savings minus investment as a percent of GDP, global..png Julia.Detar
19:45, 7 June 2023
640 × 360; 39 KB
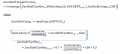
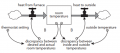
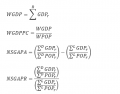

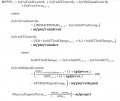
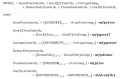
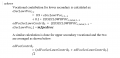
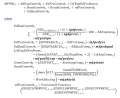
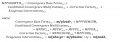
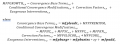

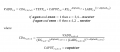


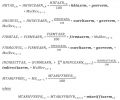
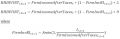

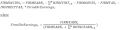
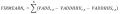

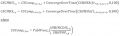
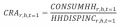
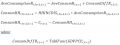


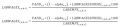
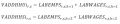
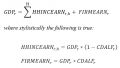


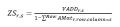
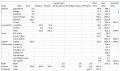
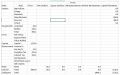
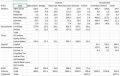
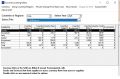
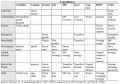
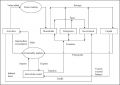


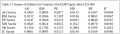
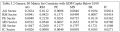
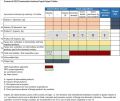
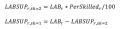
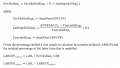
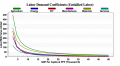
 Figure 6.5 Value added by unskilled labor as function of GDP per capita Source- Barry Hughes.png Julia.Detar
19:14, 10 May 2023
714 × 398; 82 KB
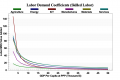
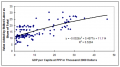 Figure 6.4 Value added by skilled labor as function of GDP per capita Source- Barry Hughes..png Julia.Detar
19:13, 10 May 2023
714 × 398; 86 KB
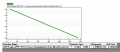
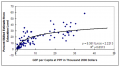 Figure 6.3 Percentage of population skilled as function of GDP per capita Source- Barry Hughes.png Julia.Detar
19:10, 10 May 2023
714 × 398; 81 KB
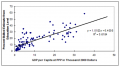 Figure 6.2 Percentage of population skilled as function of GDP per capita. Source- Barry Hughes..png Julia.Detar
19:09, 10 May 2023
714 × 398; 82 KB
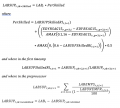


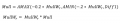


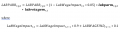


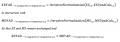
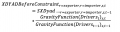
 Section 5 Equation 1 in 5.4.2.2 Basic Export calculation.png Julia.Detar
18:25, 8 May 2023
830 × 122; 23 KB
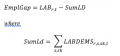
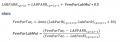
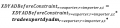 Section 5 Equation 3 in 5.4.2.1 Basic Export calculation.png Julia.Detar
18:23, 8 May 2023
690 × 160; 30 KB
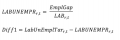
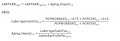
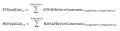
 Section 5 Equation 2 in 5.4.2.1 Basic Export calculation.png Julia.Detar
18:22, 8 May 2023
1,048 × 76; 17 KB
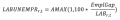
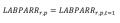
 Section 5 Equation 1 in 5.4.2.1 Basic Export calculation.png Julia.Detar
18:20, 8 May 2023
682 × 180; 34 KB
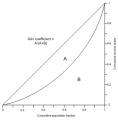
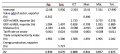 ED Section 5 Table 5.3 Coefficients of the estimated gravity model.png Julia.Detar
18:11, 8 May 2023
1,076 × 486; 89 KB


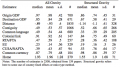 ED Section 5 Table 5.1 Variables often found in gravity models and median and mean coefficients.png Julia.Detar
17:51, 8 May 2023
594 × 334; 144 KB


 Index.php?title=File-FAOSTAT TCL AGGREGATION TABLE IMG 01.jpg.png Julia.Detar
23:50, 8 February 2023
1,204 × 1,398; 267 KB


_-_Guinea_Bissau.png)

_-_Niger.png)
.png)
_-_Low_Income.png)
_-_GDP_.png)


_vs_GOVCORRUPTGEMorg(World).png)
_vs_DEMOCPOLITYGEMorg(World).png)
_vs_GEMGEMorg(World).png)


_vs_AGXVALUEDRCproblem_(Congo,_Dem._Republic_of_the,_Crop).png)


_vs_INCOMELT190NOrg(World).png)
_vs_POPOrgPOP(China).png)
_vs_POPOrgPOP(Nigeria).png)
_vs_WPOP(OrgPOP).png)
_vs_POPMEDAGEOrgPOP(Syrian_Arab_Republic_and_United_Arab_Emirates).png)
_vs_POPMEDAGEOrgPOP(Puerto_Rico_and_Equatorial_Guinea).png)
_vs_POPMEDAGEOrgPOP(World).png)
_vs_GDPGDP2011(Japan).png)
_vs_GDPGDP2011(United_States_of_America).png)
_vs_WGDP(GDP2011).png)
_vs_TFRBaseOrg(China).png)
_vs_TFRBaseOrg(Somalia).png)
_vs_TFRBaseOrg(Chad).png)
_vs_TFRBaseOrg(World).png)
_vs_INCOMELT190LNBaseOrg(World)_.png)
_vs_POPBaseOrg(Pakistan).png)
_vs_POPBaseOrg(China).png)
_vs_WPOP(Base_Org).png)


_vs_WPOP(IFsBase8.17).png)
_vs_PopBase(World).png)
_-_SFINTLWARALLWorking(Nigeria).png)


.png)


.jpg)
.jpg)


.jpg)
.jpg)


