Gallery of new files
Jump to navigation
Jump to search
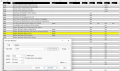
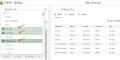
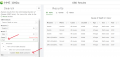
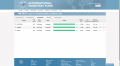
This special page shows the last uploaded files.

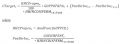

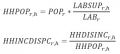
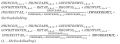
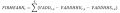
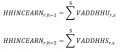
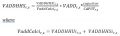
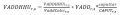
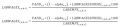
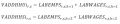
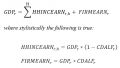

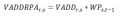
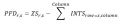
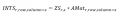
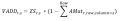
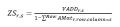
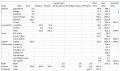
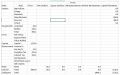
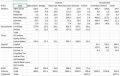
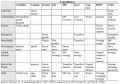
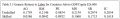
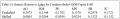
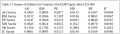
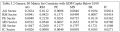
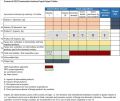
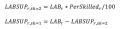
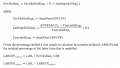
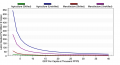
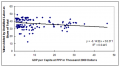 Figure 6.5 Value added by unskilled labor as function of GDP per capita Source- Barry Hughes.png Julia.Detar
19:14, 10 May 2023
714 × 398; 82 KB
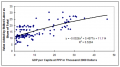 Figure 6.4 Value added by skilled labor as function of GDP per capita Source- Barry Hughes..png Julia.Detar
19:13, 10 May 2023
714 × 398; 86 KB
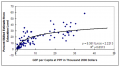 Figure 6.3 Percentage of population skilled as function of GDP per capita Source- Barry Hughes.png Julia.Detar
19:10, 10 May 2023
714 × 398; 81 KB
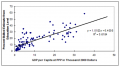 Figure 6.2 Percentage of population skilled as function of GDP per capita. Source- Barry Hughes..png Julia.Detar
19:09, 10 May 2023
714 × 398; 82 KB


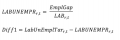
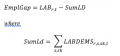


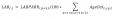

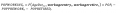

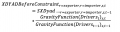
 Section 5 Equation 1 in 5.4.2.2 Basic Export calculation.png Julia.Detar
18:25, 8 May 2023
830 × 122; 23 KB
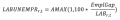
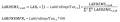
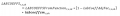
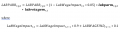
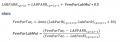
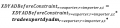 Section 5 Equation 3 in 5.4.2.1 Basic Export calculation.png Julia.Detar
18:23, 8 May 2023
690 × 160; 30 KB
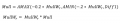
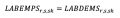
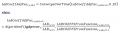
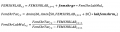
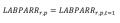
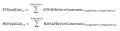
 Section 5 Equation 2 in 5.4.2.1 Basic Export calculation.png Julia.Detar
18:22, 8 May 2023
1,048 × 76; 17 KB
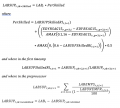
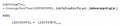
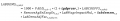
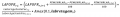
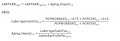
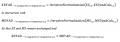
 Section 5 Equation 1 in 5.4.2.1 Basic Export calculation.png Julia.Detar
18:20, 8 May 2023
682 × 180; 34 KB
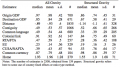
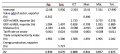 ED Section 5 Table 5.3 Coefficients of the estimated gravity model.png Julia.Detar
18:11, 8 May 2023
1,076 × 486; 89 KB


 ED Section 5 Table 5.1 Variables often found in gravity models and median and mean coefficients.png Julia.Detar
17:51, 8 May 2023
594 × 334; 144 KB


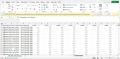
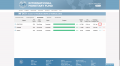
 Index.php?title=File-FAOSTAT TCL AGGREGATION TABLE IMG 01.jpg.png Julia.Detar
23:50, 8 February 2023
1,204 × 1,398; 267 KB


.jpg)
.jpg)


.jpg)
.jpg)


