Joint Monitoring Programme, WHO/UNICEF
Summary
The water and sanitation series is developed using data from the WHO/UNICEF Joint Monitoring Program for water supply and sanitation (JMP). The JMP reports country, regional and global estimates of progress on drinking water, sanitation and hygiene (WASH) since 2000.
The WSS JMP dataset provides substantial information on water, sanitation and hygiene, broken into national, urban and rural subgroups. Within these subgroups, global estimates are provided that show the proportion of a country's population using improved and unimproved access to water, sanitation and hygiene. For the water dataset, IFs draws primarily on...... For the sanitation dataset, IFs uses the sanitation estimates to break the data down into the proportion of population (%) and the amount of people within a population. To construct these data series, IFs draws primarily on the population served with improved sanitation, unimproved sanitation, other unimproved sanitation, shared sanitation, and open defication sanitation.
The most recent update was in Sept. 2024. There are 8 preprocessors and 100 non-preprocessors.
Tables In IFs
| Variable | Defintion | Ext Source Def | UsedInPreprocessor | UsedInPreprocessorFileName | Code In Source |
|---|---|---|---|---|---|
| WSSJMPSanitationTotalPopImproved | Total population served with Improved Sanitation | Ensure hygenic separation of human excreta from human contact. They include: 1) Flush/pour flush to (piped sewer system septic tank or pit latrine) 2) Ventilated improved pit (VIP) latrine 3) Pit latrine with slab 4) Composing toilet | 0 | san_bas_n_pop | |
| WSSJMPSanitationTotalPopOpenDefecation | Total population served with Open Defecation Sanitation | Likely to ensure hygenic separation of human excreta from human contact. They include: 1) Flush/pour flush to (piped sewer system septic tank or pit latrine) 2) Ventilated improved pit (VIP) latrine 3) Pit latrine with slab 4) Composing toilet | 0 | san_od_n_pop | |
| WSSJMPSanitationTotalPopOtherUnimproved | Total population with Other Unimproved Sanitation | do not ensure hygenic separation of human excreta from human contact. Unimproved facilities include pit latrines without a slab or platfor, hanging latrines or bucket latrines | 0 | san_unimp_n_pop | |
| WSSJMPSanitationTotalPopShared | Total population served with Shared Sanitation | Sanitation facilities of an otherwise acceptable type shared between two or more households. Only facilities that are not shared or not public are considered improved | 0 | san_lim_n_pop | |
| WSSJMPSanitationTotalPopUnimproved | Total population served with Unimproved Sanitation. Total Unimproved Sanitation is the sum of Open Defecation, Other Unimproved, and Shared sanitation access. | do not ensure hygenic separation of human excreta from human contact. Unimproved facilities include pit latrines without a slab or platform, hanging latrines or bucket latrines | 0 | san_UnImp_n_pop | |
| WSSJMPWaterUrbanPopSurface | Urban population with Surface Water | River, dam, lake, pond, stream, canal, irrigation channels. | 0 | wat_sur_u_pop | |
| WSSJMPWaterUrbanPopImproved | Urban population served with Improved Water | Piped water on premises/other improved drinking water | 0 | wat_imp_u_pop | |
| WSSJMPSanitationRuralPopImproved | Rural population served with Improved Sanitation | Likely to ensure hygenic separation of human excreta from human contact. They include: 1) Flush/pour flush to (piped sewer system septic tank or pit latrine) 2) Ventilated improved pit (VIP) latrine 3) Pit latrine with slab 4) Composing toilet | 0 | san_bas_r_pop | |
| WSSJMPSanitationRuralPopOpenDefecation | Rural population served with Open Defecation Sanitation | when human feces are disposed of in fields, forests, bushes, open bodies of water, beaches or other open spaces or disposed of with solid waste | 0 | san_od_r_pop | |
| WSSJMPSanitationRuralPopOtherUnimproved | Rural population with Other Unimproved Sanitation | do not ensure hygenic separation of human excreta from human contact. Unimproved facilities include pit latrines without a slab or platfor, hanging latrines or bucket latrines | 0 | san_unimp_r_pop | |
| WSSJMPSanitationRuralPopShared | Rural population served with Shared Sanitation | Sanitation facilities of an otherwise acceptable type shared between two or more households. Only facilities that are not shared or not public are considered improved | 0 | san_lim_r_pop | |
| WSSJMPSanitationRuralPopUnimproved | Rural population served with Unimproved Sanitation. Total Unimproved Sanitation is the sum of Open Defecation, Other Unimproved, and Shared sanitation access. | do not ensure hygenic separation of human excreta from human contact. Unimproved facilities include pit latrines without a slab or platform, hanging latrines or bucket latrines | 0 | san_UnImp_r_pop | |
| WSSJMPSanitationUrbanPopImproved | Urban population served with Improved Sanitation | Likely to ensure hygenic separation of human excreta from human contact. They include: 1) Flush/pour flush to (piped sewer system septic tank or pit latrine) 2) Ventilated improved pit (VIP) latrine 3) Pit latrine with slab 4) Composing toilet | 0 | san_bas_u_pop | |
| WSSJMPSanitationUrbanPopOpenDefecation | Urban population served with Open Defecation Sanitation | when human feces are disposed of in fields, forests, bushes, open bodies of water, beaches or other open spaces or disposed of with solid waste | 0 | san_od_u_pop | |
| WSSJMPSanitationUrbanPopOtherUnimproved | Urban population with Other Unimproved Sanitation | do not ensure hygenic separation of human excreta from human contact. Unimproved facilities include pit latrines without a slab or platfor, hanging latrines or bucket latrines | 0 | san_unimp_u_pop | |
| WSSJMPWaterRuralPopImproved | Rural population served with Improved Water | Piped water on premises/other improved drinking water | 0 | wat_imp_r_pop | |
| WSSJMPWaterRuralPopOtherImproved | Rural population served with Other Improved Water | Public taps or standpipes, tube wells or boreholes, protected dug wells, protected springs, rainwater collection | 0 | wat_imp_r_pop - wat_pip_r_pop | |
| WSSJMPWaterRuralPopOtherUnimproved | Rural population with Other Unimproved Water | Unprotected dug well, unprotected spring, cart with small tank/drum, tanker truck, bottled water (Bottled water is considered 'improved' for drinking only when the household used an improved source for cooking and personal hygiene) | 0 | wat_unimp_r_pop | |
| WSSJMPWaterRuralPopSurface | Rural population with Surface Water | River, dam, lake, pond, stream, canal, irrigation channels. | 0 | wat_sur_r_pop | |
| WSSJMPWaterRuralPopUnimproved | Rural population served with Unimproved Water. Total Unimproved Water is the sum of Surface and Other Unimproved water access. | Unimproved drinking water sources/surface drinking water sources | 0 | wat_UnImp_r_pop | |
| WSSJMPWaterTotalPopOtherUnimproved | Total population served with Unimproved Water | Unimproved drinking water sources/surface drinking water sources | 0 | wat_unimp_n_pop | |
| WSSJMPWaterTotalPopPiped | Total population served with Piped Water | Piped household water connection located inside the user's dwelling, plot or yard | 0 | wat_pip_n_pop | |
| WSSJMPWaterTotalPopSurface | Total population with Surface Water | River, dam, lake, pond, stream, canal, irrigation channels. | 0 | wat_sur_n_pop | |
| WSSJMPWaterTotalPopUnimproved | Proportion of total population served with Unimproved Water (%). Total Unimproved Water is the sum of Surface and Other Unimproved water access. | Unimproved drinking water sources/surface drinking water sources | 0 | wat_UnImp_n_pop | |
| WSSJMPWaterUrban%Improved | Proportion of Urban population served with Improved Water (%) | Piped water on premises/other improved drinking water | 0 | wat_imp_u | |
| WSSJMPWaterUrbanPopOtherImproved | Urban population served with Other Improved Water | Public taps or standpipes, tube wells or boreholes, protected dug wells, protected springs, rainwater collection | 0 | wat_imp_u_pop - wat_pip_u_pop | |
| WSSJMPWaterUrbanPopOtherUnimproved | Urban population with Other Unimproved Water | Unprotected dug well, unprotected spring, cart with small tank/drum, tanker truck, bottled water (Bottled water is considered 'improved' for drinking only when the household used an improved source for cooking and personal hygiene) | 0 | wat_unimp_u_pop | |
| WSSJMPWaterUrbanPopPiped | Urban population served with Piped Water | Piped household water connection located inside the user's dwelling, plot or yard | 0 | wat_pip_u_pop | |
| WSSJMPWaterUrbanPopUnimproved | Urban population served with Unimproved Water. Total Unimproved Water is the sum of Surface and Other Unimproved water access. | Unimproved drinking water sources/surface drinking water sources | 0 | wat_UnImp_u_pop | |
| WSSJMPSanitationUrbanPopShared | Urban population served with Shared Sanitation | Sanitation facilities of an otherwise acceptable type shared between two or more households. Only facilities that are not shared or not public are considered improved | 0 | san_lim_u_pop | |
| WSSJMPSanitationUrbanPopUnimproved | Urban population served with Unimproved Sanitation. Total Unimproved Sanitation is the sum of Open Defecation, Other Unimproved, and Shared sanitation access. | do not ensure hygenic separation of human excreta from human contact. Unimproved facilities include pit latrines without a slab or platform, hanging latrines or bucket latrines | 0 | san_UnImp_u_pop | |
| WSSJMPWaterRural%Improved | Proportion of Rural population served with Improved Water (%) | Piped water on premises/other improved drinking water | 0 | wat_imp_r | |
| WSSJMPWaterRuralPopPiped | Rural population served with Piped Water | Piped household water connection located inside the user's dwelling, plot or yard | 0 | wat_pip_r_pop | |
| WSSJMPWaterTotal%Improved | Proportion of Total population served with Improved Water (%) | Piped water on premises/other improved drinking water | 0 | wat_imp_n | |
| WSSJMPWaterTotalPopImproved | Total population served with Improved Water | Piped water on premises/other improved drinking water | 0 | wat_imp_n_pop | |
| WSSJMPWaterTotalPopOtherImproved | Total population served with Other Improved Water | Public taps or standpipes, tube wells or boreholes, protected dug wells, protected springs, rainwater collection | 0 | wat_imp_n_pop - wat_pip_n_pop | |
| WSSJMPSanitationRural%AtLeastBasic | Proportion of Rural population served with at least basic facilities (%) | WSSJMPSanitationRural%SafelyManaged + WSSJMPSanitationRural%Basic | 0 | ||
| WSSJMPSanitationRural%Basic | Proportion of Rural population served with basic but not safely managed facilities (%) | Use of improved facilities which are not shared with other households | 0 | ||
| WSSJMPSanitationRural%Improved | Proportion of Rural population served with improved facilities (%), 3-ladder system | Improved facilities in the old 3-ladder system equals to At Least Basic in the new 5-ladder system | 0 | ||
| WSSJMPSanitationRural%Limited | Proportion of Rural population served with limited facilities (%) | Use of improved facilities shared between two or more households | 0 | ||
| WSSJMPSanitationRural%OpenDefecation | Proportion of Rural population served with open defecation facilities (%) | Disposal of human faeces in fields, forests, bushes, open bodies of water, beaches and other open spaces or with solid waste | 0 | ||
| WSSJMPSanitationRural%OtherUnimproved | Proportion of Rural population served with other unimproved facilities (%), 3-ladder system | OtherUnimproved facilities in the old 3-ladder system equals to Unimproved in the new 5-ladder system | 0 | ||
| WSSJMPSanitationRural%SafelyManaged | Proportion of Rural population served with safely managed facilities (%) | Use of improved facilities that are not shared with other households and where excreta are safely disposed of in situ or removed and treated offsite | 0 | ||
| WSSJMPSanitationRural%Shared | Proportion of Rural population served with shared facilities (%), 3-ladder system | Shared facilities in the old 3-ladder system equals to Limited in the new 5-ladder system | 0 | ||
| WSSJMPSanitationRural%SMDisposedInsitu | Proportion of Rural population served with safely managed facilities (%) that are disposed in situ | Safely managed = disposed in situ + emptied and treated + wastewater and treated | 0 | ||
| WSSJMPSanitationRural%SMEmpTreated | Proportion of Rural population served with safely managed facilities (%) that are emptied and treated | Safely managed = disposed in situ + emptied and treated + wastewater and treated | 0 | ||
| WSSJMPSanitationRural%SMWastewaterTreated | Proportion of Rural population served with safely managed facilities (%) that are wastewater treated | Safely managed = disposed in situ + emptied and treated + wastewater and treated | 0 | ||
| WSSJMPSanitationRural%Unimproved | Proportion of Rural population served with unimproved facilities (%) | Use of pit latrines without a slab or platform, hanging latrines or bucket latrines | 0 | ||
| WSSJMPSanitationTotal%AtLeastBasic | Proportion of Total population served with at least basic facilities (%) | WSSJMPSanitationTotal%SafelyManaged + WSSJMPSanitationTotal%Basic | 0 | ||
| WSSJMPSanitationTotal%Basic | Proportion of total population served with basic but not safely managed facilities (%) | Use of improved facilities which are not shared with other households | 0 | ||
| WSSJMPSanitationTotal%Improved | Proportion of Total population served with improved facilities (%), 3-ladder system | Improved facilities in the old 3-ladder system equals to At Least Basic in the new 5-ladder system | 1 | INFRASTRUCTURE | |
| WSSJMPSanitationTotal%Limited | Proportion of Total population served with limited facilities (%) | Use of improved facilities shared between two or more households | 0 | ||
| WSSJMPSanitationTotal%OpenDefecation | Proportion of Total population served with open defecation facilities (%) | Disposal of human faeces in fields, forests, bushes, open bodies of water, beaches and other open spaces or with solid waste | 1 | ECONOMY, INFRASTRUCTURE | |
| WSSJMPSanitationTotal%OtherUnimproved | Proportion of Total population served with other unimproved facilities (%), 3-ladder system | OtherUnimproved facilities in the old 3-ladder system equals to Unimproved in the new 5-ladder system | 1 | ECONOMY, INFRASTRUCTURE | |
| WSSJMPSanitationTotal%SafelyManaged | Proportion of Total population served with safely managed facilities (%) | Use of improved facilities that are not shared with other households and where excreta are safely disposed of in situ or removed and treated offsite | 0 | ||
| WSSJMPSanitationTotal%Shared | Proportion of Total population served with shared facilities (%), 3-ladder system | Shared facilities in the old 3-ladder system equals to Limited in the new 5-ladder system | 1 | INFRASTRUCTURE | |
| WSSJMPSanitationTotal%SMDisposedInsitu | Proportion of Total population served with safely managed facilities (%) that are disposed in situ | Safely managed = disposed in situ + emptied and treated + wastewater and treated | 0 | ||
| WSSJMPSanitationTotal%SMEmpTreated | Proportion of Total population served with safely managed facilities (%) that are emptied and treated | Safely managed = disposed in situ + emptied and treated + wastewater and treated | 0 | ||
| WSSJMPSanitationTotal%SMWastewaterTreated | Proportion of Total population served with safely managed facilities (%) that are wastewater treated | Safely managed = disposed in situ + emptied and treated + wastewater and treated | 0 | ||
| WSSJMPSanitationTotal%Unimproved | Proportion of Total population served with unimproved facilities (%) | Use of pit latrines without a slab or platform, hanging latrines or bucket latrines | 0 | ||
| WSSJMPSanitationUrban%AtLeastBasic | Proportion of Urban population served with at least basic facilities (%) | WSSJMPSanitationUrban%SafelyManaged + WSSJMPSanitationUrban%Basic | 0 | ||
| WSSJMPSanitationUrban%Basic | Proportion of Urban population served with basic but not safely managed facilities (%) | Use of improved facilities which are not shared with other households | 0 | ||
| WSSJMPSanitationUrban%Improved | Proportion of Urban population served with improved facilities (%), 3-ladder system | Improved facilities in the old 3-ladder system equals to At Least Basic in the new 5-ladder system | 0 | ||
| WSSJMPSanitationUrban%Limited | Proportion of Urban population served with limited facilities (%) | Use of improved facilities shared between two or more households | 0 | ||
| WSSJMPSanitationUrban%OpenDefecation | Proportion of Urban population served with open defecation facilities (%) | Disposal of human faeces in fields, forests, bushes, open bodies of water, beaches and other open spaces or with solid waste | 0 | ||
| WSSJMPSanitationUrban%OtherUnimproved | Proportion of Urban population served with other unimproved facilities (%), 3-ladder system | OtherUnimproved facilities in the old 3-ladder system equals to Unimproved in the new 5-ladder system | 0 | ||
| WSSJMPSanitationUrban%SafelyManaged | Proportion of Urban population served with safely managed facilities (%) | Use of improved facilities that are not shared with other households and where excreta are safely disposed of in situ or removed and treated offsite | 0 | ||
| WSSJMPSanitationUrban%Shared | Proportion of Urban population served with shared facilities (%), 3-ladder system | Shared facilities in the old 3-ladder system equals to Limited in the new 5-ladder system | 0 | ||
| WSSJMPSanitationUrban%SMDisposedInsitu | Proportion of Urban population served with safely managed facilities (%) that are disposed in situ | Safely managed = disposed in situ + emptied and treated + wastewater and treated | 0 | ||
| WSSJMPSanitationUrban%SMEmpTreated | Proportion of Urban population served with safely managed facilities (%) that are emptied and treated | Safely managed = disposed in situ + emptied and treated + wastewater and treated | 0 | ||
| WSSJMPSanitationUrban%SMWastewaterTreated | Proportion of Urban population served with safely managed facilities (%) that are wastewater treated | Safely managed = disposed in situ + emptied and treated + wastewater and treated | 0 | ||
| WSSJMPSanitationUrban%Unimproved | Proportion of Urban population served with unimproved facilities (%) | Use of pit latrines without a slab or platform, hanging latrines or bucket latrines | 0 | ||
| WSSJMPWaterRural%AtLeastBasic | Proportion of Rural population served with at least basic drinking water (%) | WSSJMPWaterRural%SafelyManaged + WSSJMPWaterRural%Basic | 0 | ||
| WSSJMPWaterRural%Basic | Proportion of Rural population served with basic but not safely managed drinking water (%) | Drinking water from an improved source, provided collection time is not more than 30 minutes for a roundtrip including queuing | 0 | ||
| WSSJMPWaterRural%Limited | Proportion of Rural population served with limited drinking water (%) | Drinking water from an improved source for which collection time exceeds 30 minutes for a roundtrip including queuing | 0 | ||
| WSSJMPWaterRural%OtherImproved | Proportion of Rural population served with other improved drinking water (%), old 3-ladder system | In the old 3-ladder system, other improved means improved drinking water that is not piped | 0 | ||
| WSSJMPWaterRural%OtherUnimproved | Proportion of Rural population served with other unimproved drinking water (%), old 3-ladder system | In the old 3-ladder system, other unimproved means unimproved drinking water in the new 5-ladder system | 0 | ||
| WSSJMPWaterRural%Piped | Proportion of Rural population served with piped drinking water (%), old 3-ladder system | In the old 3-ladder system, this means improved drinking water that is piped | 0 | ||
| WSSJMPWaterRural%SafelyManaged | Proportion of Rural population served with safely managed drinking water (%) | From an improved water source that is accessible on premises, available when needed and free from faecal and priority chemical contamination | 0 | ||
| WSSJMPWaterRural%SMAsNeeded | Proportion of Rural population served with available when needed improved drinking water (%) | From an improved water source that is vailable when needed | 0 | ||
| WSSJMPWaterRural%SMNotContam | Proportion of Rural population served with free from contamination improved drinking water (%) | From an improved water source that is free from faecal and priority chemical contamination | 0 | ||
| WSSJMPWaterRural%SMOnPremise | Proportion of Rural population served with accessible on premises improved drinking water (%) | From an improved water source that is accessible on premises | 0 | ||
| WSSJMPWaterRural%Surface | Proportion of Rural population served with surface drinking water (%) | Drinking water directly from a river, dam, lake, pond, stream, canal or irrigation canal | 0 | ||
| WSSJMPWaterRural%Unimproved | Proportion of Rural population served with unimproved drinking water (%) | Drinking water from an unprotected dug well or unprotected spring | 0 | ||
| WSSJMPWaterTotal%AtLeastBasic | Proportion of Total population served with at least basic drinking water (%) | WSSJMPWaterTotal%SafelyManaged + WSSJMPWaterTotal%Basic | 0 | ||
| WSSJMPWaterTotal%Basic | Proportion of Total population served with basic but not safely managed drinking water (%) | Drinking water from an improved source, provided collection time is not more than 30 minutes for a roundtrip including queuing | 0 | ||
| WSSJMPWaterTotal%Limited | Proportion of Total population served with limited drinking water (%) | Drinking water from an improved source for which collection time exceeds 30 minutes for a roundtrip including queuing | 0 | ||
| WSSJMPWaterTotal%OtherImproved | Proportion of Total population served with other improved drinking water (%), old 3-ladder system | In the old 3-ladder system, other improved means improved drinking water that is not piped | 1 | INFRASTRUCTURE | |
| WSSJMPWaterTotal%OtherUnimproved | Proportion of Total population served with other unimproved drinking water (%), old 3-ladder system | In the old 3-ladder system, other unimproved means unimproved drinking water in the new 5-ladder system | 1 | ECONOMY, INFRASTRUCTURE | |
| WSSJMPWaterTotal%Piped | Proportion of Total population served with piped drinking water (%), old 3-ladder system | In the old 3-ladder system, this means improved drinking water that is piped | 1 | INFRASTRUCTURE | |
| WSSJMPWaterTotal%SafelyManaged | Proportion of Total population served with safely managed drinking water (%) | From an improved water source that is accessible on premises, available when needed and free from faecal and priority chemical contamination | 0 | ||
| WSSJMPWaterTotal%SMAsNeeded | Proportion of Total population served with available when needed improved drinking water (%) | From an improved water source that is vailable when needed | 0 | ||
| WSSJMPWaterTotal%SMNotContam | Proportion of Total population served with free from contamination improved drinking water (%) | From an improved water source that is free from faecal and priority chemical contamination | 0 | ||
| WSSJMPWaterTotal%SMOnPremise | Proportion of Total population served with accessible on premises improved drinking water (%) | From an improved water source that is accessible on premises | 0 | ||
| WSSJMPWaterTotal%Surface | Proportion of Total population served with surface drinking water (%) | Drinking water directly from a river, dam, lake, pond, stream, canal or irrigation canal | 1 | ECONOMY, INFRASTRUCTURE | |
| WSSJMPWaterTotal%Unimproved | Proportion of Total population served with unimproved drinking water (%) | Drinking water from an unprotected dug well or unprotected spring | 0 | ||
| WSSJMPWaterUrban%AtLeastBasic | Proportion of Urban population served with at least basic drinking water (%) | WSSJMPWaterUrban%SafelyManaged + WSSJMPWaterUrban%Basic | 0 | ||
| WSSJMPWaterUrban%Basic | Proportion of Urban population served with basic but not safely managed drinking water (%) | Drinking water from an improved source, provided collection time is not more than 30 minutes for a roundtrip including queuing | 0 | ||
| WSSJMPWaterUrban%Limited | Proportion of Urban population served with limited drinking water (%) | Drinking water from an improved source for which collection time exceeds 30 minutes for a roundtrip including queuing | 0 | ||
| WSSJMPWaterUrban%OtherImproved | Proportion of Urban population served with other improved drinking water (%), old 3-ladder system | In the old 3-ladder system, other improved means improved drinking water that is not piped | 0 | ||
| WSSJMPWaterUrban%OtherUnimproved | Proportion of Urban population served with other unimproved drinking water (%), old 3-ladder system | In the old 3-ladder system, other unimproved means unimproved drinking water in the new 5-ladder system | 0 | ||
| WSSJMPWaterUrban%Piped | Proportion of Urban population served with piped drinking water (%), old 3-ladder system | In the old 3-ladder system, this means improved drinking water that is piped | 0 | ||
| WSSJMPWaterUrban%SafelyManaged | Proportion of Urban population served with safely managed drinking water (%) | From an improved water source that is accessible on premises, available when needed and free from faecal and priority chemical contamination | 0 | ||
| WSSJMPWaterUrban%SMAsNeeded | Proportion of Urban population served with available when needed improved drinking water (%) | From an improved water source that is vailable when needed | 0 | ||
| WSSJMPWaterUrban%SMNotContam | Proportion of Urban population served with free from contamination improved drinking water (%) | From an improved water source that is free from faecal and priority chemical contamination | 0 | ||
| WSSJMPWaterUrban%SMOnPremise | Proportion of Urban population served with accessible on premises improved drinking water (%) | From an improved water source that is accessible on premises | 0 | ||
| WSSJMPWaterUrban%Surface | Proportion of Urban population served with surface drinking water (%) | Drinking water directly from a river, dam, lake, pond, stream, canal or irrigation canal | 0 | ||
| WSSJMPWaterUrban%Unimproved | Proportion of Urban population served with unimproved drinking water (%) | Drinking water from an unprotected dug well or unprotected spring | 0 |
Data Pulling Instructions: Downloading Data
- Go to https://washdata.org/data/downloads#WLD
- Detailed instructions on how to find the "Household" here
- Click "World file" under "Household" to download all the data.

- Open the downloaded file. "Enable Editing". Hover the mouse to the tab and right-click. The file will show several options:

- Click "Unhide", and a view will pop up.
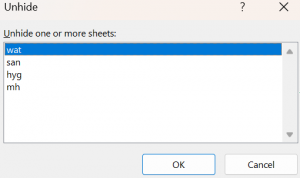
- Press "ctrl" and select "wat" and "san". Click "OK".
- In these 2 tabs, you may find the columns we will use in "Code in Source" listed below.


Data Pulling Instructions: Importing Water Data into IFs
This section explains the methodology to be followed when importing WSS JMP water supply data into IFs. It also describes certain problems that a user might face in interpreting and understanding the data.
Source: Water supply data is published by the WHO/UNICEF JMP. The data is available at the website https://washdata.org/data/downloads#WLD
Country List to be Used: WSS JMP
Ladder and Related code in downloaded data:
IFs include both old and new water systems from WSS JMP. The new system is developed based on the old system, thus, you can find some overlapping variable labels between two systems. Below we listed a mapping between the ladders used in IFs and those being used in WSS JMP.
New system-
| TAB | Ladder in IFs | WSS JMP Variable |
| wat | SafelyManaged | sm |
| wat | AtLeastBasic | basal |
| wat | Basic | basal - sm |
| wat | Limited | lim |
| wat | Unimproved | unimp |
| wat | Surface | ns |
In which, SafelyManaged is the intersaction of following 3 categories (most of time the result is just the minimal among three)
- SMOnPremise = imp_prem; used to be premises
- SMAsNeeded = imp_av; used to be available
- SMNotContam = imp_qual; used to be quality
You can also observe that unimp + imp + ns = 100%, where imp = basal + lim = pip + imp_npip
Old system-
| TAB | Ladder in IFs | WSS JMP Variable |
| wat | OtherImproved | imp_npip |
| wat | Piped | pip |
| wat | OtherUnimproved | unimp |
| wat | Surface | ns |
Notes:
- All indicators use suffices to indicate regional levels, with
- _t means national indicators (Total%); used to be _n being national
- _r means Rural%
- _u means Urban%
- Prefix pop_ means Population in Thousands
- prop_u is the percentage of urban population in total population.
- 100 - prop_u is the percentage of rural population in total population.
- The rest of data are in percentages
Thus, under the raw data (the Excel file downloaded following the instruction above), the TAB column in the mapping above represents the name of the spreadsheet, while the other two columns represent the one-to-one mapping between IFs data table name and WSS JMP variable name. For example, table SeriesWSSJMPWaterTotal%SafelyManaged from IFsHistSeries equals to the variable wat_sm_t. Same rules apply to the sanitation data introduced below.
Data Pulling Instructions: Importing Sanitation Data into IFs
This section explains the methodology to be followed when importing WSS JMP sanitation data into IFs. It also describes certain problems that a user might face in interpreting and understanding the data.
Source: Sanitation data is published by the WHO/UNICEF JMP. The data is available at the website https://washdata.org/data/household#!/table?geo0=region&geo1=sdg.
Country List to be Used: WSS JMP
Ladder and Related code in downloaded data:
IFs include both old and new sanitation systems from WSS JMP. The new system is developed based on the old system, thus, you can find some overlapping variable labels between two systems. Below we listed a mapping between the ladders used in IFs and those being used in WSS JMP.
New system-
| TAB | Ladder in IFs | WSS JMP Variable |
| san | AtLeastBasic | basal |
| san | Basic | basal - sm |
| san | Limited | lim |
| san | OpenDefecation | ns |
| san | OtherUnimproved | unimp |
In which, SafelyManaged is the union of following 3 categories (normally adding three together)
- SMDisposedInsitu = sdo_sm; Disposed in situ
- SMEmpTreated = fst_sm; Emptied and treated
- SMWastewaterTreated = sew_sm; Wastewater treated
You can also find that imp + unimp + ns = 100, where imp = basal + lim; Additionally, Improved (imp) is the union of following 3 categories (normally adding three together, if all 3 exist)
- Latrines and other = othimp; used to be lat
- Septic tanks = sep
- Sewer connections = sew
Old system-
| TAB | Ladder in IFs | WSS JMP Variable |
| san | Improved | basal |
| san | Shared | lim |
| san | OtherUnimproved | unimp |
| san | OpenDefecation | ns |
Hence, the table SeriesWSSJMPSanitationTotal%SafelyManaged from IFsHistSeries is the equivalent to the variable san_sm_t from WSS JMP.