Economy Data: Difference between revisions
AltheaDitter (talk | contribs) No edit summary |
AltheaDitter (talk | contribs) No edit summary |
||
| Line 33: | Line 33: | ||
= GovtHI%GDP = | = GovtHI%GDP = | ||
This series was calculated using data that was sourced from the [[China_Statistical_Yearbooks|China_Statistical_Yearbooks]] 2008-2016. The data can be found in Chapter 7 ''Government Finance'' Table 6 ''General Public Expenditure by Region'' under the column headed as ''Expenditure for Medical and Health Care, Family Planning''. The series is calculated by dividing the health care expenditure data by GDP and then multiplied by 100. There is more historical data available by it is not used because the | This series was calculated using data that was sourced from the [[China_Statistical_Yearbooks|China_Statistical_Yearbooks]] 2008-2016. The data can be found in Chapter 7 ''Government Finance'' Table 6 ''General Public Expenditure by Region'' under the column headed as ''Expenditure for Medical and Health Care, Family Planning''. The series is calculated by dividing the health care expenditure data by GDP and then multiplied by 100. There is more historical data available by it is not used because the GDP data from the [[China_Statistical_Yearbooks|China_Statistical_Yearbooks]] published before 2011 is questionable and should not be used. | ||
= HouseCon%GDP = | = HouseCon%GDP = | ||
HouseCon%GDP is calculated using data from the [[China_Statistical_Yearbooks|China_Statistical_Yearbooks]] 2008-2016. The data came from Chapter 3 ''National Accounts ''Table 17 ''Final Consumption Expenditure and Its Composition by Region'' under the column headed ''Household Consumption.'' This data was divided by GDP and multiplied by 100 to generate the final series. There is more historical data available, but the [[China's_Provincial_GDP2011|GDP]] data published prior to 2011 is questionable and should not be used. | HouseCon%GDP is calculated using data from the [[China_Statistical_Yearbooks|China_Statistical_Yearbooks]] 2008-2016. The data came from Chapter 3 ''National Accounts ''Table 17 ''Final Consumption Expenditure and Its Composition by Region'' under the column headed ''Household Consumption.'' This data was divided by GDP and multiplied by 100 to generate the final series. There is more historical data available, but the [[China's_Provincial_GDP2011|GDP]] data published prior to 2011 is questionable and should not be used. | ||
Revision as of 17:54, 17 April 2017
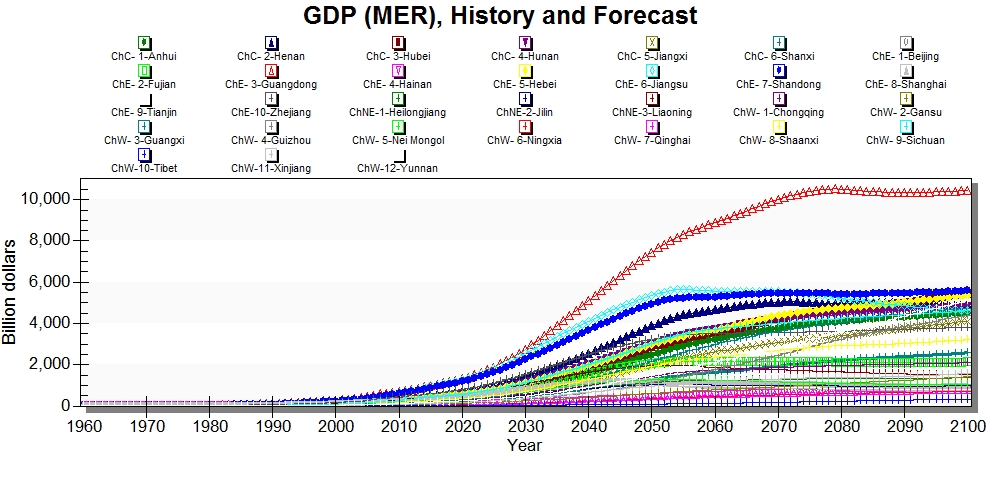
GDP2011
The GDP2011 series came from the China Statistical Yearbooks 2012-2016 from Chapter 3 National Accounts in Table 9 Gross Regional Product and Indices, and this series runs from 2007-2015. The series is in a 2010 base year, not a 2011 base year. Future users may desire rebasing the data to 2011 yuan using a China deflator. Although IFs forecasts GDP in billions of US$, the data used is in hundred million yuan. To convert the data into US$, the box ApplyMultAll is checked in the data dictionary. This function normalizes the provincial data to the full-186 model data.
It is also important to note that in provincial models, the model will not breakout without having additional year columns in the access table. In this case, the historical data begins in 2007, but the year columns in the Access table begin in 1960 and are left blank. This is true for all provincial models in IFs, the GDP series needs year columns back to 1960 even if there is not data available back to 1960. Moreover, if there are any null values in the table, ApplyMultAll must be selected for the model to breakout because the model requires there to be data for all province/years.
There is more historical GDP data available in the China Statistical Yearbooks, but those previous years were chosen to be omitted due to their varying base years. The possibility of taking previous years of data and using China's GDP deflator to change the base year, was considered. Unfortunately, historical data changes in China_Statistical_Yearbooks from year to year making proper estimation difficult. The base year is documented in the notes of each China Statistical Yearbook, but it did not appear to always be correct. An attempt was made to rebase the data to a proper base year and the data did not look right in some years, which suggested that the advertised base year was not always correct. Due to these inconsistencies, the older historical data was not included in the current GDP2011 series.
In earlier iterations of the China provincial model the GDP2011 series ran from 1960-2013, but there were some problems with this data. First the source was not documented, but it appears that the data in part came from the China_Statistical_Yearbooks. The data was not able to be completely verified because data back to 1960 was not found. What was verifiable, showed that multiple base years were blended together for the series. Moreover, the China_Statistical_Yearbooks appear to have had provincial data improperly sorted and reported in some editions 2005 base year data; some provinces look as though their data was swapped. This error looked like a sorting error, where provinces with names that are near each other alphabetically had their data swapped for a few years. Due to these uncertainties, the current GDP series with only 2010 base year data is in use.
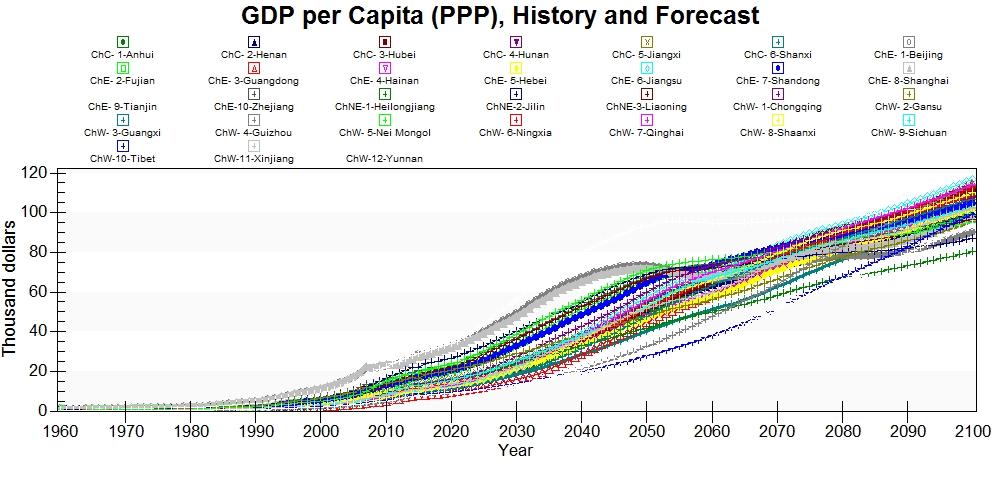
GDP2011PCPPP
The data for this series is not in PPP, but rather is normalized into PPP using ApplyMultAll. The series was calculated using the GDP2011 series and population data from the China Statistical Yearbooks from 2012-2016.
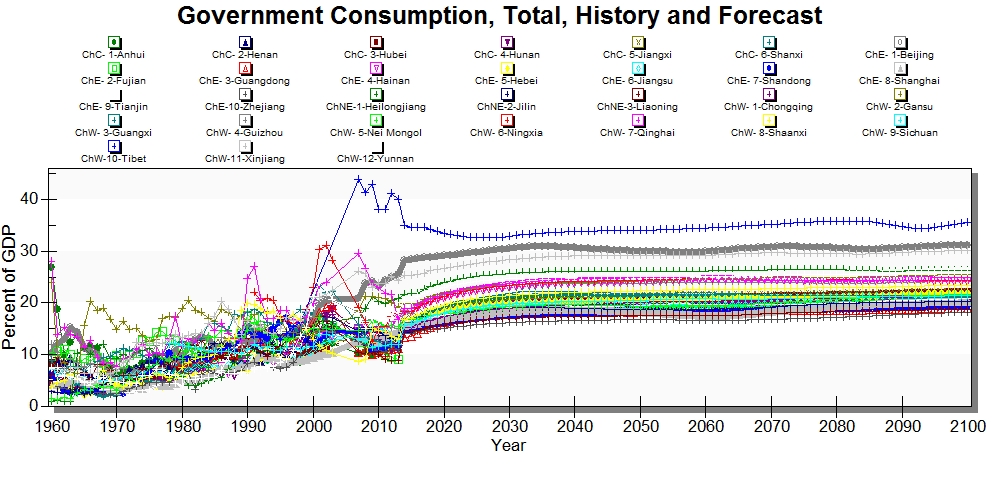
GovCon%GDP
Government Consumption as a percent of GDP is a series that was blended using two different data sources that both cited the same original source, the National Bureau of Statistics of China. The data from 2007 through 2015 was calculated using data out of the China_Statistical_Yearbooks 2008-2015. The data is in Chapter 3 National Accounts in Table 17 Final Consumption Expenditure and Its Composition by Region. The column Government Consumption was divided by GDP and then multiplied by 100. The GDP data that was used is the 2010 base year data from the China_Statistical_Yearbooks 2011-2016. There is more historical data available from the China Statistical Yearbooks, but the GDP data prior to 2007 is questionable and is not to be used until the National Bureau of Statistics comments on or remedies this. The data from 1952-2003 came from the China Data Center database from the University of Michigan in table 104 Final Consumption Expenditure Government. The data appears to blend well and the concerns expressed about GDP from some years in the China Statistical Yearbooks does not appear to be an issue in the China Data Center database. The full data series runs from 1952-2003, 2007-2015.
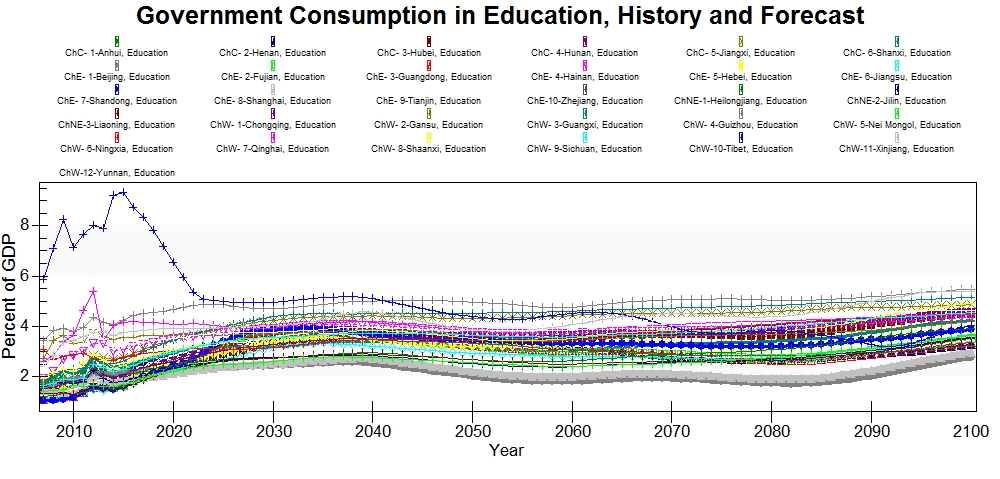
 GovEdPub%GDP
GovtEdPub%GDP was calculated using data from China_Statistical_Yearbooks 2008-2016. Chapter 7 Government Finance Table 6 General Public Expenditure in the column named Expenditure for Education is where the education expenditure data is located in the 2016 China Statistical Yearbook. The education expenditure data was then divided by GDP from the same source and years. There is more historical data available, but it is not being used because the GDP data for those years is questionable.
GovtHI%GDP
This series was calculated using data that was sourced from the China_Statistical_Yearbooks 2008-2016. The data can be found in Chapter 7 Government Finance Table 6 General Public Expenditure by Region under the column headed as Expenditure for Medical and Health Care, Family Planning. The series is calculated by dividing the health care expenditure data by GDP and then multiplied by 100. There is more historical data available by it is not used because the GDP data from the China_Statistical_Yearbooks published before 2011 is questionable and should not be used.
HouseCon%GDP
HouseCon%GDP is calculated using data from the China_Statistical_Yearbooks 2008-2016. The data came from Chapter 3 National Accounts Table 17 Final Consumption Expenditure and Its Composition by Region under the column headed Household Consumption. This data was divided by GDP and multiplied by 100 to generate the final series. There is more historical data available, but the GDP data published prior to 2011 is questionable and should not be used.


