Education Data: Difference between revisions
AltheaDitter (talk | contribs) (Created page with "= EdPriEnrollNetTotalPcnt = This series came from a Human Development Report and only has a single year of data, 1999. This series is out da...") |
AltheaDitter (talk | contribs) No edit summary |
||
| (13 intermediate revisions by the same user not shown) | |||
| Line 1: | Line 1: | ||
= EdPriEnrollNetTotalPcnt = | = EdPriEnrollNetTotalPcnt = | ||
This series came from a [[Human_Development_Report|Human Development Report]] and only has a single year of data, 1999. This series is out dated and needs updated from another source that has data broken down by sex. | This series came from a [[Human_Development_Report|Human Development Report]] and only has a single year of data, 1999. This series is out dated and needs updated from another source that has data broken down by sex. | ||
There are other sources available for instance, the [[China_Statistical_Yearbooks|China Statistical Yearbooks]] have enrollment data available, but the enrollments are in total headcounts not in rates. To calculate the enrollment rates single year age-sex cohorts are needed. This cohort data is not available from an official source, but IFs may be able to generate estimates of single-year age-sex cohorts. The [[ | [[File:EdEnrolNetPri v728.jpg]]Tibet has the lowest rate of primary net enrollment in China. All provinces are forecast to reach 100% primary net enrollment by 2040. | ||
There are other sources available for instance, the [[China_Statistical_Yearbooks|China Statistical Yearbooks]] have enrollment data available, but the enrollments are in total headcounts not in rates. To calculate the enrollment rates single year age-sex cohorts are needed. This cohort data is not available from an official source, but IFs may be able to generate estimates of single-year age-sex cohorts. The Ministry of Education of the People's Republic of China also has enrollment data available from 2010-2015. This data has both the headcounts and the net rates. | |||
= EDPriPTR = | |||
This series was calculated using data from the [[China_Data_Center|China Data Center]] database from table 1401. The number of teachers was divided by the number of students in primary school to render this series that runs from 1949-2003. | |||
There are other sources available to update this series. [[The_Ministry_of_Education_of_the_People's_Republic_of_China|The Ministry of Education of the People's Republic of China]] has this data available from 2010-2015. The [[DataPlanet|DataPlanet]] database also has data available from 1949-2012. | |||
= EdPriTransition2Sec%Total = | |||
This series was found in the [[China_Data_Center|China Data Center]] database from table 1401. The series runs from 1949-2003 and needs updated. | |||
[[File:EdTransitionPri v728.jpg]]The historical data for primary transition to secondary is erratic. The forecast lacks variation among the provinces and all provinces are at 100% in 2014 through the end of the time horizon. | |||
The [[DataPlanet|DataPlanet]] database has data from 1949-2012 for this series in table 730. | |||
= EdSecEnrollGross%Total = | |||
Secondary gross enrollment was found in the 2013 [[Human_Development_Report|Human Development Report]] on China. There is only one year of data, 2010. | |||
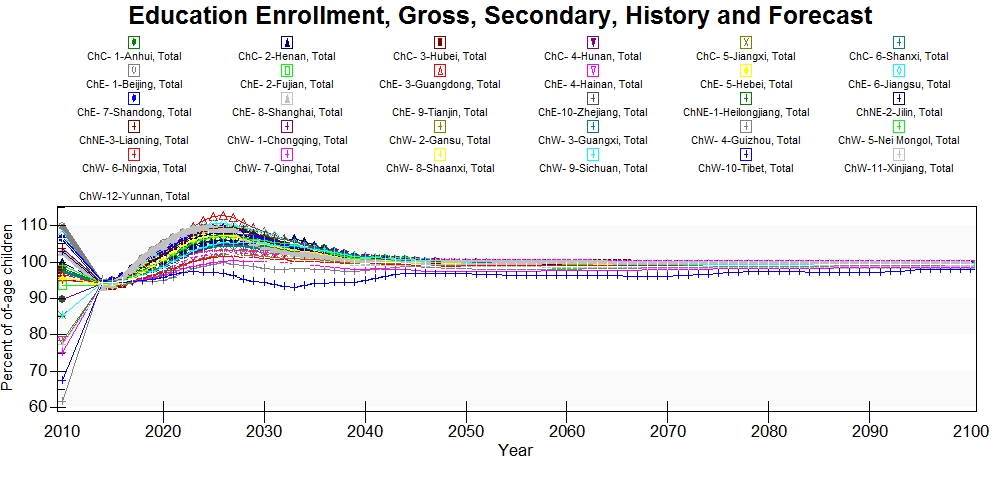
[[File:EdSecEnrolGross v728.jpg]] | |||
Despite there being wide variation in the 2010 data, all provinces are at around 94% gross secondary enrollment in 2014 and are forecast to have less variance than is seen in the historical data. There is an increase to over 100% in most provinces around 2025, which is followed by a decline to 100% where the provinces remain throughout the time horizon. | |||
There are several alternative sources available for updating this series. [[DataPlanet|DataPlanet]] table 736 has total enrollments as a headcount as do the [[China_Statistical_Yearbooks|China Statistical Yearbooks]]. With single-year age-sex cohorts this series could be calculated using these data sources. [[The_Ministry_of_Education_of_the_People's_Republic_of_China|The Ministry of Education of the People's Republic of China]] has this series available from 2010-2015. | |||
= EdSecEnrollNet = | |||
This series was found in the 2000 [[Human_Development_Report|Human Development Report]]. There is only one year of data, 1999, which makes this series dated and in need of more recent data. | |||
[[File:EdEnrollNetSec v728.jpg]]This series is behaving in an unusual way in the model. All provinces drop to zero at model initialization in 2014 and then increases to 100% at the end of the time horizon. This appears to only occur in the provincial model, not in the 186 model. India's model behavior for this series is similar, all provinces are at the same value (66.8%) in 2014. However, India's forecasts have variance among the different provinces whereas in China the provinces have the same value throughout the time horizon. | |||
The [[China_Data_Center|China Data Center]] database in table 1401 has enrollment headcounts that could be used to calculate net enrollment rates if there was single-year age-sex cohorts available. | |||
= EdTerEnrollGross%Total = | |||
This series was found in the 2013 Human Development Report on China. There is only one year of data, 2010, which makes this series in need of an update. | |||
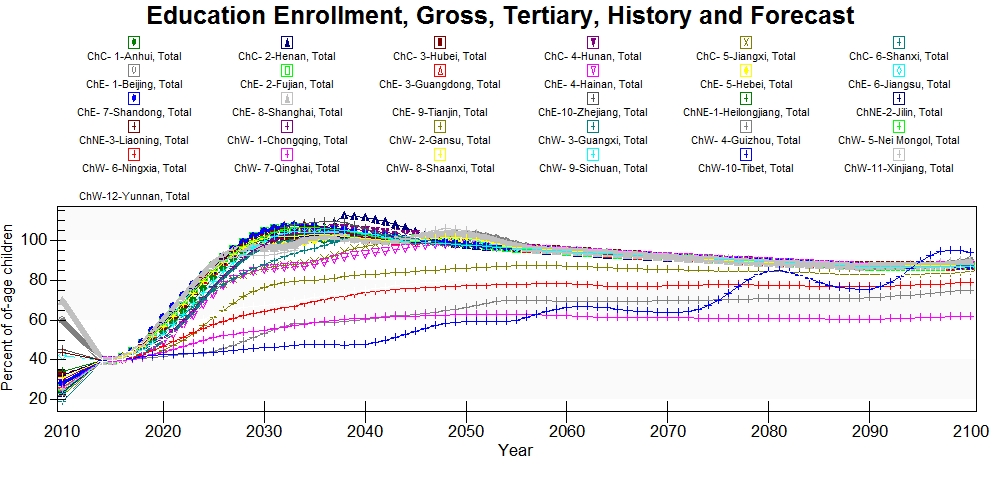
[[File:EdEnrollGrossTert v728.jpg]] | |||
All provinces are at 40% in 2014 when the model initializes and then increases by varying amounts throughout the time horizon. Some province's tertiary enrollments remain relatively flat, such as in Gansu and Ningxia. Where as the majority of provinces increase rapidly reaching 100% around 2035. | |||
The [[DataPlanet|DataPlanet]] database in table 751 has total number of people enrolled in undergraduate programs. With single-year age-sex cohorts an update could be calculated. There is also data available from [[The_Ministry_of_Education_of_the_People's_Republic_of_China|The Ministry of Education of the People's Republic of China]] for 2010-2015. | |||
= LiteracyAdult%Total = | |||
This series was found in the [[China_Data_Center|China Data Center]] database, but was originally from the [[Census_of_China|Census of China]]. The series has observations in 1990, 2000, and 2010 and could use an update to improve model performance. | |||
[[File:Literacy v728.jpg]]Tibet has the lowest literacy rate in China, with about a 20 year lag behind the next lowest literacy rates in Qinghai. All provinces are forecast to reach 100% literacy by 2050. | |||
There is an update available in the [[China_Statistical_Yearbooks|China Statistical Yearbooks]] in Chapter 2 table 5. | |||
= Illiteracy% = | |||
This series was calculated using the inverse of literacy from the [[China_Data_Center|China Data Center]] database's [[Census_of_China|Census of China]] literacy series. The series has observations in 1990, 2000, 2010. | |||
Latest revision as of 17:33, 17 May 2017
EdPriEnrollNetTotalPcnt
This series came from a Human Development Report and only has a single year of data, 1999. This series is out dated and needs updated from another source that has data broken down by sex.
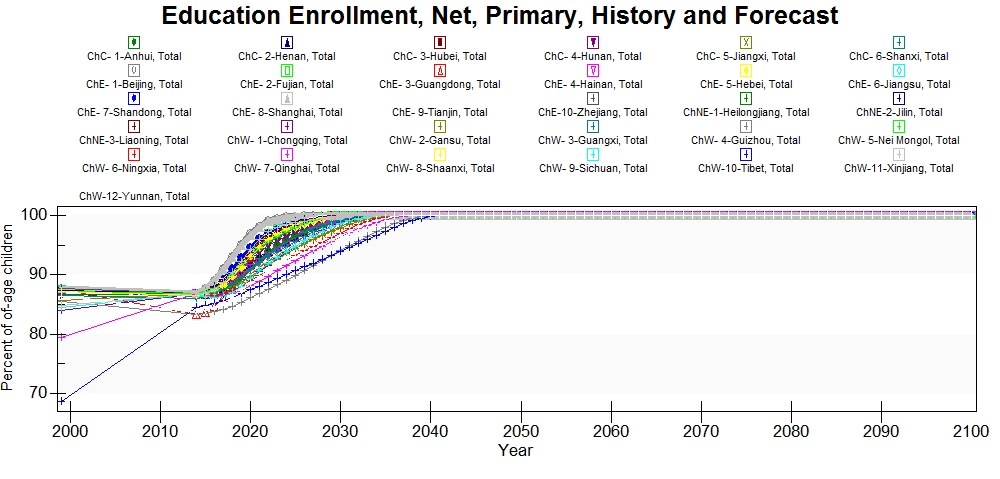 Tibet has the lowest rate of primary net enrollment in China. All provinces are forecast to reach 100% primary net enrollment by 2040.
There are other sources available for instance, the China Statistical Yearbooks have enrollment data available, but the enrollments are in total headcounts not in rates. To calculate the enrollment rates single year age-sex cohorts are needed. This cohort data is not available from an official source, but IFs may be able to generate estimates of single-year age-sex cohorts. The Ministry of Education of the People's Republic of China also has enrollment data available from 2010-2015. This data has both the headcounts and the net rates.
EDPriPTR
This series was calculated using data from the China Data Center database from table 1401. The number of teachers was divided by the number of students in primary school to render this series that runs from 1949-2003.
There are other sources available to update this series. The Ministry of Education of the People's Republic of China has this data available from 2010-2015. The DataPlanet database also has data available from 1949-2012.
EdPriTransition2Sec%Total
This series was found in the China Data Center database from table 1401. The series runs from 1949-2003 and needs updated.
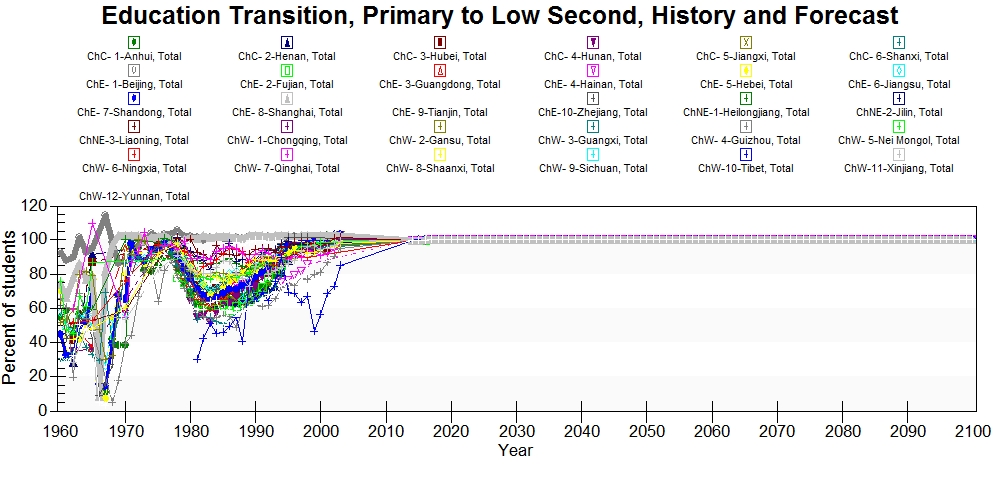 The historical data for primary transition to secondary is erratic. The forecast lacks variation among the provinces and all provinces are at 100% in 2014 through the end of the time horizon.
The DataPlanet database has data from 1949-2012 for this series in table 730.
EdSecEnrollGross%Total
Secondary gross enrollment was found in the 2013 Human Development Report on China. There is only one year of data, 2010.
Despite there being wide variation in the 2010 data, all provinces are at around 94% gross secondary enrollment in 2014 and are forecast to have less variance than is seen in the historical data. There is an increase to over 100% in most provinces around 2025, which is followed by a decline to 100% where the provinces remain throughout the time horizon.
There are several alternative sources available for updating this series. DataPlanet table 736 has total enrollments as a headcount as do the China Statistical Yearbooks. With single-year age-sex cohorts this series could be calculated using these data sources. The Ministry of Education of the People's Republic of China has this series available from 2010-2015.
EdSecEnrollNet
This series was found in the 2000 Human Development Report. There is only one year of data, 1999, which makes this series dated and in need of more recent data.
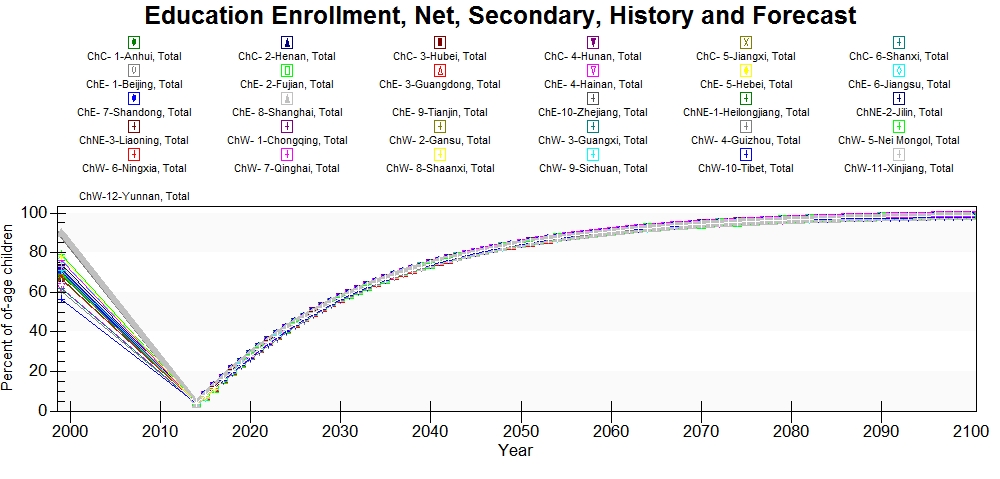 This series is behaving in an unusual way in the model. All provinces drop to zero at model initialization in 2014 and then increases to 100% at the end of the time horizon. This appears to only occur in the provincial model, not in the 186 model. India's model behavior for this series is similar, all provinces are at the same value (66.8%) in 2014. However, India's forecasts have variance among the different provinces whereas in China the provinces have the same value throughout the time horizon.
The China Data Center database in table 1401 has enrollment headcounts that could be used to calculate net enrollment rates if there was single-year age-sex cohorts available.
EdTerEnrollGross%Total
This series was found in the 2013 Human Development Report on China. There is only one year of data, 2010, which makes this series in need of an update.
All provinces are at 40% in 2014 when the model initializes and then increases by varying amounts throughout the time horizon. Some province's tertiary enrollments remain relatively flat, such as in Gansu and Ningxia. Where as the majority of provinces increase rapidly reaching 100% around 2035.
The DataPlanet database in table 751 has total number of people enrolled in undergraduate programs. With single-year age-sex cohorts an update could be calculated. There is also data available from The Ministry of Education of the People's Republic of China for 2010-2015.
LiteracyAdult%Total
This series was found in the China Data Center database, but was originally from the Census of China. The series has observations in 1990, 2000, and 2010 and could use an update to improve model performance.
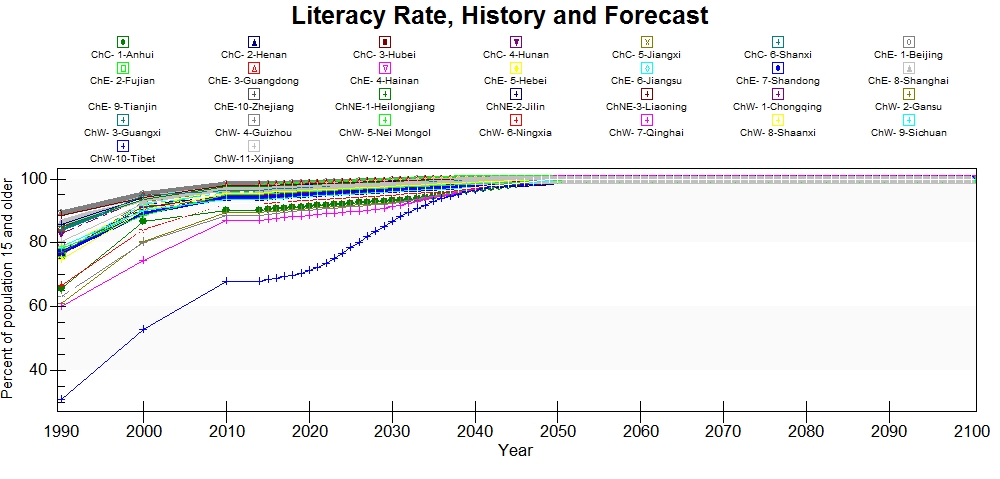 Tibet has the lowest literacy rate in China, with about a 20 year lag behind the next lowest literacy rates in Qinghai. All provinces are forecast to reach 100% literacy by 2050.
There is an update available in the China Statistical Yearbooks in Chapter 2 table 5.
Illiteracy%
This series was calculated using the inverse of literacy from the China Data Center database's Census of China literacy series. The series has observations in 1990, 2000, 2010.
