Agriculture Data: Difference between revisions
AltheaDitter (talk | contribs) No edit summary |
AltheaDitter (talk | contribs) No edit summary |
||
| (12 intermediate revisions by the same user not shown) | |||
| Line 1: | Line 1: | ||
= AgProdCereals = | = AgProdCereals = | ||
Cereals production in China's subnational model is made up of data from two sources that have been blended together. The data from 1949-2003 came from the [[China_Data_Center|China Data Center]] database table 804 and the data from 2004-2015 came from the [[China_Statistical_Yearbooks|China Statistical Yearbooks]] 2005-2016 in Chapter 12 ''Agriculture ''table 10 ''Output of Major Farm Products''. These two sources blend together to generate a continuous series with data from 1949-2015, one of the longest time series in the China subnational model. This data was converted into million metric tons from ten thousand metric tons. | Cereals production in China's subnational model is made up of data from two sources that have been blended together. The data from 1949-2003 came from the [[China_Data_Center|China Data Center]] database table 804 and the data from 2004-2015 came from the [[China_Statistical_Yearbooks|China Statistical Yearbooks]] 2005-2016 in Chapter 12 ''Agriculture ''table 10 ''Output of Major Farm Products''. These two sources blend together to generate a continuous series with data from 1949-2015, one of the longest time series in the China subnational model. This data was converted into million metric tons from ten thousand metric tons. | ||
[[File:AgProdCrop v728.jpg|RTENOTITLE]]Crop production includes cereals production, as well as vegetable, fruit, pulses, and tuber production. The historical data smoothly transitions to the forecasts with Guangdong, Jiangsu, and Shandong as the top crop producers. The data is interpolated and filled by the model for this series through 2011. | |||
= AgProdFruitsExclMelons = | = AgProdFruitsExclMelons = | ||
| Line 12: | Line 14: | ||
Meat production in China's provinces was found in the [[China_Data_Center|China Data Center]] database in table 804 and this data was blended with data that was found in previous iterations of this model from the [[China_Statistical_Yearbooks|China Statistical Yearbooks]] 2006. The data was converted from ten thousand metric tons to million metric tons. The two series gives a final data series of 1949-2003, and 2005. | Meat production in China's provinces was found in the [[China_Data_Center|China Data Center]] database in table 804 and this data was blended with data that was found in previous iterations of this model from the [[China_Statistical_Yearbooks|China Statistical Yearbooks]] 2006. The data was converted from ten thousand metric tons to million metric tons. The two series gives a final data series of 1949-2003, and 2005. | ||
[[File:AgProdMeat v728.jpg|RTENOTITLE]] | |||
The model estimates and interpolates the data through 2011 for this series. The last data point in 2011 is identical to the data point in 2014 when the model initializes, which causes an unexpected flattening of agricultural production between the end of the historical data and the forecasts. Overall the forecasts look good with Guangdong, Jiangsu, and Shandong as the top meat producers. | |||
This series is outdated and could be updated with data that is available through the [[China_Statistical_Yearbooks|China Statistical Yearbooks]] in Chapter 12 ''Agriculture ''table 14'' Output of Livestock Products''. Through the [[China_Statistical_Yearbooks|China Statistical Yearbooks]] 2005-2016 there is sufficient coverage to have a time series from 1949-2015. The [[DataPlanet|DataPlanet]] database in table 271 also has data available for meat production from 1949-2013. | This series is outdated and could be updated with data that is available through the [[China_Statistical_Yearbooks|China Statistical Yearbooks]] in Chapter 12 ''Agriculture ''table 14'' Output of Livestock Products''. Through the [[China_Statistical_Yearbooks|China Statistical Yearbooks]] 2005-2016 there is sufficient coverage to have a time series from 1949-2015. The [[DataPlanet|DataPlanet]] database in table 271 also has data available for meat production from 1949-2013. | ||
| Line 23: | Line 29: | ||
= LandArea = | = LandArea = | ||
Land area was found in the [[China_Statistical_Yearbooks|China Statistical Yearbooks]] 2006. This data was converted into million hectares from ten thousand hectares. Although there was only one observation for 2005 found, the observations were repeated through 2013 to improve model performance. | Land area was found in the [[China_Statistical_Yearbooks|China Statistical Yearbooks]] 2006, but the specific chapter and table was not recorded and could not be found. This data was converted into million hectares from ten thousand hectares. Although there was only one observation for 2005 found, the observations were repeated through 2013 to improve model performance. | ||
[[File:LandTotal.jpg]]Land area behaves unexpectedly in the model for the China sub-regional model. The forecasts for land area are identical to what is in the Access tables with the historical data, the historical data is not what is in the Access table. This has not been further pursued because the forecasts are correct, but future users may want to research this issue. | |||
= LandTotal = | |||
This series was sourced from www.china.org.cn and wikipedia, although the original data has not been recovered. The data appears to be accurate, although it is slightly different from the LandArea series. | |||
= LandCrop = | = LandCrop = | ||
Crop land was found in the [[China_Statistical_Yearbooks|China Statistical Yearbooks]] 2006 in chapter 13 ''Agriculture ''table 15 ''Total Sown Area of Crops'', there is a single year of data in 2005. This data is in thousand hectares and [[ApplyMultAll|ApplyMultAll]] is used to normalize the data into the | Crop land was found in the [[China_Statistical_Yearbooks|China Statistical Yearbooks]] 2006 in chapter 13 ''Agriculture ''table 15 ''Total Sown Area of Crops'', there is a single year of data in 2005. This data is in thousand hectares and [[ApplyMultAll|ApplyMultAll]] is used to normalize the data into million hectares. | ||
[[File:LandCrop.jpg]]There is not a forecast change in crop land from the historical data. Henan province has the largest crop land area and Tibet has the least. | |||
This series is outdated and could be updated using more recent editions of the [[China_Statistical_Yearbooks|China Statistical Yearbooks]] 2007-2016 in Chapter 12 ''Agriculture'' table 8 S''own Area of Major Crops. '' | This series is outdated and could be updated using more recent editions of the [[China_Statistical_Yearbooks|China Statistical Yearbooks]] 2007-2016 in Chapter 12 ''Agriculture'' table 8 S''own Area of Major Crops. '' | ||
| Line 33: | Line 47: | ||
= LandCrop% = | = LandCrop% = | ||
The percentage of crop land was found at the [[China_Data_Center|China Data Center]] and the series runs from 1949-2003. The series was found in table 803 ''Sown area''. | The percentage of crop land was found at the [[China_Data_Center|China Data Center]] and the series runs from 1949-2003. The series was found in table 803 ''Sown area, ''and was calculated using this data relative to the total land area. | ||
This series is outdated and could be updated using land area and crop land data from the [[China_Statistical_Yearbooks|China Statistical Yearbooks]] in Chapter 12 ''Agriculture'' table 8 S''own Area of Major Crops. '' | This series is outdated and could be updated using land area and crop land data from the [[China_Statistical_Yearbooks|China Statistical Yearbooks]] in Chapter 12 ''Agriculture'' table 8 S''own Area of Major Crops. '' | ||
| Line 40: | Line 54: | ||
The series for forested land in China's provinces was located in the [[China_Statistical_Yearbooks|China Statistical Yearbooks]] 2006, giving a single year of data in 2005. The series is found in Chapter 12 ''Enivronment Protection ''table 19 ''Forest Resources by Region. ''This series is in ten thousand hectares and is normalized into the correct units using [[ApplyMultAll|ApplyMultAll]]. | The series for forested land in China's provinces was located in the [[China_Statistical_Yearbooks|China Statistical Yearbooks]] 2006, giving a single year of data in 2005. The series is found in Chapter 12 ''Enivronment Protection ''table 19 ''Forest Resources by Region. ''This series is in ten thousand hectares and is normalized into the correct units using [[ApplyMultAll|ApplyMultAll]]. | ||
[[File:LandForest v728.jpg]] There is a noticeable shift from the historical data and the forecast data that is similar to the shift that is in the LandArea series. However, unlike the LandArea series, the historical data that is shown in IFs and the forecast data are not the same as the data in the Access table. Nei Mongol has the largest forested land area in China, which is shown in the historical data and in the forecasts. The values for Nei Mongol are not the same as what is shown in the Access table. After Nei Mongol the ranking of forested land area among the Chinese provinces is inconsistent with the actual data in the Access table. | |||
This series needs updated and could be updated using the more recent [[China_Statistical_Yearbooks|China Statistical Yearbooks]] 2007-2016 in Chapter 8 ''Resources and Environment'' table 25 ''Forest Resources by Region''. | This series needs updated and could be updated using the more recent [[China_Statistical_Yearbooks|China Statistical Yearbooks]] 2007-2016 in Chapter 8 ''Resources and Environment'' table 25 ''Forest Resources by Region''. | ||
| Line 46: | Line 62: | ||
The series for grazing land was cited to be from the [[China_Statistical_Yearbooks|China Statistical Yearbooks]] 2006, giving a single year of data in 2005. This data could not be found again and the chapter and table location for the data was not recorded. | The series for grazing land was cited to be from the [[China_Statistical_Yearbooks|China Statistical Yearbooks]] 2006, giving a single year of data in 2005. This data could not be found again and the chapter and table location for the data was not recorded. | ||
[[File:LandGrazing v728.jpg]]The historical data for grazing is properly ranked with Nei Mongol closely followed by Tibet as having the largest grazing land area. The values that are shown in IFs are not the same as what is shown in the Access table. The forecasts are different from the historical data and are ranked differently than what is shown in the actual data. | |||
= LandIrAreaEquipFAO = | = LandIrAreaEquipFAO = | ||
Latest revision as of 19:43, 17 May 2017
AgProdCereals
Cereals production in China's subnational model is made up of data from two sources that have been blended together. The data from 1949-2003 came from the China Data Center database table 804 and the data from 2004-2015 came from the China Statistical Yearbooks 2005-2016 in Chapter 12 Agriculture table 10 Output of Major Farm Products. These two sources blend together to generate a continuous series with data from 1949-2015, one of the longest time series in the China subnational model. This data was converted into million metric tons from ten thousand metric tons.
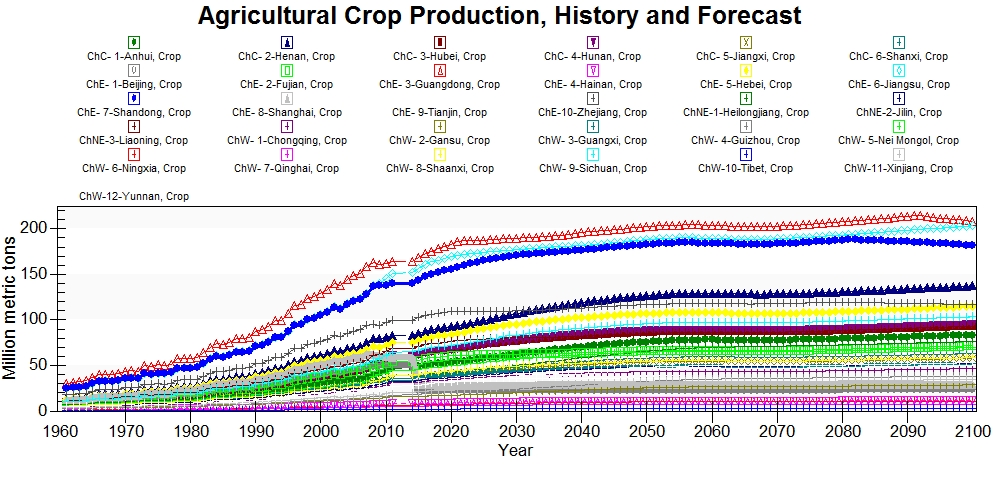 Crop production includes cereals production, as well as vegetable, fruit, pulses, and tuber production. The historical data smoothly transitions to the forecasts with Guangdong, Jiangsu, and Shandong as the top crop producers. The data is interpolated and filled by the model for this series through 2011.
AgProdFruitsExclMelons
Fruit production in China's subnational model came from the China Data Center database table 804. This series runs from 1949-2003. The data was converted from ten thousand metric tons to million metric tons before importing into IFs.
This series is outdated and could be updated with data that is available through the China Statistical Yearbooks in Chapter 12 Agriculture table 10 Output of Major Farm Products. This series is available from 2004-2015 and would give the model more recent data for initialization and improved model performance.
AgProdMeat
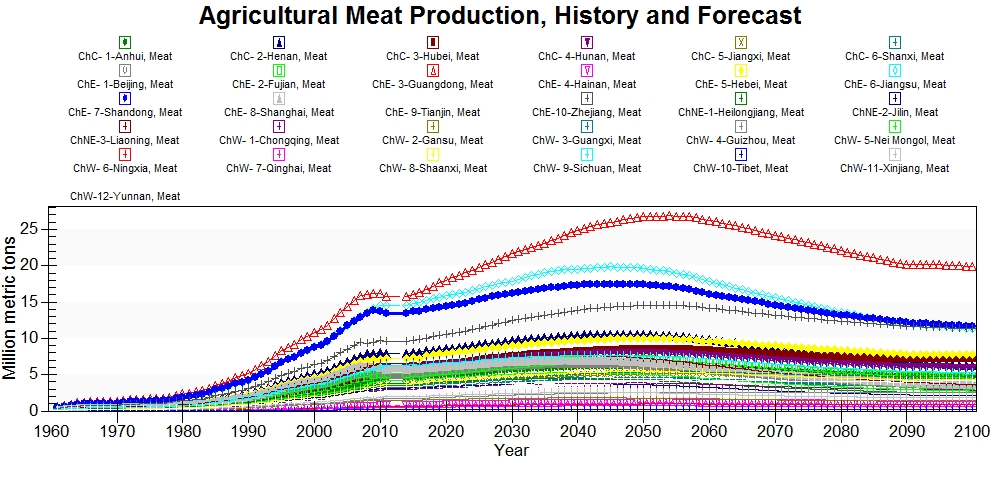
Meat production in China's provinces was found in the China Data Center database in table 804 and this data was blended with data that was found in previous iterations of this model from the China Statistical Yearbooks 2006. The data was converted from ten thousand metric tons to million metric tons. The two series gives a final data series of 1949-2003, and 2005.
The model estimates and interpolates the data through 2011 for this series. The last data point in 2011 is identical to the data point in 2014 when the model initializes, which causes an unexpected flattening of agricultural production between the end of the historical data and the forecasts. Overall the forecasts look good with Guangdong, Jiangsu, and Shandong as the top meat producers.
This series is outdated and could be updated with data that is available through the China Statistical Yearbooks in Chapter 12 Agriculture table 14 Output of Livestock Products. Through the China Statistical Yearbooks 2005-2016 there is sufficient coverage to have a time series from 1949-2015. The DataPlanet database in table 271 also has data available for meat production from 1949-2013.
LandAgri
Agricultural land is one of the first series that was included in the China subnational model using data from the China Statistical Yearbooks 2006 from Chapter 12 Environment Protection table 18 Land Use by Region. This series only has one year of data, 2005. The data is in thousand hectares and normalized to national data using ApplyMultAll.
This series could be updated with more recent data from the China Statistical Yearbooks 2007-2016 in Chapter 8 Resources and Environment table 24 Land Use by Region. An update would allow for the series to run from 2005-2015.
LandArea
Land area was found in the China Statistical Yearbooks 2006, but the specific chapter and table was not recorded and could not be found. This data was converted into million hectares from ten thousand hectares. Although there was only one observation for 2005 found, the observations were repeated through 2013 to improve model performance.
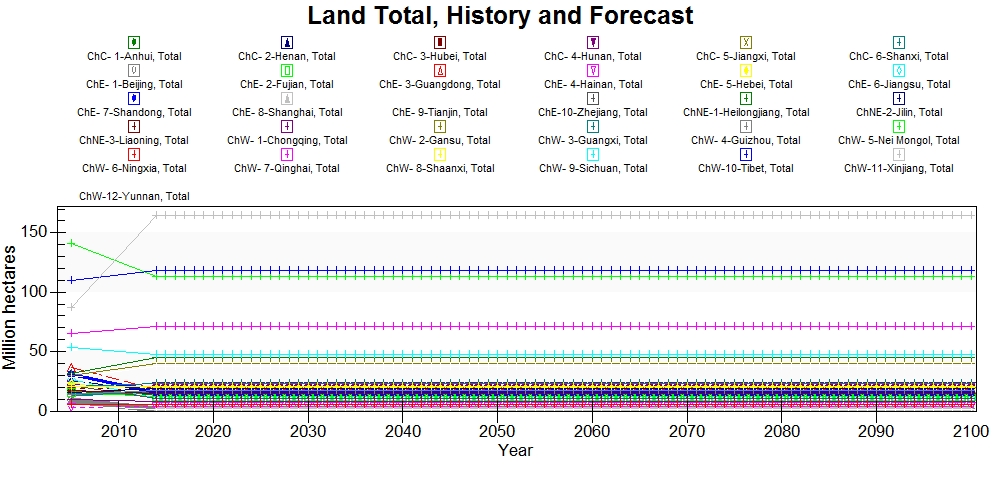 Land area behaves unexpectedly in the model for the China sub-regional model. The forecasts for land area are identical to what is in the Access tables with the historical data, the historical data is not what is in the Access table. This has not been further pursued because the forecasts are correct, but future users may want to research this issue.
LandTotal
This series was sourced from www.china.org.cn and wikipedia, although the original data has not been recovered. The data appears to be accurate, although it is slightly different from the LandArea series.
LandCrop
Crop land was found in the China Statistical Yearbooks 2006 in chapter 13 Agriculture table 15 Total Sown Area of Crops, there is a single year of data in 2005. This data is in thousand hectares and ApplyMultAll is used to normalize the data into million hectares.
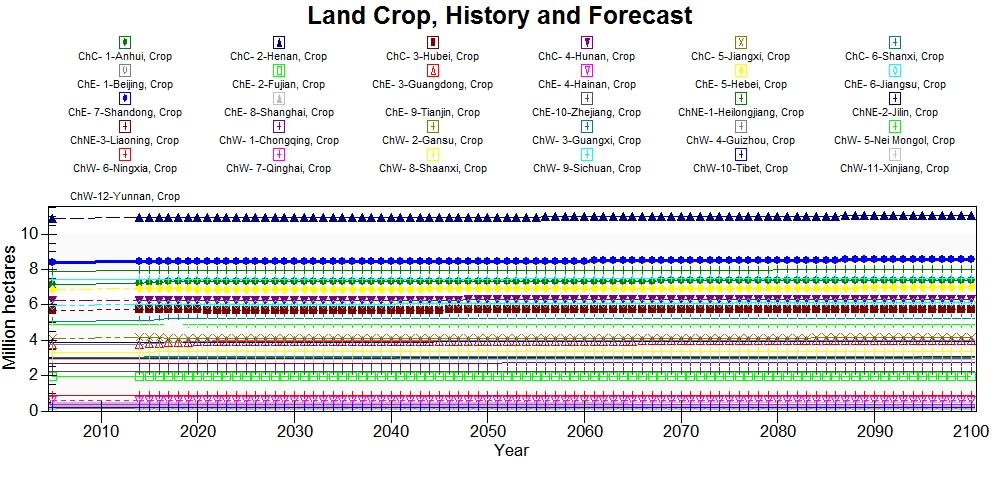 There is not a forecast change in crop land from the historical data. Henan province has the largest crop land area and Tibet has the least.
This series is outdated and could be updated using more recent editions of the China Statistical Yearbooks 2007-2016 in Chapter 12 Agriculture table 8 Sown Area of Major Crops.
LandCrop%
The percentage of crop land was found at the China Data Center and the series runs from 1949-2003. The series was found in table 803 Sown area, and was calculated using this data relative to the total land area.
This series is outdated and could be updated using land area and crop land data from the China Statistical Yearbooks in Chapter 12 Agriculture table 8 Sown Area of Major Crops.
LandForest
The series for forested land in China's provinces was located in the China Statistical Yearbooks 2006, giving a single year of data in 2005. The series is found in Chapter 12 Enivronment Protection table 19 Forest Resources by Region. This series is in ten thousand hectares and is normalized into the correct units using ApplyMultAll.
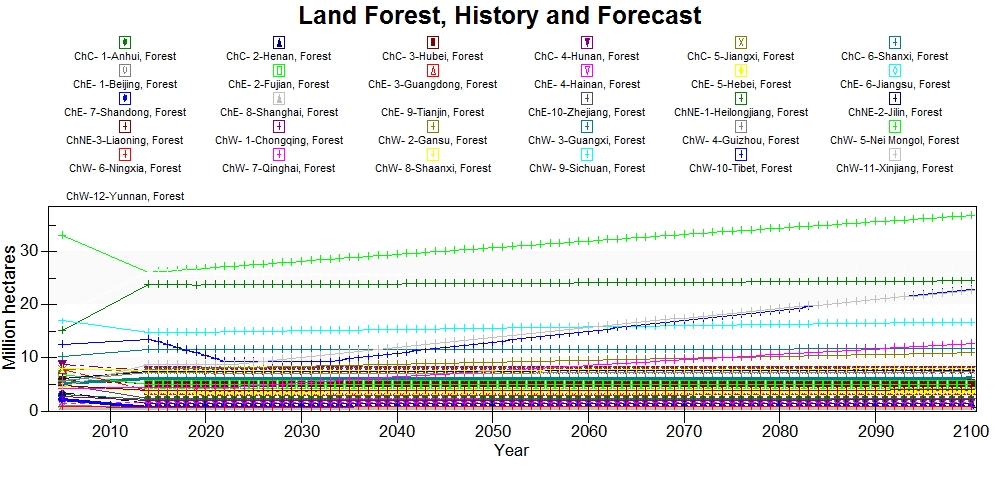 There is a noticeable shift from the historical data and the forecast data that is similar to the shift that is in the LandArea series. However, unlike the LandArea series, the historical data that is shown in IFs and the forecast data are not the same as the data in the Access table. Nei Mongol has the largest forested land area in China, which is shown in the historical data and in the forecasts. The values for Nei Mongol are not the same as what is shown in the Access table. After Nei Mongol the ranking of forested land area among the Chinese provinces is inconsistent with the actual data in the Access table.
This series needs updated and could be updated using the more recent China Statistical Yearbooks 2007-2016 in Chapter 8 Resources and Environment table 25 Forest Resources by Region.
LandGrazing
The series for grazing land was cited to be from the China Statistical Yearbooks 2006, giving a single year of data in 2005. This data could not be found again and the chapter and table location for the data was not recorded.
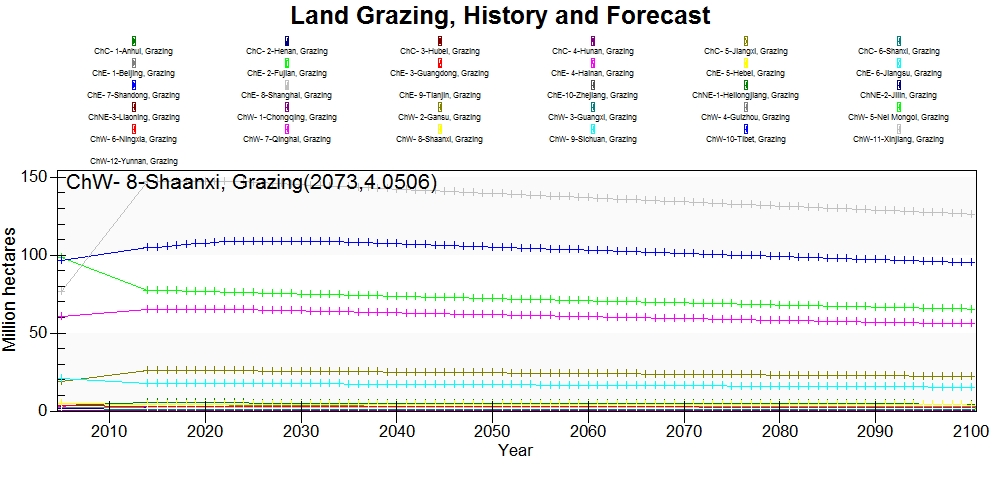 The historical data for grazing is properly ranked with Nei Mongol closely followed by Tibet as having the largest grazing land area. The values that are shown in IFs are not the same as what is shown in the Access table. The forecasts are different from the historical data and are ranked differently than what is shown in the actual data.
LandIrAreaEquipFAO
This series was found in the China Data Center database in table 803. The data is in thousand hectares and the series runs from 1949-2003.
This series needs updated with more recent data from the China Statistical Yearbooks 2007-2016 from Chapter 12 Agriculture table 5 Irrigated Area of Cultivated Land and Consumption of Chemical Fertilizers.
