India's Population Data: Difference between revisions
AltheaDitter (talk | contribs) No edit summary |
AltheaDitter (talk | contribs) No edit summary |
||
| (18 intermediate revisions by the same user not shown) | |||
| Line 1: | Line 1: | ||
= Population = | = Population = | ||
The population series was | The population series for India's sub-regional model was found in the World Bank's subnational population project here: [http://databank.worldbank.org/data/reports.aspx?source=subnational-population http://databank.worldbank.org/data/reports.aspx?source=subnational-population] | ||
The series runs from 2005 through 2015 and was published in total population. This data is normalized into millions using [[ApplyMultAll|ApplyMultAll]] rather than converted into millions, this will simplify data updates and decrease the likelihood of human error. The World Bank does not have data for Telangana, which means Andhra Pradesh's data includes Telangana. To estimate Telangana and Andhra Pradesh, a population ratio was calculated using Census data. The 2011 Census has district-level data that was used to estimate Telangana by summing the districts that make up present-day Telangana. This population estimate was used to calculate the ratio of Telangana population relative to the total Andhra Pradesh population. This ratio was then applied to Andhra Pradesh for all years, 2006-2015 to estimate Telangana's population. Andhra Pradesh's population was estimated by using the inverse ratio for all years. | |||
{| border="1" cellspacing="1" cellpadding="0" width="500" style="width:500px;" | {| border="1" cellspacing="1" cellpadding="0" width="500" style="width:500px;" | ||
| Line 18: | Line 20: | ||
|} | |} | ||
[[ | The World Bank source was selected to be used in the model because the IFs model is calibrated to World Bank data, which makes it the best data source for the model. There are other data sources for sub-regional population in India that can be read about in [[Alternative_India_Population_Sources|Alternative India Population Sources]]. | ||
[[File:India PopulationWB v728.jpg|RTENOTITLE]] | |||
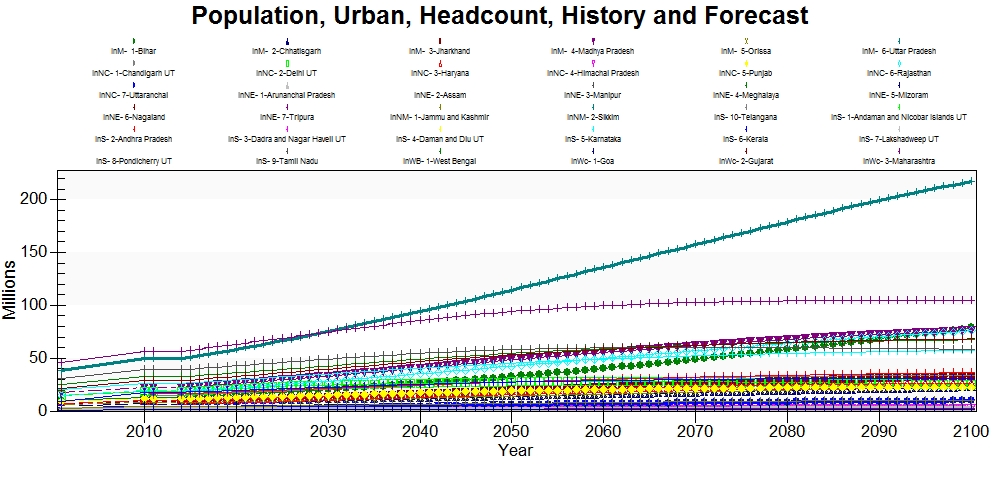
Uttar Pradesh is the most populated state in India historically and through the end of the time horizon. The state is forecast to more than triple in population from 1960 through 2100. Maharashtra is historically the second most populated state in India, but its population is forecast to peak around 2030. Bihar is historically the third most populated state and is forecast to surpass Maharashtra in 2020. Between 2014 and the end of the time horizon, Bihar's population is forecast to more than double. | |||
= Age-Sex Cohorts = | = Age-Sex Cohorts = | ||
The age-sex cohort data came from the [[2011_Census|2011 Census]]. This data was published in single year cohorts and was aggregated into the five-year cohorts that are used in the model. | The age-sex cohort data came from the [[2011_Census|2011 Census]]. This data was published in single year cohorts and was aggregated into the five-year cohorts that are used in the model. The state of Telangana was estimated by summing the districts that make up present day Telangana and Andhra Pradesh was estimated in the same manner. | ||
[[File:AndamanandNicobarIs2014ASC.png|right|middle|300px|AndamanandNicobarIs2014ASC.png]][[File:AndhraPradesh2014ASC.png|left|middle|300px|AndhraPradesh2014ASC.png]][[File:ArunachalPradesh2014ASC.png|center|middle|300px|ArunachalPradesh2014ASC.png]] | |||
[[File:Assam2014ASC.png|left|middle|300px|Assam2014ASC.png]]<br/>[[File:Chhatisgarh2014ASC.png|center|middle|300px|Chhatisgarh2014ASC.png]][[File:DadraandNagarHaveli2014ASC.png|300px|DadraandNagarHaveli2014ASC.png]][[File:DamanandDiu2014ASC.png|300px|DamanandDiu2014ASC.png]] | |||
= PopulationUrban = | |||
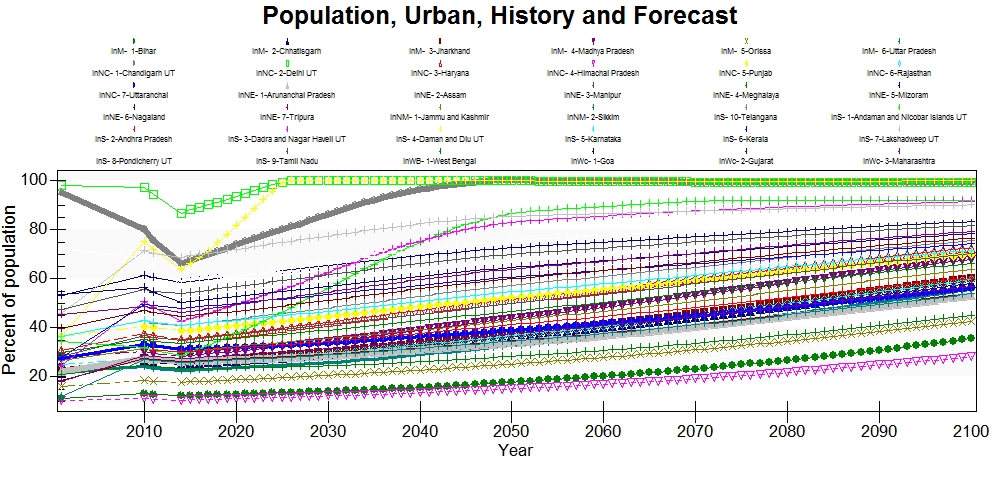
India's urban population series came from the Report of the Prime Minister's High Level Committee and the series is from 1991, 2010-2011. Telangana's urban population was found on the state's website and was used to estimate Andhra Pradesh's urban population. | |||
[[File:IndiaUrbanPop v728.jpg|RTENOTITLE]] | |||
[[File:IndiaUrbanRate v728.jpg|RTENOTITLE]] | |||
= Households = | |||
Household data came from the [[Ministry_of_Planning_and_Development|Ministry of Planning and Development]] from 2014. Despite it being 2014 data, Telangana did not have data. To estimate Telangana and Andhra Pradesh the population ratios from 2011 were applied to the household data. The data is in households rather than millions of households and is normalized using [[ApplyMultAll|ApplyMultAll]]. | |||
[[File:IndiaHouseholds v728.jpg|RTENOTITLE]] | |||
= TFRMedUNPD = | |||
Total fertility rates were pulled from the [[DevInfo_database|DevInfo database]] and the series runs from 1971 through 2013. The DevInfo database states the original source of this data as the ORGI_Sample Registration System Reports, Office of the Registrar General and Census Commissioner, Ministry of Home Affairs, Government of India, New Delhi. | |||
[[File:IndiaTFR v728.jpg|RTENOTITLE]] | |||
= ForecastNetMigrationRateUNPD = | |||
The subregional migration rates for India were calculated using net migration from the [[2001_Census|2001 Census]]. The 2011 Census has not yet released migration data. | |||
[[File:IndiaNetMigrationRate v728.jpg|RTENOTITLE]] | |||
[[File:IndiaNetMigration v728.jpg|RTENOTITLE]] | |||
= PopulationYouthDepend% = | |||
The original source for this data was not recorded, but it appears to have originated from the [[2011_Census|2011 Census]]. | |||
Latest revision as of 21:43, 5 June 2017
Population
The population series for India's sub-regional model was found in the World Bank's subnational population project here: http://databank.worldbank.org/data/reports.aspx?source=subnational-population
The series runs from 2005 through 2015 and was published in total population. This data is normalized into millions using ApplyMultAll rather than converted into millions, this will simplify data updates and decrease the likelihood of human error. The World Bank does not have data for Telangana, which means Andhra Pradesh's data includes Telangana. To estimate Telangana and Andhra Pradesh, a population ratio was calculated using Census data. The 2011 Census has district-level data that was used to estimate Telangana by summing the districts that make up present-day Telangana. This population estimate was used to calculate the ratio of Telangana population relative to the total Andhra Pradesh population. This ratio was then applied to Andhra Pradesh for all years, 2006-2015 to estimate Telangana's population. Andhra Pradesh's population was estimated by using the inverse ratio for all years.
State |
2011 Population |
2011 Population Ratio |
Telangana |
30.987 |
0.4066 |
Andhra Pradesh |
45.223 |
0.5934 |
The World Bank source was selected to be used in the model because the IFs model is calibrated to World Bank data, which makes it the best data source for the model. There are other data sources for sub-regional population in India that can be read about in Alternative India Population Sources.
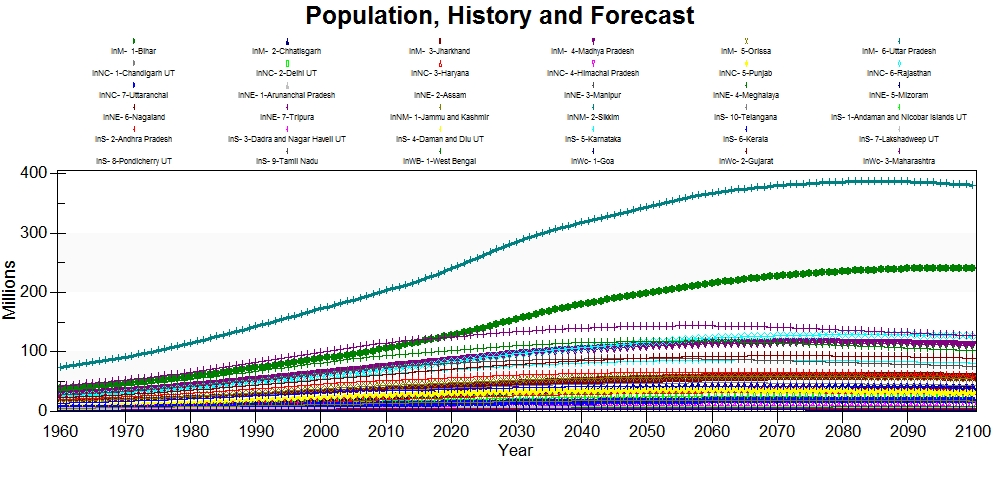
Uttar Pradesh is the most populated state in India historically and through the end of the time horizon. The state is forecast to more than triple in population from 1960 through 2100. Maharashtra is historically the second most populated state in India, but its population is forecast to peak around 2030. Bihar is historically the third most populated state and is forecast to surpass Maharashtra in 2020. Between 2014 and the end of the time horizon, Bihar's population is forecast to more than double.
Age-Sex Cohorts
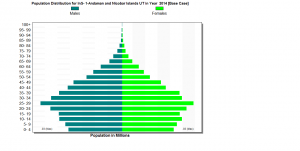
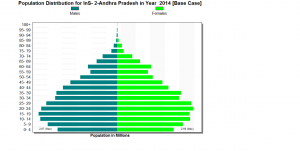
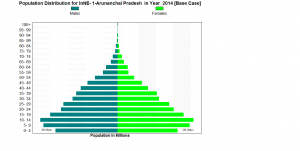
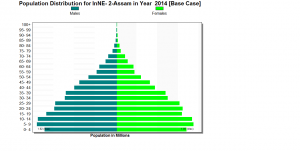
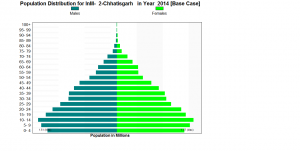
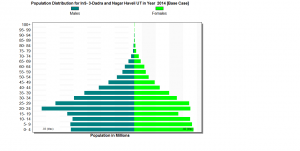
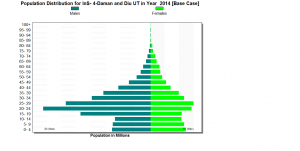
The age-sex cohort data came from the 2011 Census. This data was published in single year cohorts and was aggregated into the five-year cohorts that are used in the model. The state of Telangana was estimated by summing the districts that make up present day Telangana and Andhra Pradesh was estimated in the same manner.
PopulationUrban
India's urban population series came from the Report of the Prime Minister's High Level Committee and the series is from 1991, 2010-2011. Telangana's urban population was found on the state's website and was used to estimate Andhra Pradesh's urban population.
Households
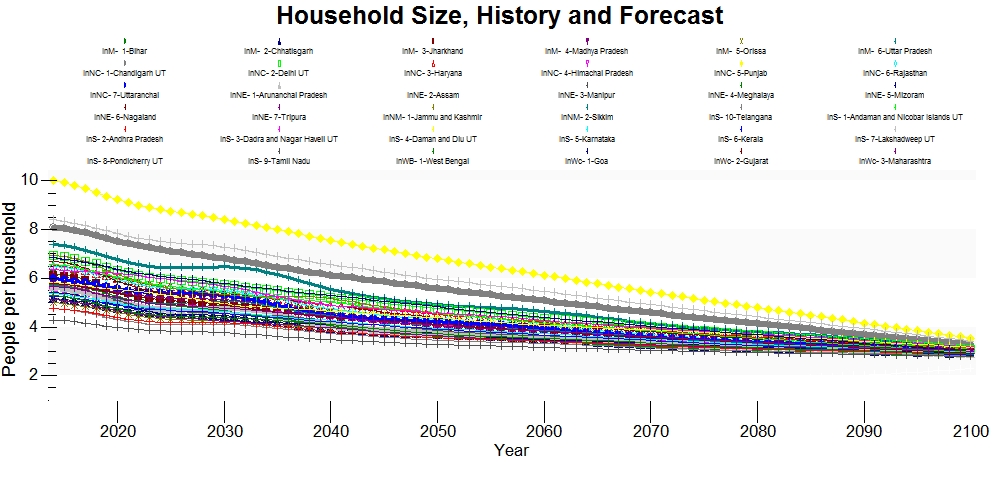
Household data came from the Ministry of Planning and Development from 2014. Despite it being 2014 data, Telangana did not have data. To estimate Telangana and Andhra Pradesh the population ratios from 2011 were applied to the household data. The data is in households rather than millions of households and is normalized using ApplyMultAll.
TFRMedUNPD
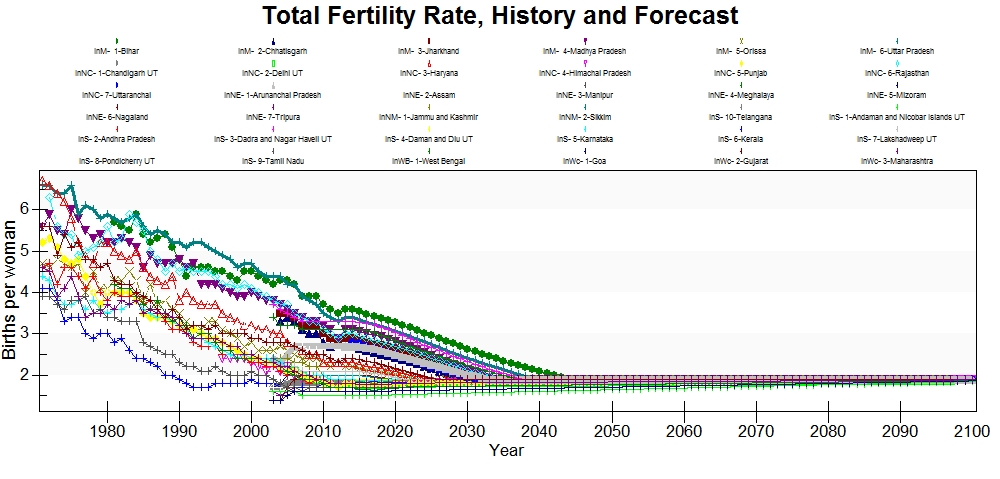
Total fertility rates were pulled from the DevInfo database and the series runs from 1971 through 2013. The DevInfo database states the original source of this data as the ORGI_Sample Registration System Reports, Office of the Registrar General and Census Commissioner, Ministry of Home Affairs, Government of India, New Delhi.
ForecastNetMigrationRateUNPD
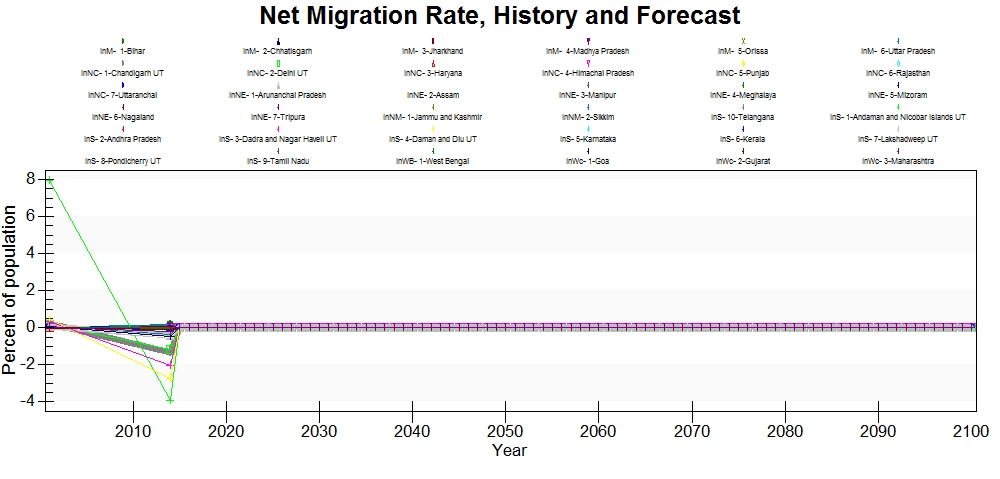
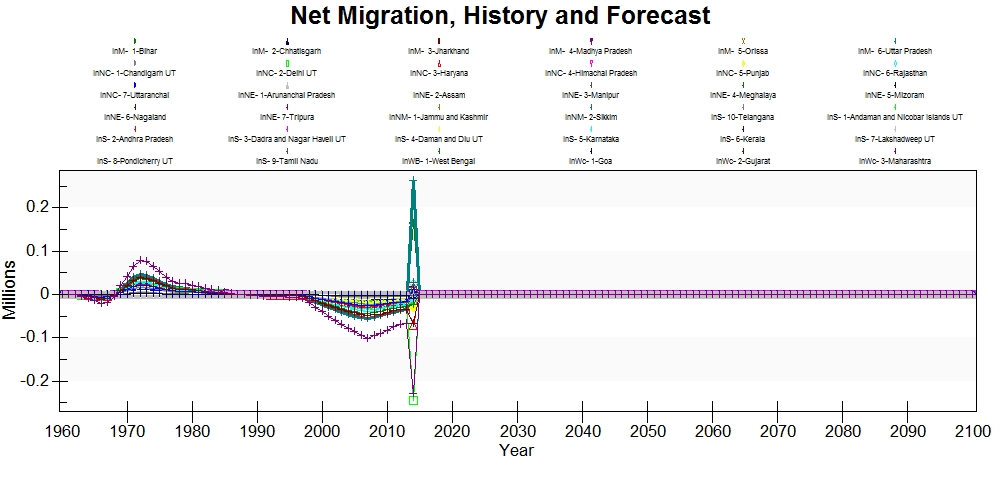
The subregional migration rates for India were calculated using net migration from the 2001 Census. The 2011 Census has not yet released migration data.
PopulationYouthDepend%
The original source for this data was not recorded, but it appears to have originated from the 2011 Census.
