India 2017 Consolidation: Difference between revisions
Jump to navigation
Jump to search
AltheaDitter (talk | contribs) No edit summary |
AltheaDitter (talk | contribs) No edit summary |
||
| Line 5: | Line 5: | ||
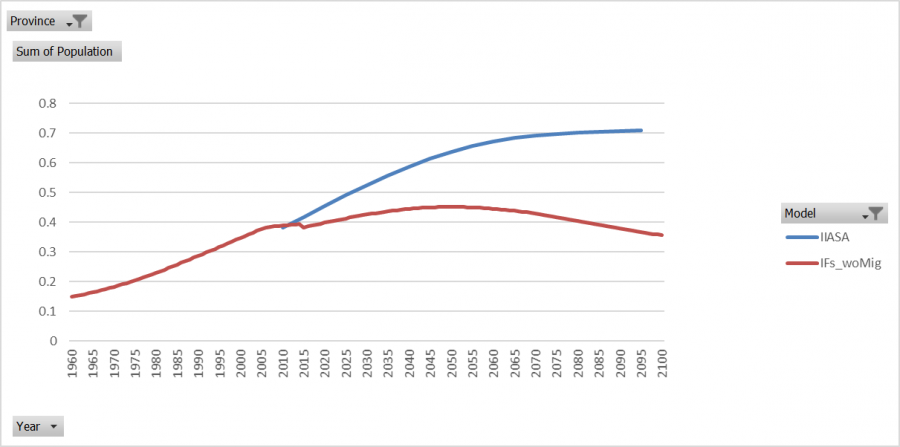
In 2010 the IFs model's population is about 2% greater than IIASA's, but in 2015 Andaman and Nicobar Islands's population drops below IIASA's by about 9%. The IFs model's population forecasts are less than IIASA's by an increasing rate and by 2095 IFs's population forecast is by about 94%. | In 2010 the IFs model's population is about 2% greater than IIASA's, but in 2015 Andaman and Nicobar Islands's population drops below IIASA's by about 9%. The IFs model's population forecasts are less than IIASA's by an increasing rate and by 2095 IFs's population forecast is by about 94%. | ||
[[File:AndamanandNicobarIsPopIIASA.png|900px]] | [[File:AndamanandNicobarIsPopIIASA.png|900px|AndamanandNicobarIsPopIIASA.png]] | ||
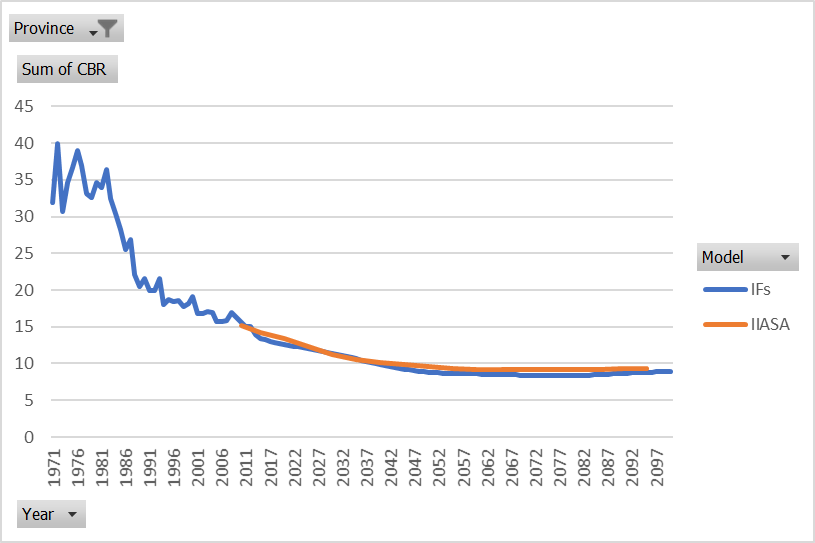
Andaman and Nicobar Island's Crude Birth Rates in IFs are close to IIASA's forecasts. In 2075 and 2080 IFs is less than IIASA by about 10%, but all other years the two models are less than 10% in difference. | |||
[[File:AndamanandNicobarCBRIIASA.png|900px]] | |||
Revision as of 22:44, 6 June 2017
Population Module
Andaman and Nicobar Islands
In 2010 the IFs model's population is about 2% greater than IIASA's, but in 2015 Andaman and Nicobar Islands's population drops below IIASA's by about 9%. The IFs model's population forecasts are less than IIASA's by an increasing rate and by 2095 IFs's population forecast is by about 94%.
Andaman and Nicobar Island's Crude Birth Rates in IFs are close to IIASA's forecasts. In 2075 and 2080 IFs is less than IIASA by about 10%, but all other years the two models are less than 10% in difference.

