India 2017 Consolidation: Difference between revisions
AltheaDitter (talk | contribs) No edit summary |
AltheaDitter (talk | contribs) No edit summary |
||
| Line 27: | Line 27: | ||
==== Population ==== | ==== Population ==== | ||
The IFs model's population forecasts are slightly greater than IIASA's by less than 5% in all years. The average difference between the two models is around a 3%. | The IFs model's population forecasts are slightly greater than IIASA's by less than 5% in all years. The average difference between the two models is around a 3%. [[File:AssamPopIIASA.png|900px|AssamPopIIASA.png]] | ||
==== Crude Birth Rates ==== | ==== Crude Birth Rates ==== | ||
Revision as of 14:24, 7 June 2017
Population Module
Model Vetting Using IIASA's India Model
Andaman and Nicobar Islands
Population
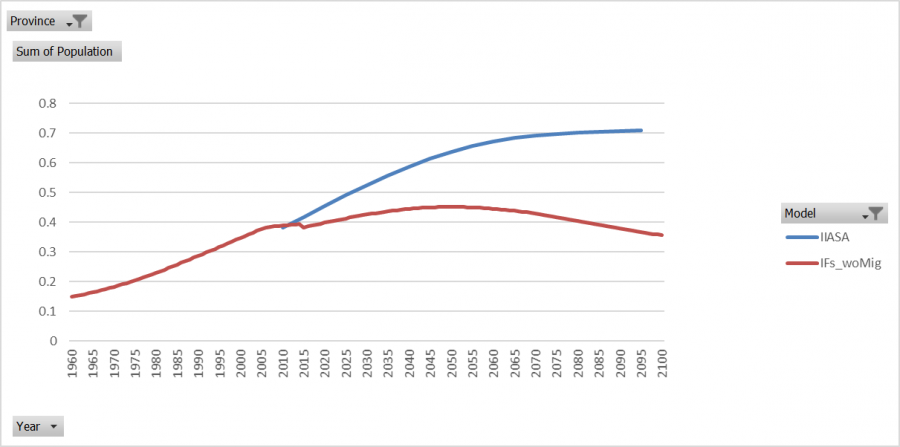
In 2010 the IFs model's population is about 2% greater than IIASA's, but in 2015 Andaman and Nicobar Islands's population drops below IIASA's by about 9%. The IFs model's population forecasts are less than IIASA's by an increasing rate and by 2095 IFs's population forecast is by about 94%.
Crude Birth Rates
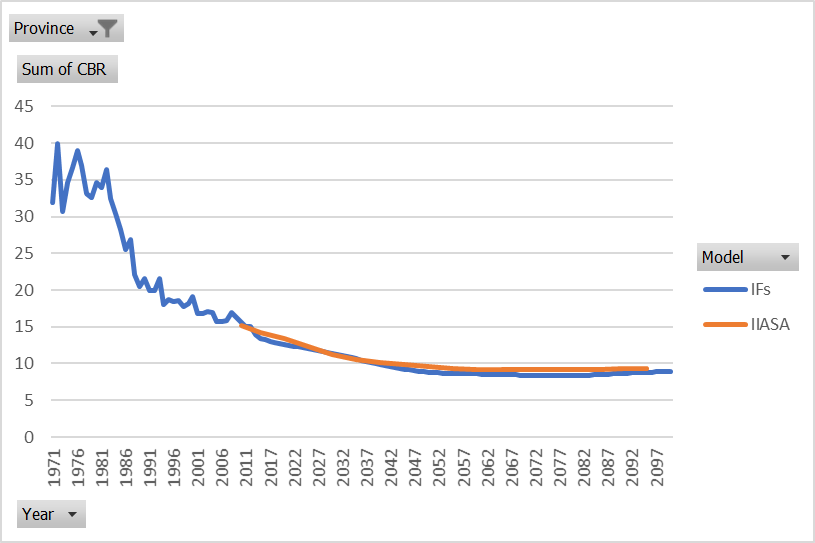
Andaman and Nicobar Island's Crude Birth Rates in IFs are close to IIASA's forecasts. In 2075 and 2080 IFs is less than IIASA by about 10%, but all other years the two models are less than 10% in difference.
Crude Death Rates
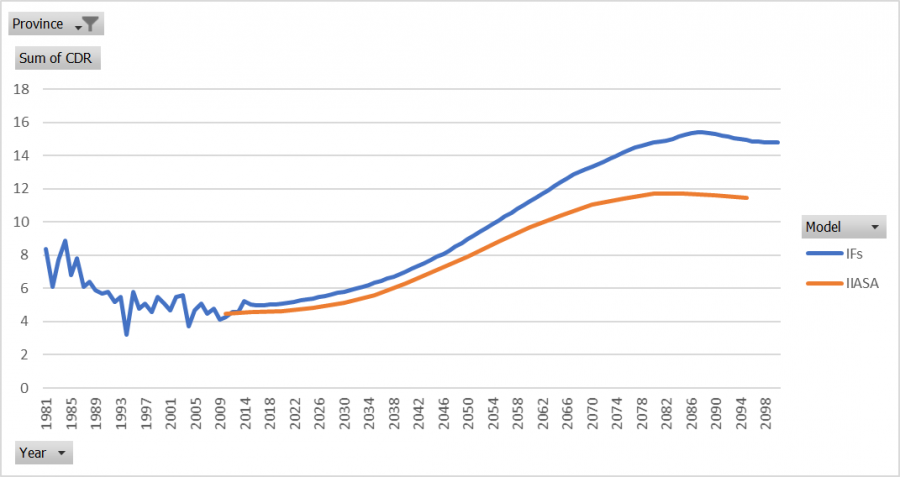
The IFs model's CDRs are significantly greater than IIASA's forecasts. In 2015 the IFs model's CDRs are about 9% greater than IIASA's and by 2095 the difference grows to around 23%.
Assam
Population
The IFs model's population forecasts are slightly greater than IIASA's by less than 5% in all years. The average difference between the two models is around a 3%. 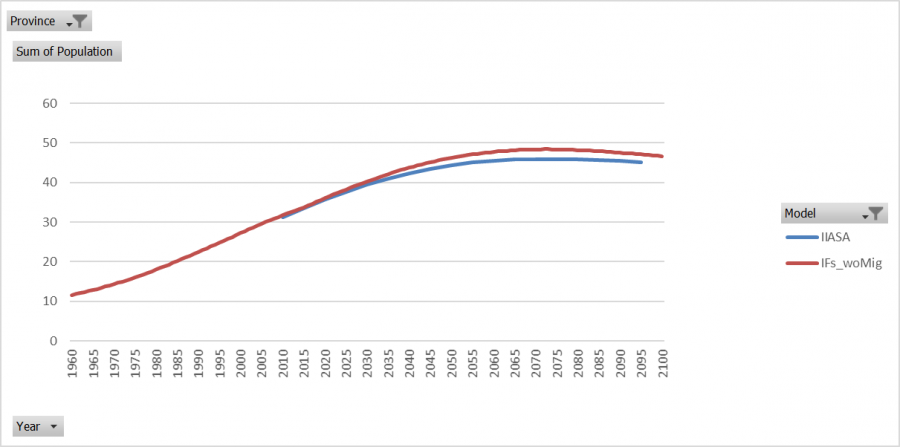
Crude Birth Rates
CBRs are relatively close in the two models. The largest difference is in 2095 where IFs's population forecast is nearly 8% lower than IIASA's. 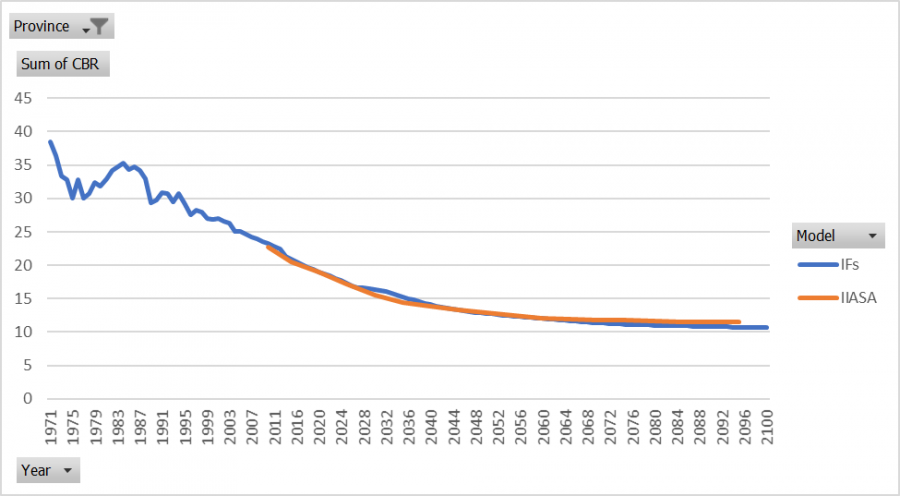
Crude Death Rates
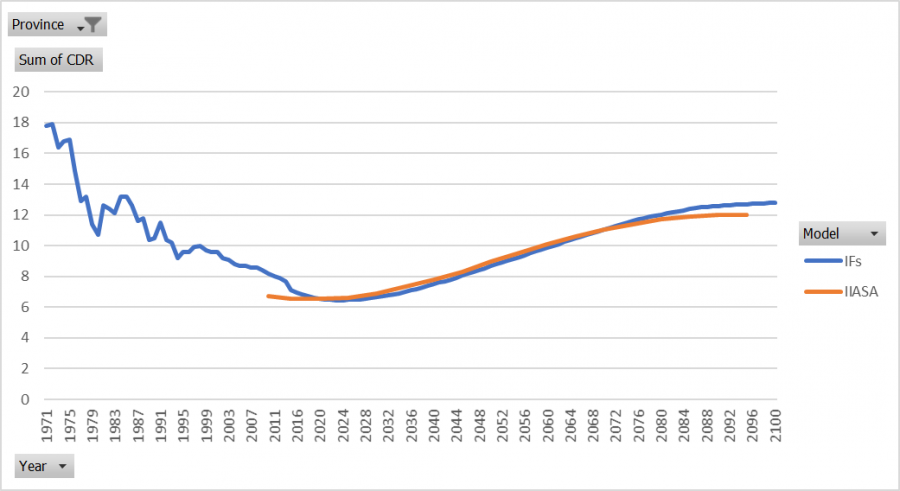
In 2010 there is an 18% difference between IIASA and IFs's historical data. By 2015 the two models are very close and IIASA is greater than IFs until around 2070. After 2070 IFs' CDRs are greater than IIASA's by an increasing rate. From 2015 through 2100 there is not a difference between the two models that is greater than 5.5%.
