India 2017 Consolidation: Difference between revisions
AltheaDitter (talk | contribs) No edit summary |
AltheaDitter (talk | contribs) No edit summary |
||
| Line 1: | Line 1: | ||
= Population Module = | = Population Module = | ||
IFs population module may have some problems in sub-regional migration, that require further research in the future. Migration is an exogenous variable based upon UNPD forecasts of net migration rates in the model. In the case of sub-regional models it is frequently difficult to find sub-regional forecasts of migration. Additionally, there is two errors that occur when the model is broken out with sub-regional migration forecast data. The first is this: | |||
== Model Vetting Using IIASA's India Model == | == Model Vetting Using IIASA's India Model == | ||
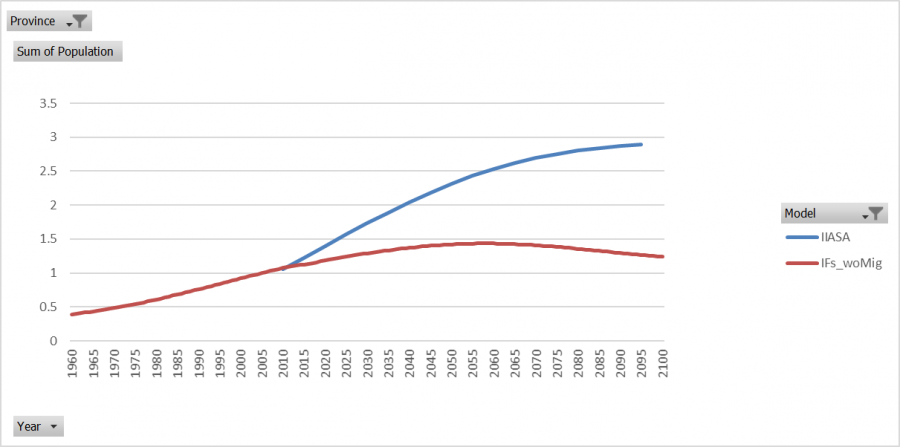
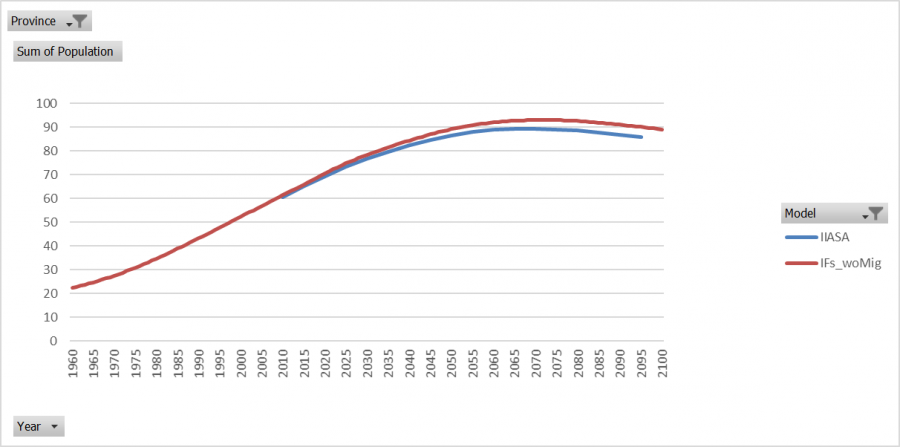
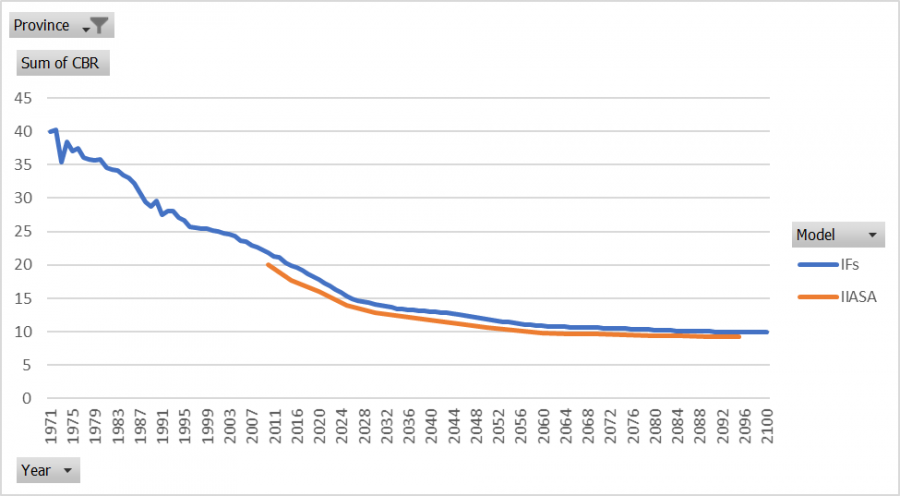
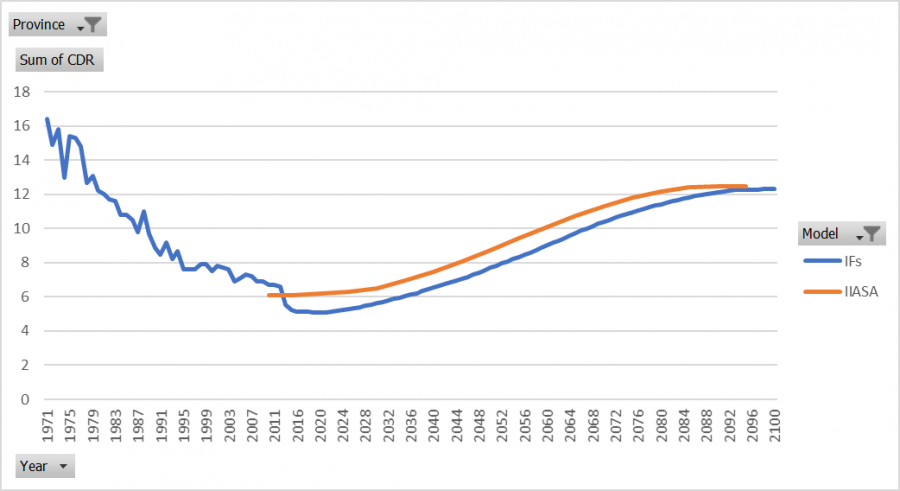
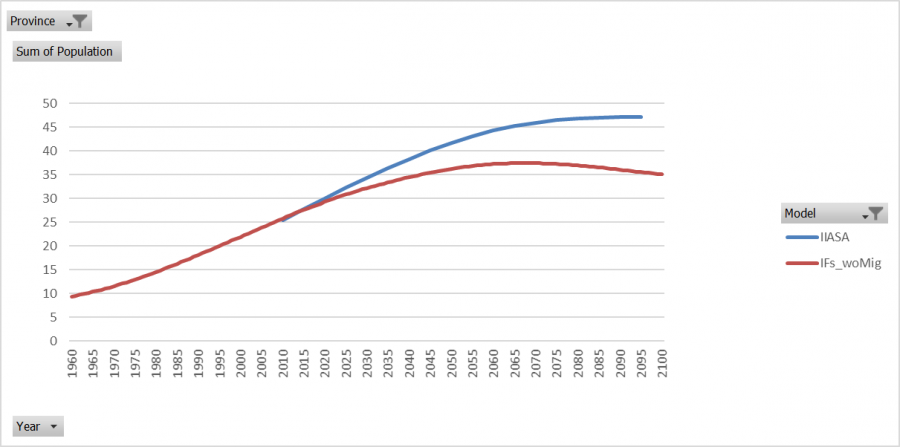
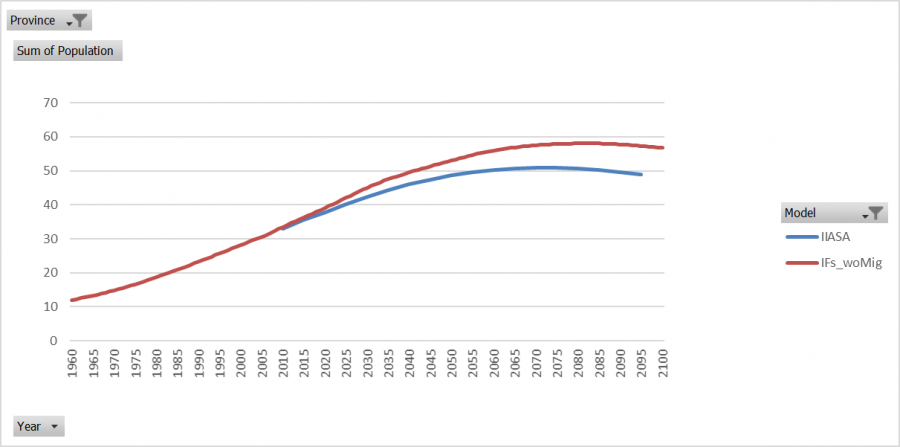
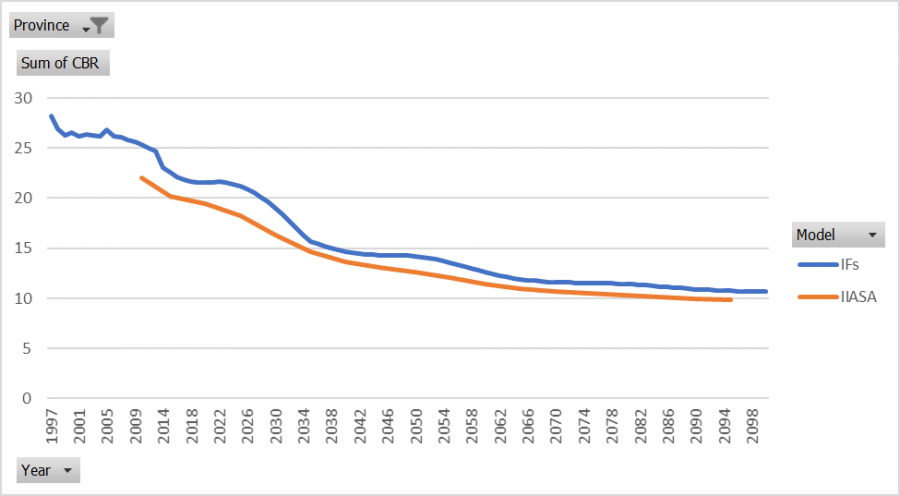
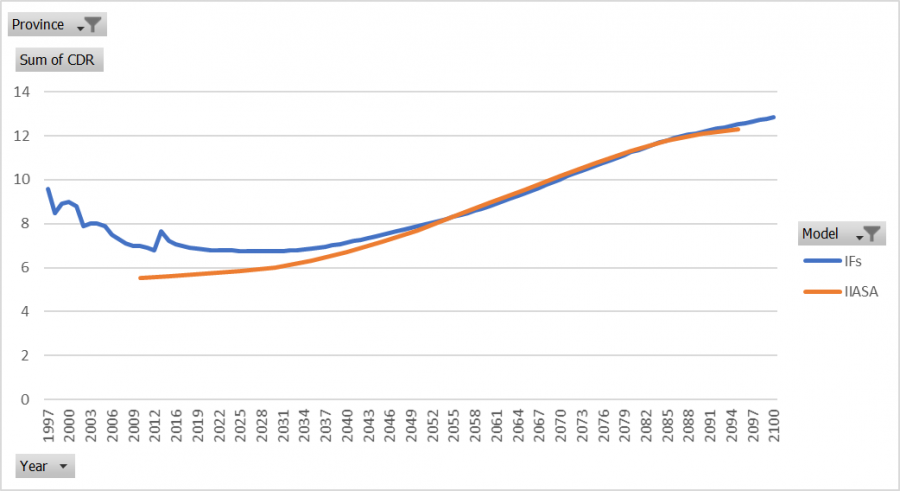
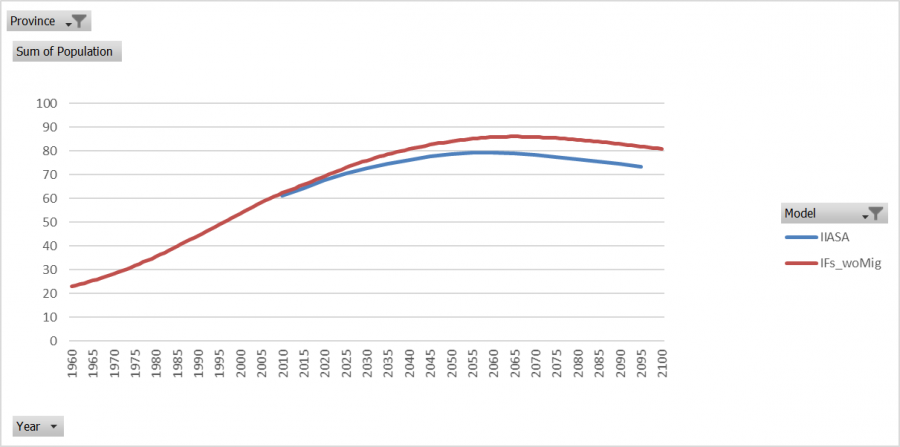
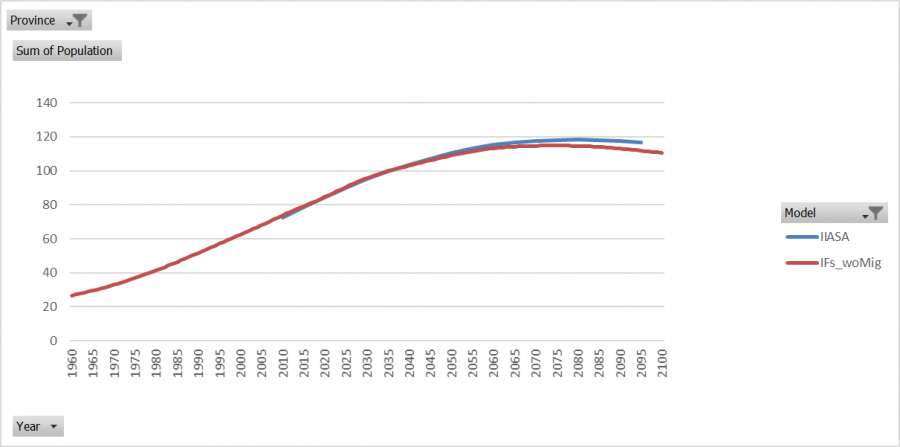
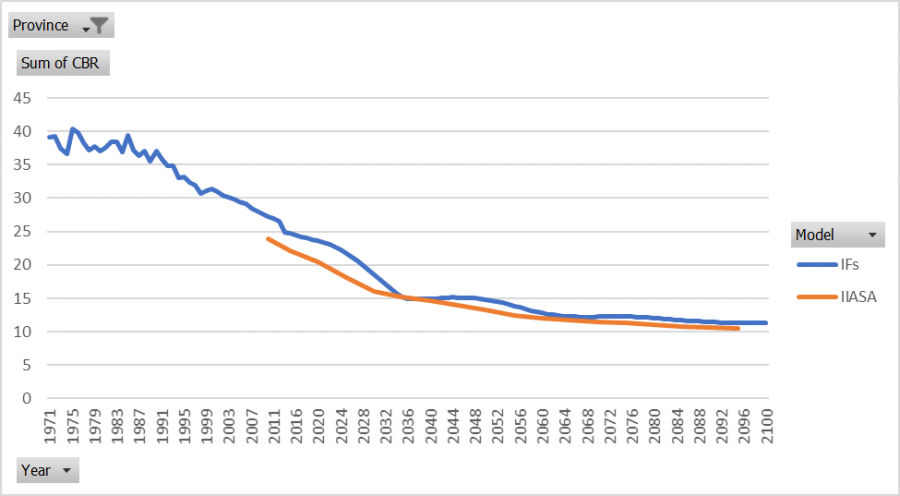
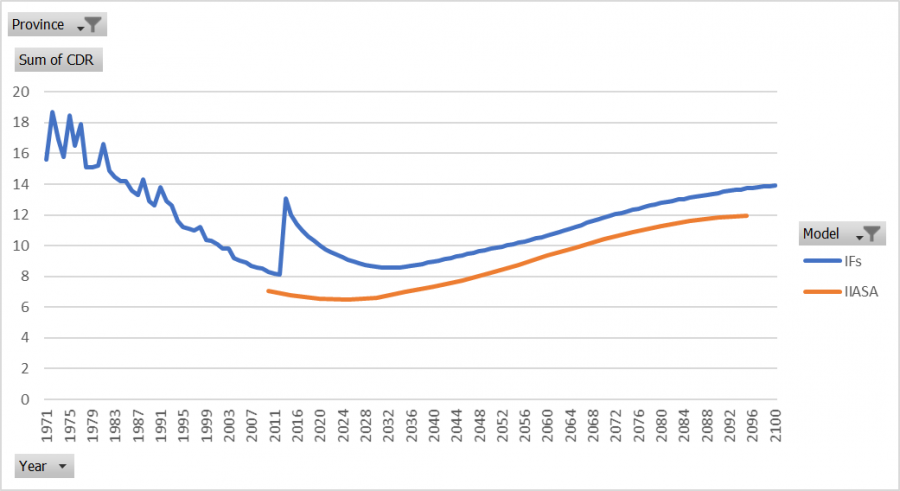
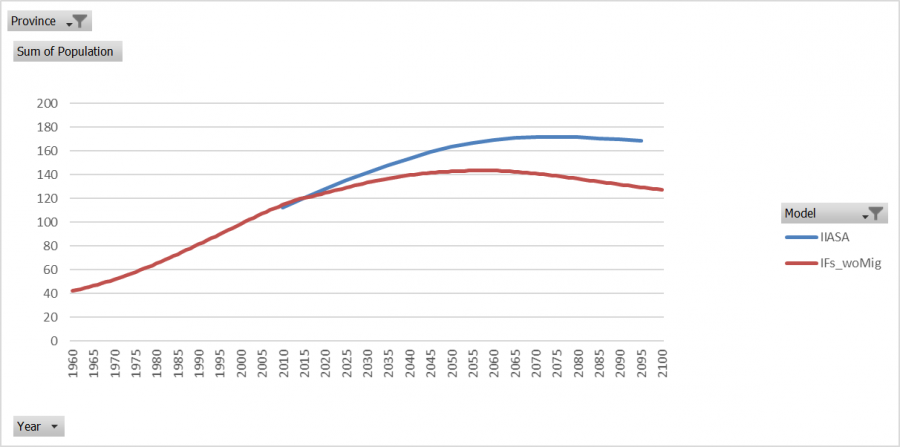
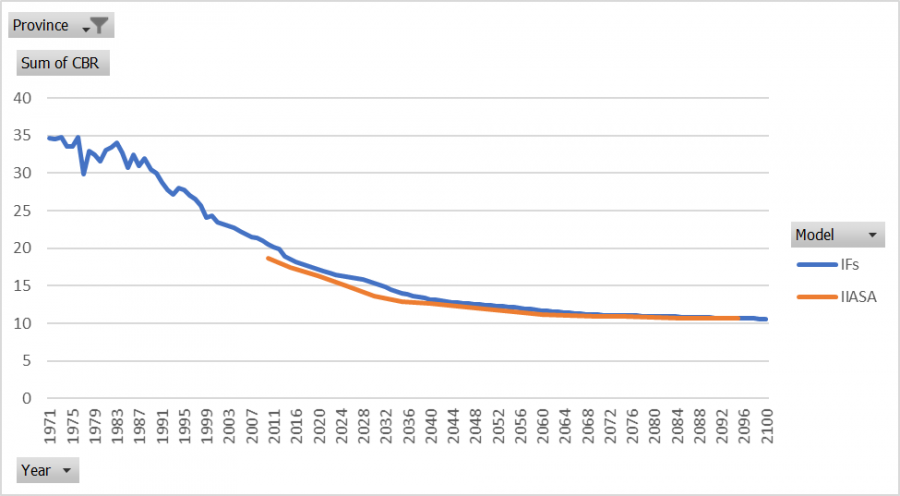
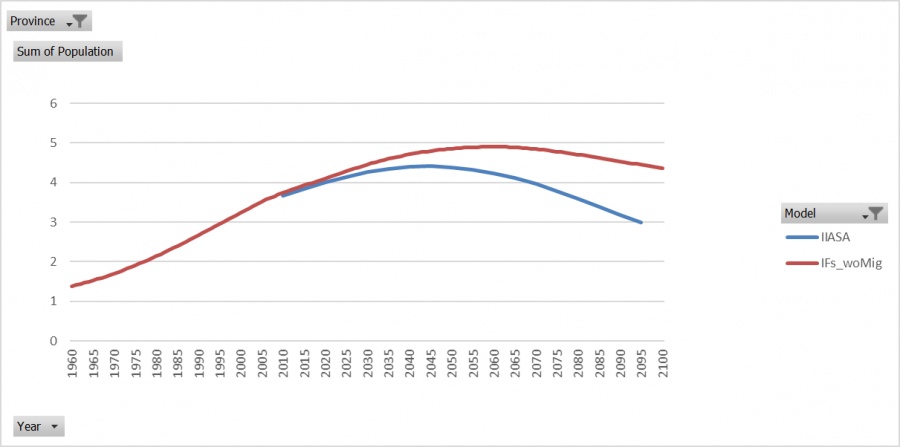
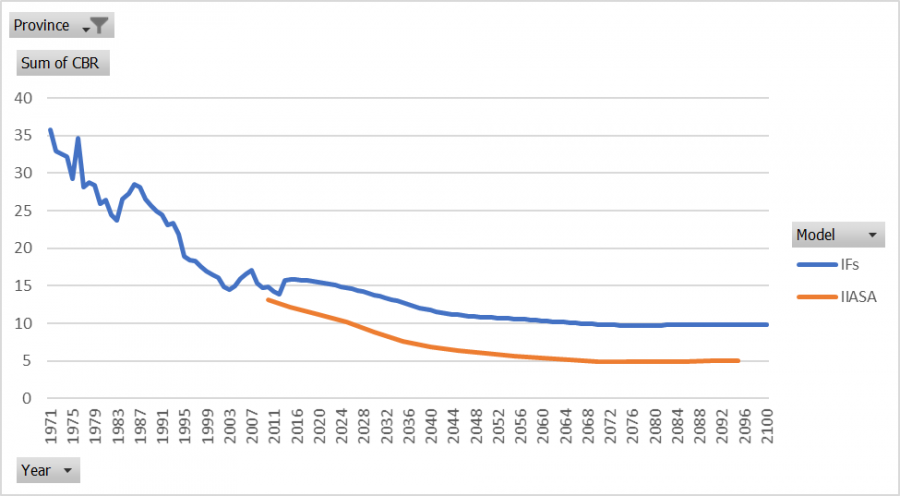
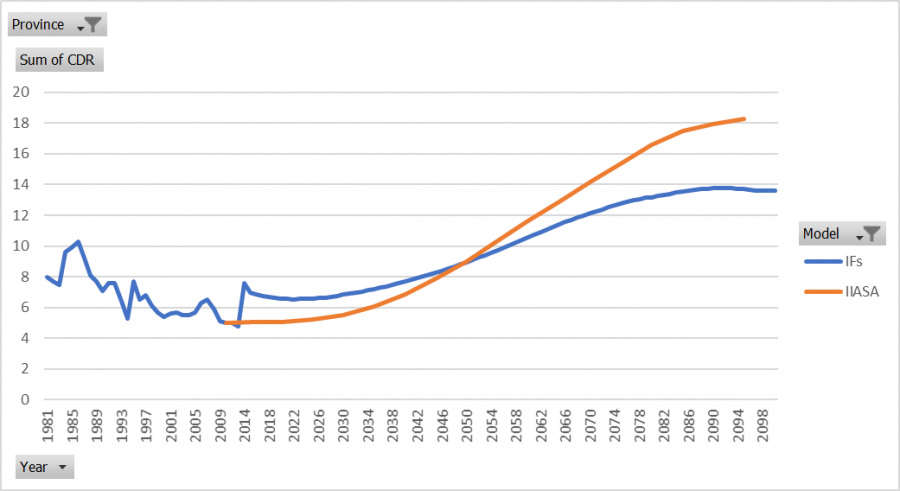
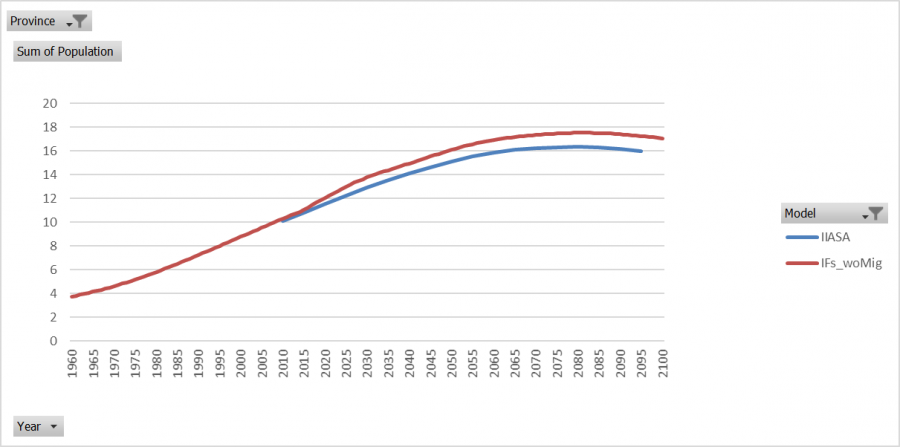
India's subnational population was rigorously vetted and one of the tools available was subnational population forecasts that were developed by IIASA. These forecasts were compared with each state and territory in India, as were the components of these forecasts. The components include births, deaths, and migration. Below is a state-by -state comparison of the IFs base case (without migration) with IIASA's forecasts followed by recommendations for model calibration. | India's subnational population was rigorously vetted and one of the tools available was subnational population forecasts that were developed by IIASA. These forecasts were compared with each state and territory in India, as were the components of these forecasts. The components include births, deaths, and migration. Below is a state-by -state comparison of the IFs base case (without migration) with IIASA's forecasts followed by recommendations for model calibration. | ||
Two states are missing from this analysis, Andhra Pradesh and Telangana. They were not included because IIASA's forecasts only have Andhra Pradesh, which includes Telangana. Whereas, the IFs model has Andhra Pradesh and Telangana separated. | Two states are missing from this analysis, Andhra Pradesh and Telangana. They were not included because IIASA's forecasts only have Andhra Pradesh, which includes Telangana. Whereas, the IFs model has Andhra Pradesh and Telangana separated. | ||
Revision as of 15:56, 8 June 2017
Population Module
IFs population module may have some problems in sub-regional migration, that require further research in the future. Migration is an exogenous variable based upon UNPD forecasts of net migration rates in the model. In the case of sub-regional models it is frequently difficult to find sub-regional forecasts of migration. Additionally, there is two errors that occur when the model is broken out with sub-regional migration forecast data. The first is this:
Model Vetting Using IIASA's India Model
India's subnational population was rigorously vetted and one of the tools available was subnational population forecasts that were developed by IIASA. These forecasts were compared with each state and territory in India, as were the components of these forecasts. The components include births, deaths, and migration. Below is a state-by -state comparison of the IFs base case (without migration) with IIASA's forecasts followed by recommendations for model calibration.
Two states are missing from this analysis, Andhra Pradesh and Telangana. They were not included because IIASA's forecasts only have Andhra Pradesh, which includes Telangana. Whereas, the IFs model has Andhra Pradesh and Telangana separated.
Andaman and Nicobar Islands
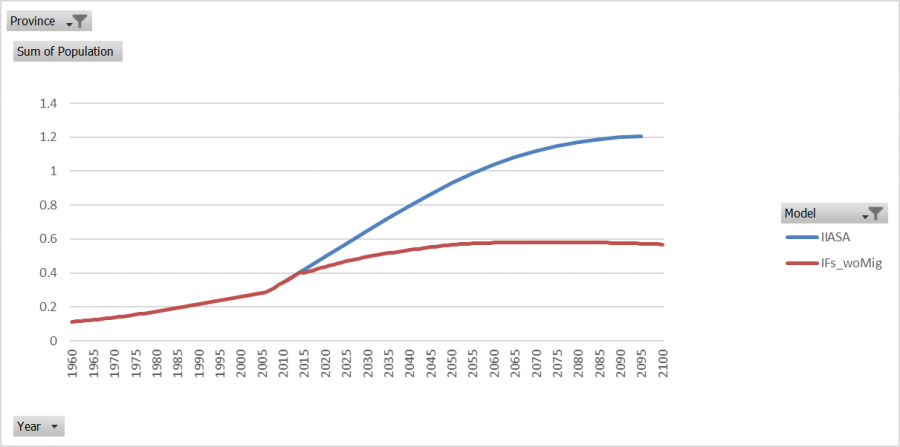
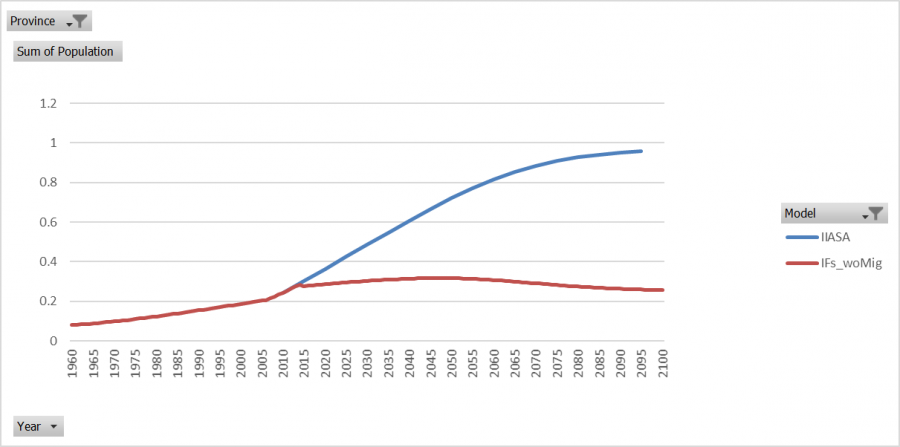
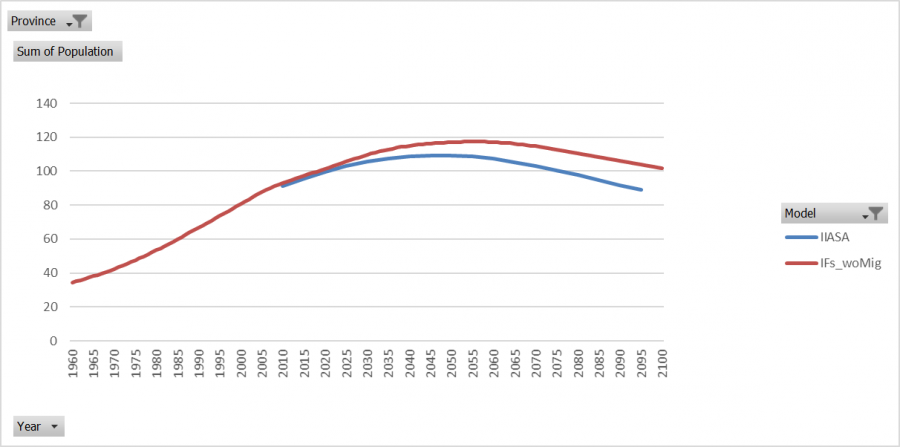
Population
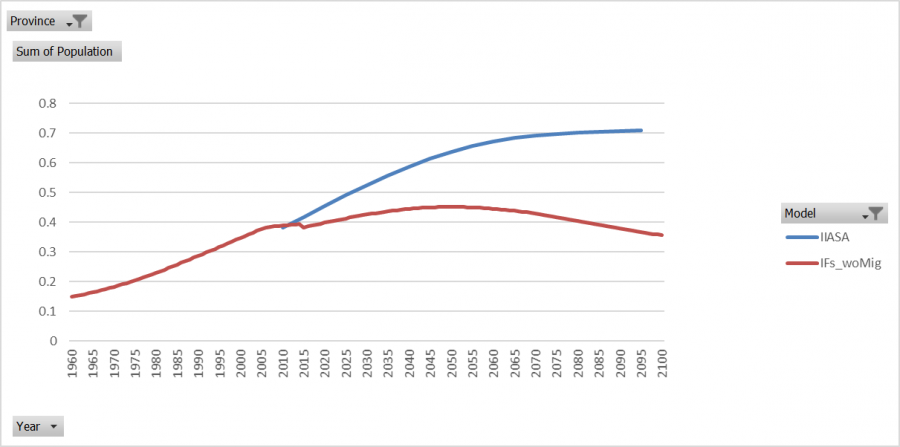
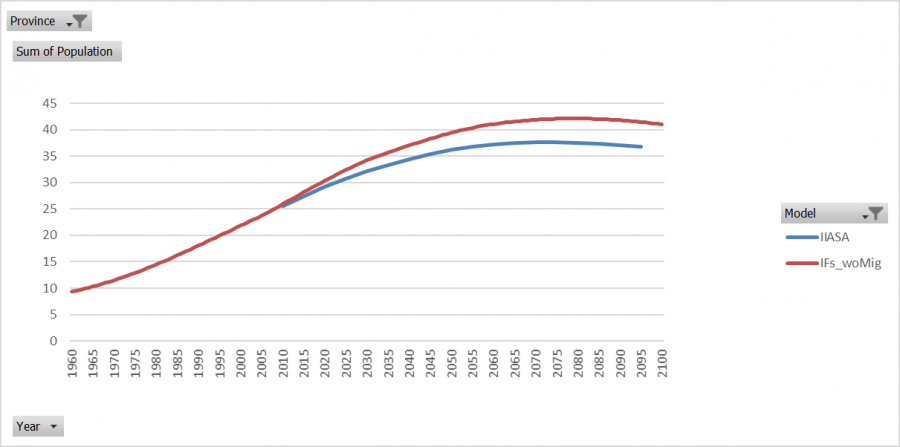
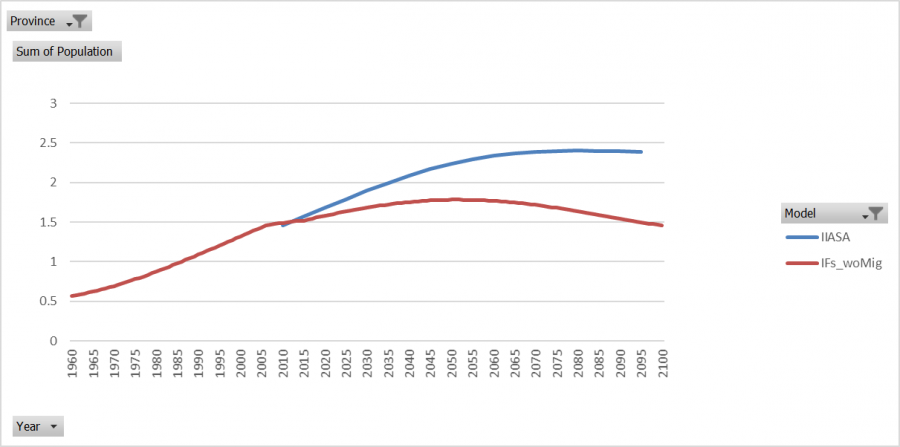
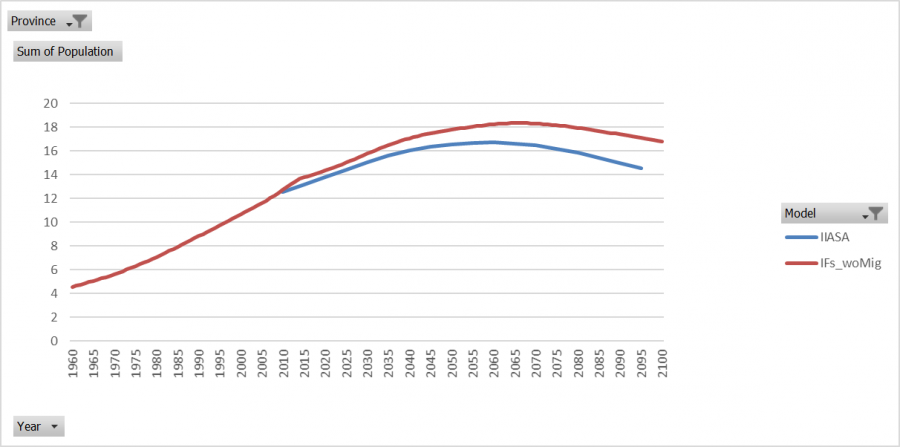
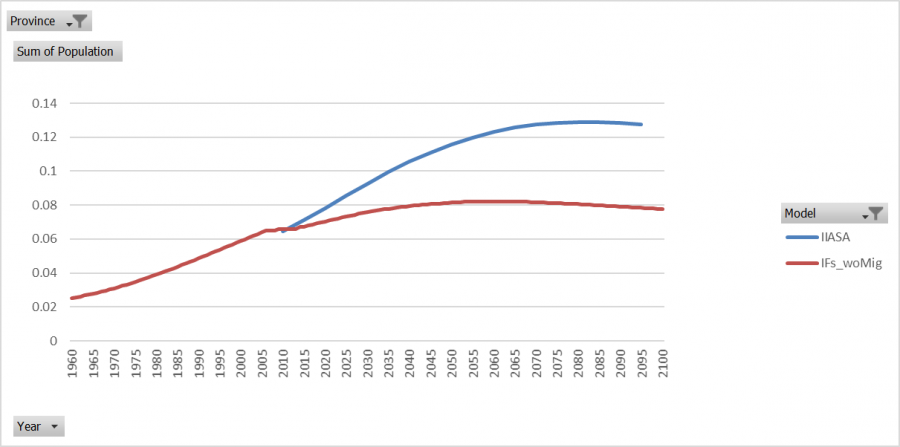
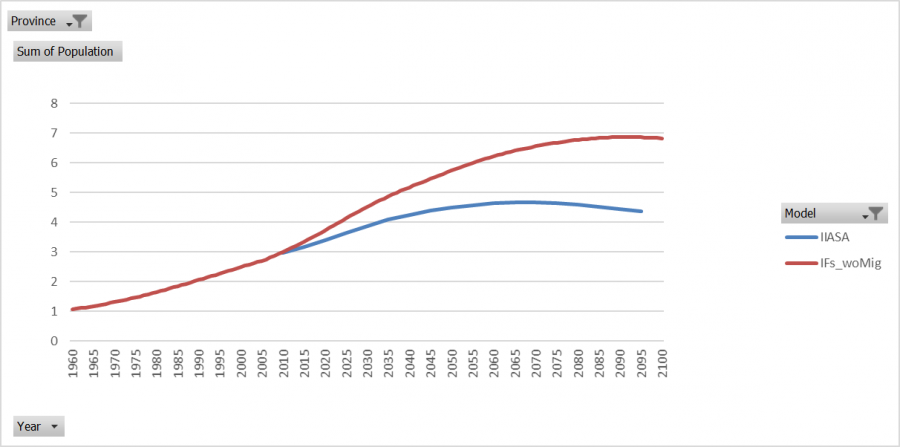
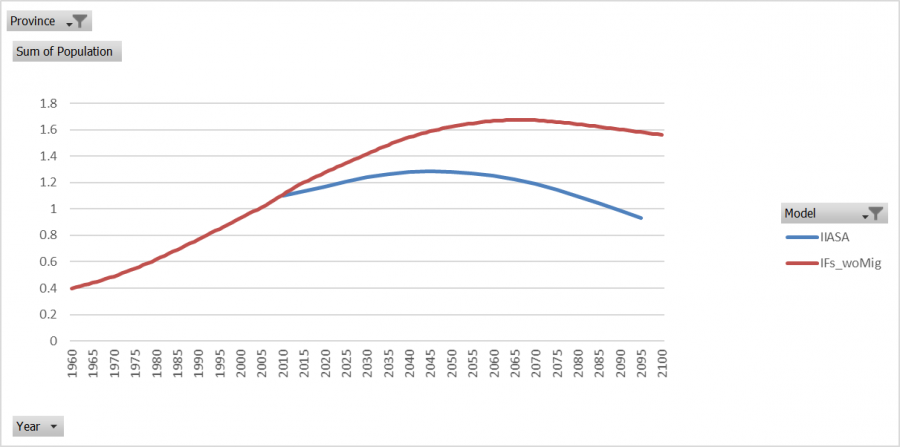
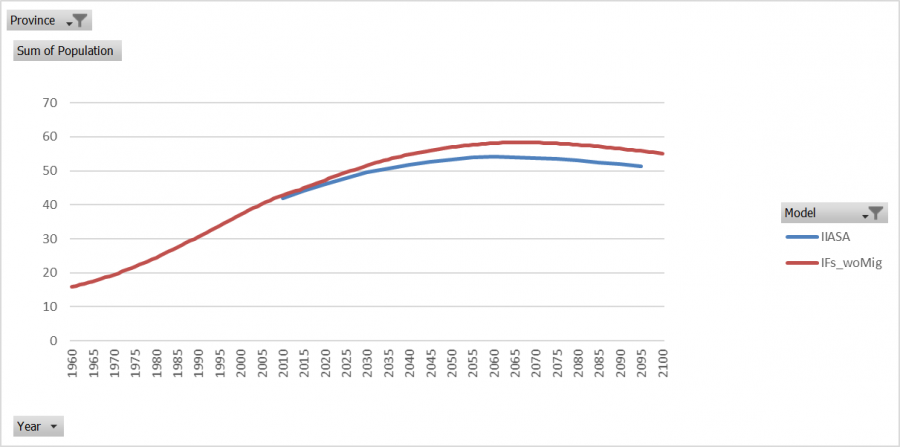
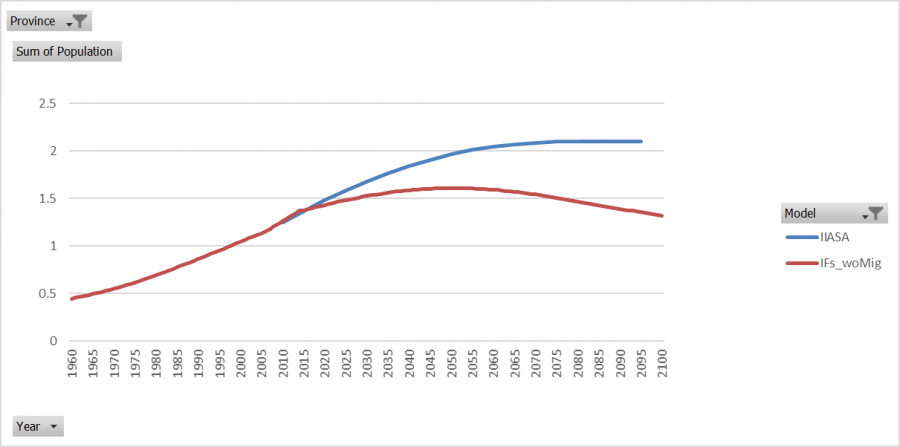
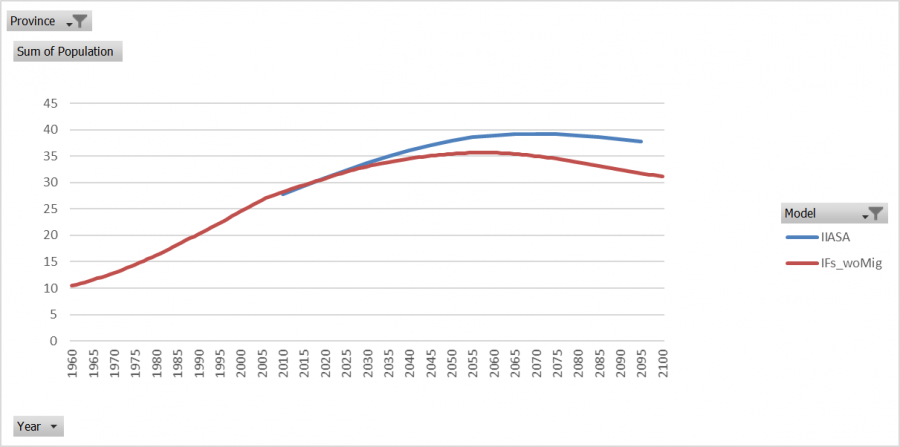
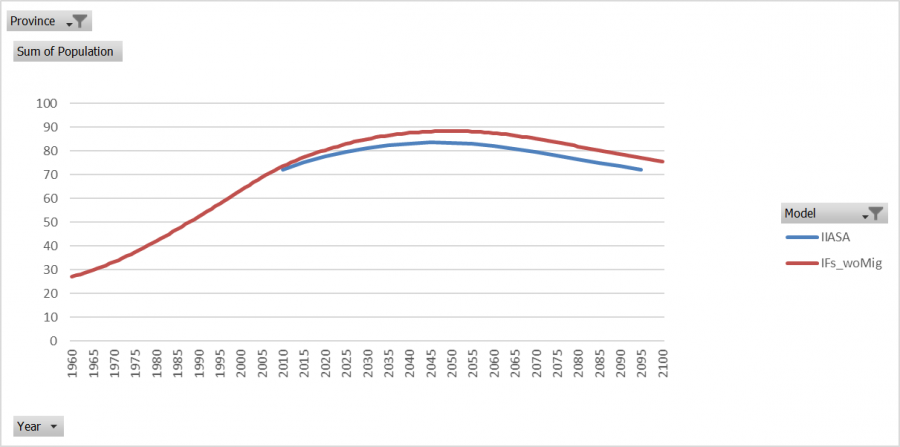
In 2010 the IFs model's population is about 2% greater than IIASA's, but in 2015 Andaman and Nicobar Islands's population drops below IIASA's by about 9%. The IFs model's population forecasts are less than IIASA's by an increasing rate and by 2095 IFs's population forecast is by about 94%.
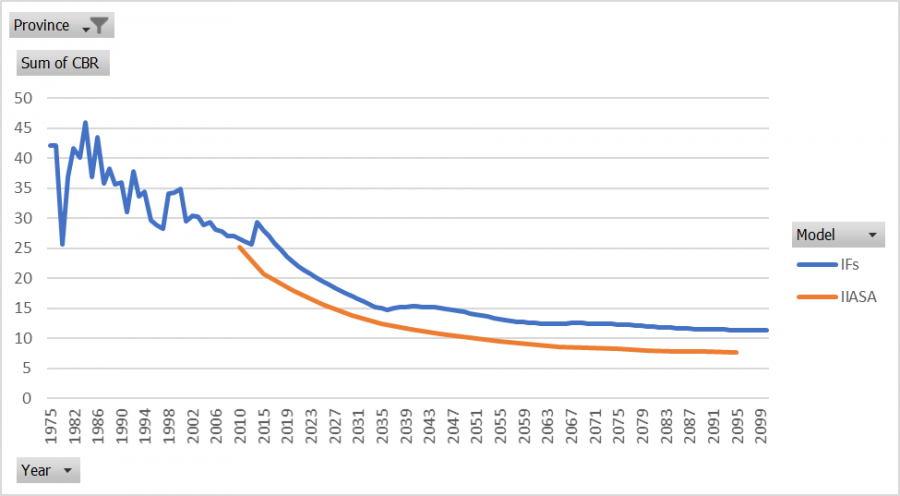
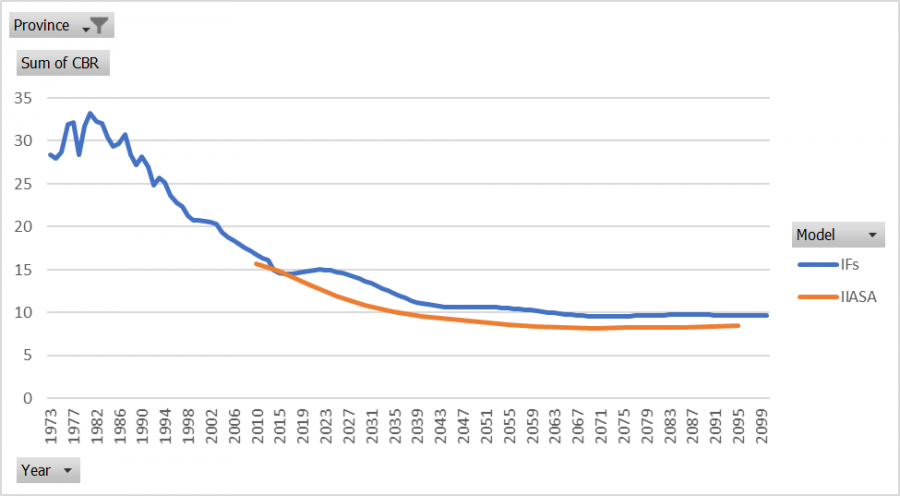
Crude Birth Rates
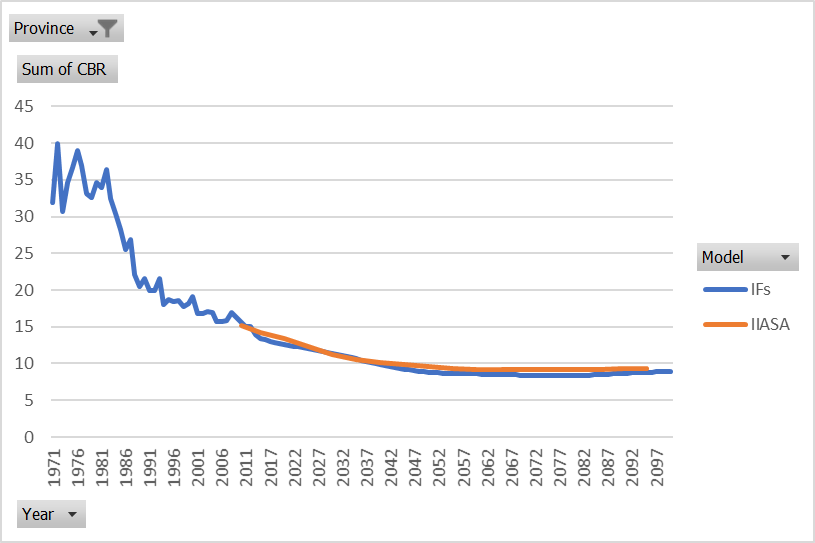
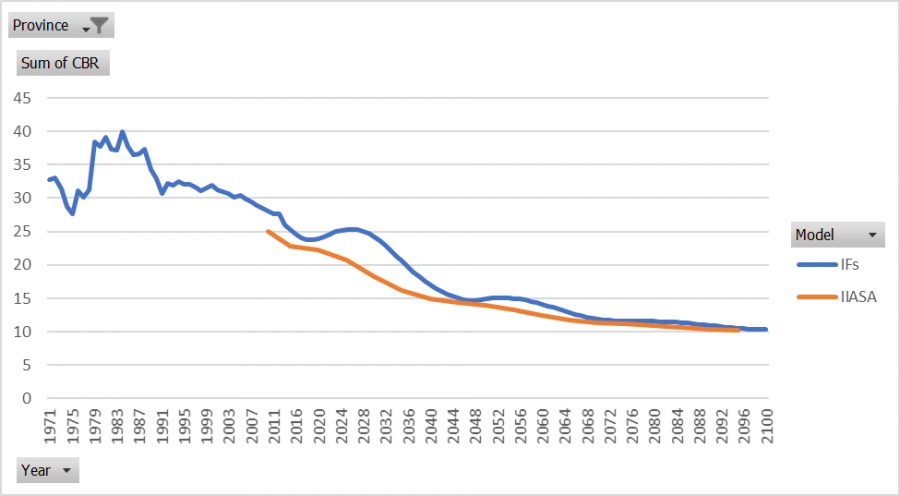
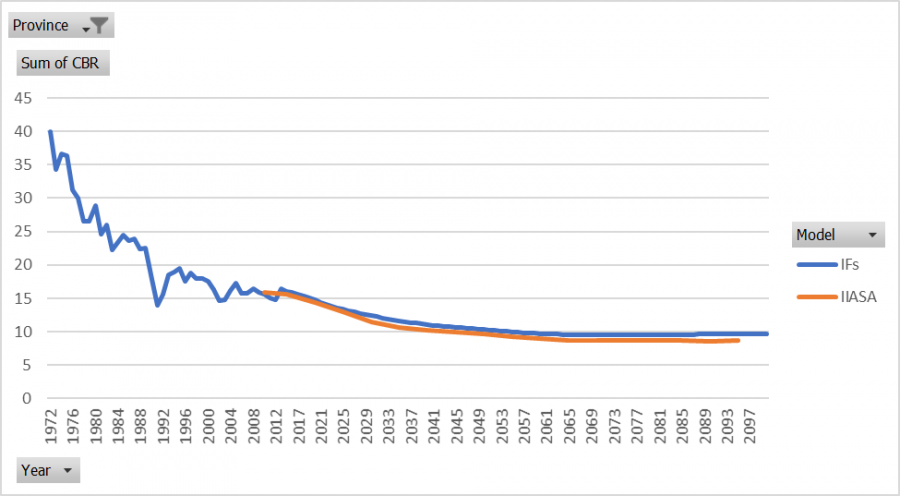
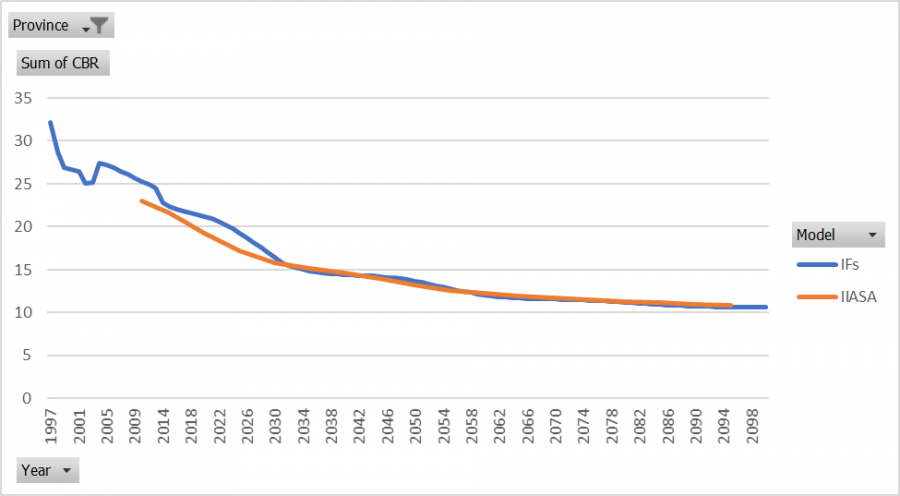
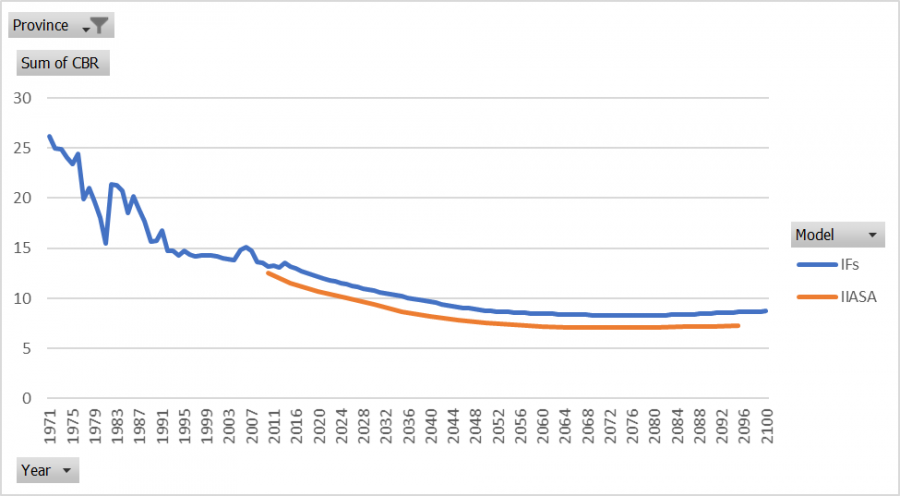
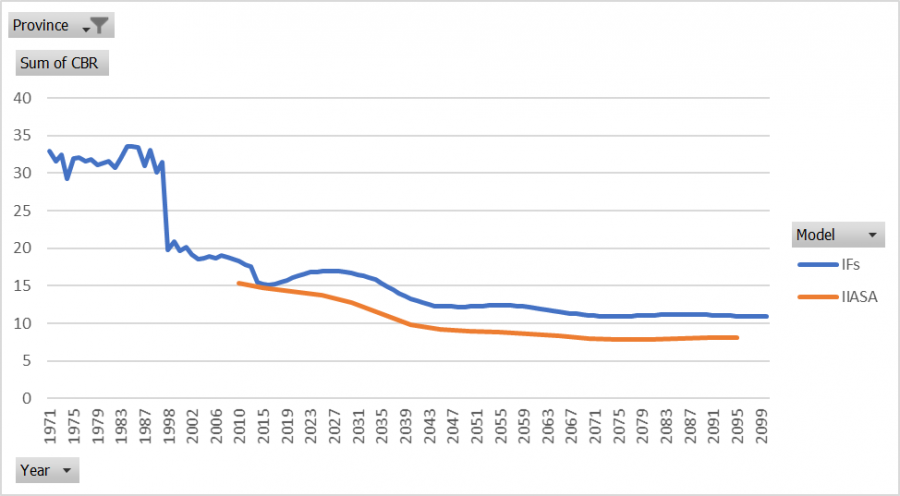
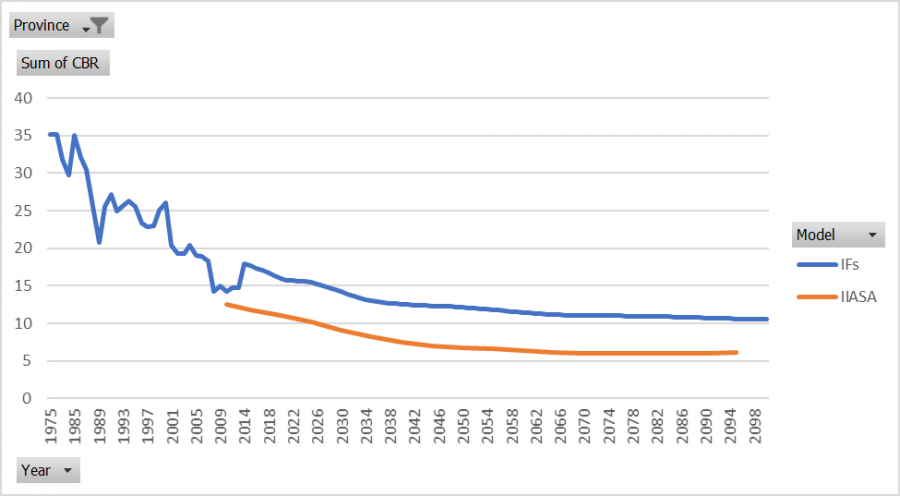
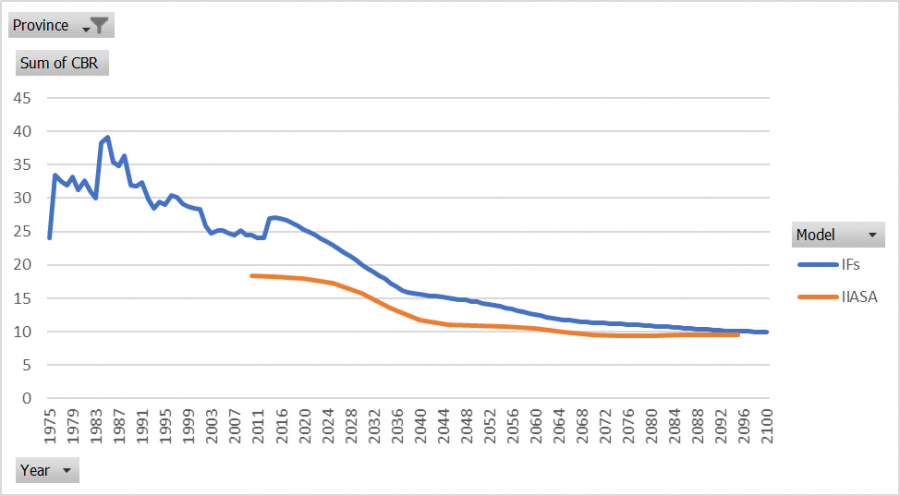
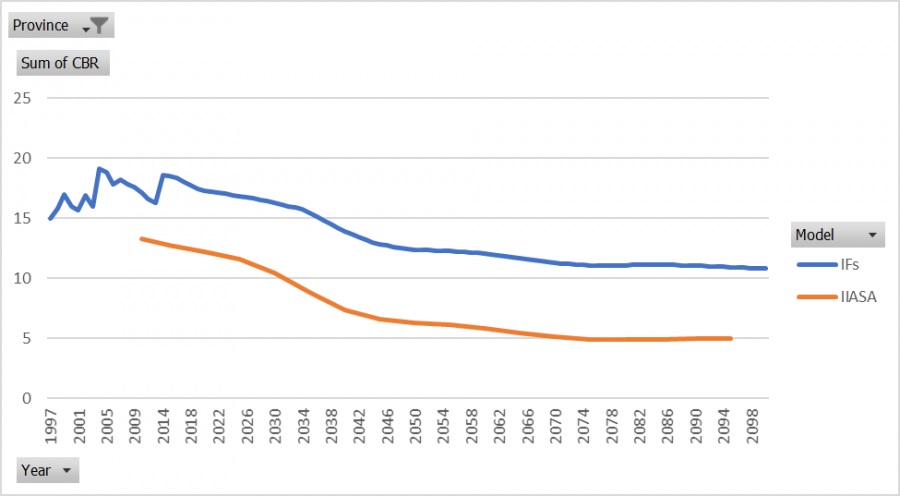
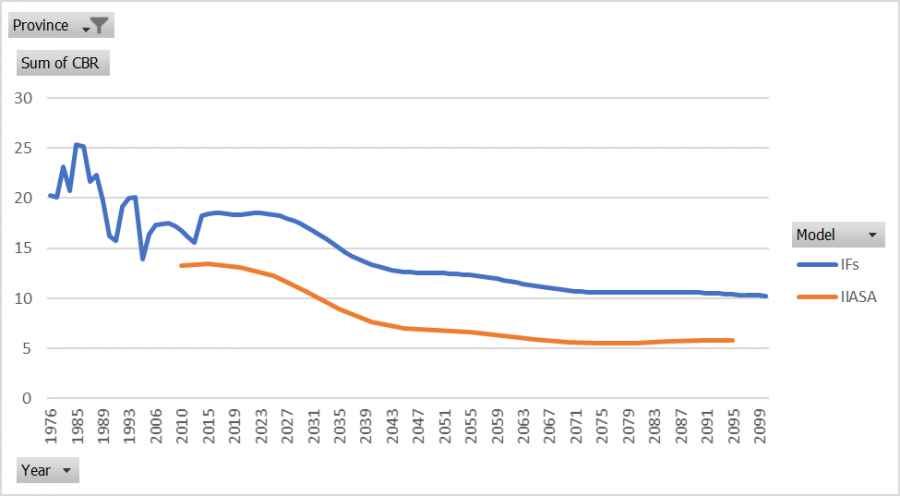
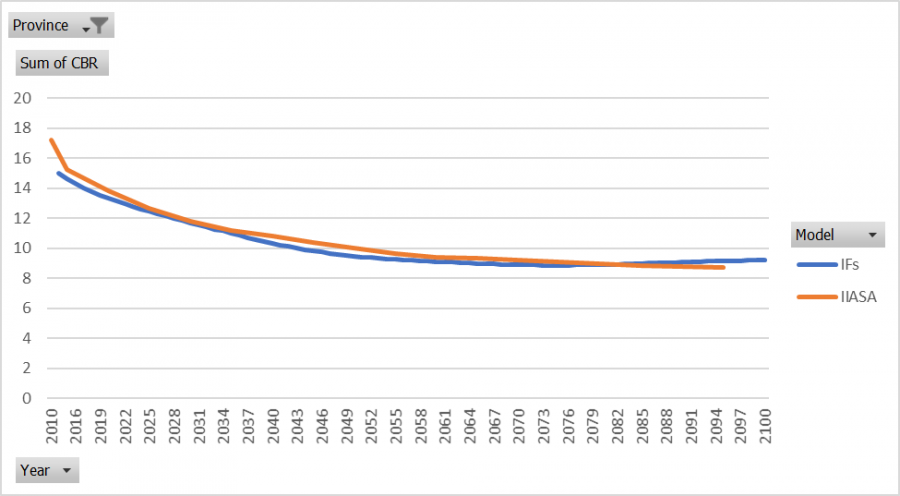
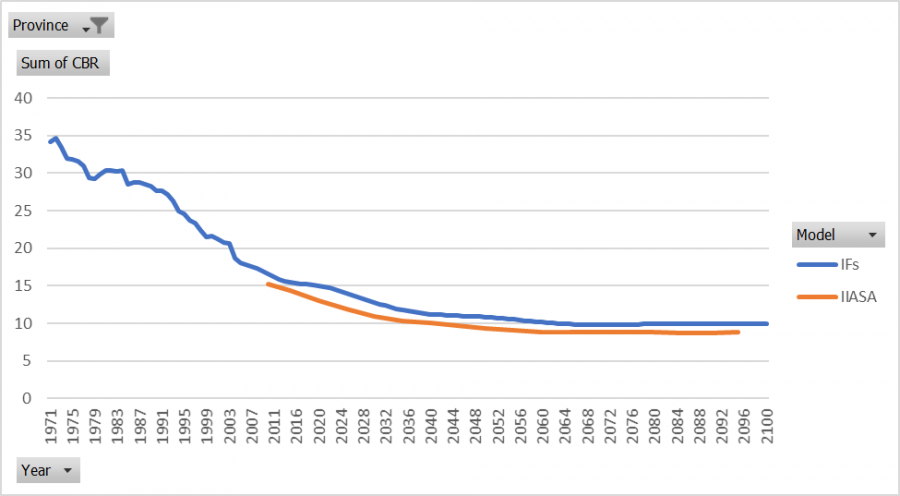
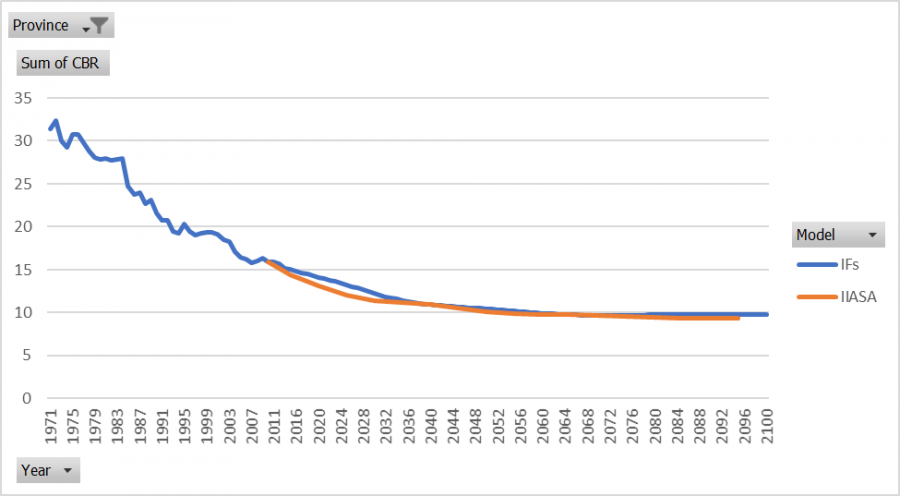
Andaman and Nicobar Island's Crude Birth Rates in IFs are close to IIASA's forecasts. In 2075 and 2080 IFs is less than IIASA by about 10%, but all other years the two models are less than 10% in difference.
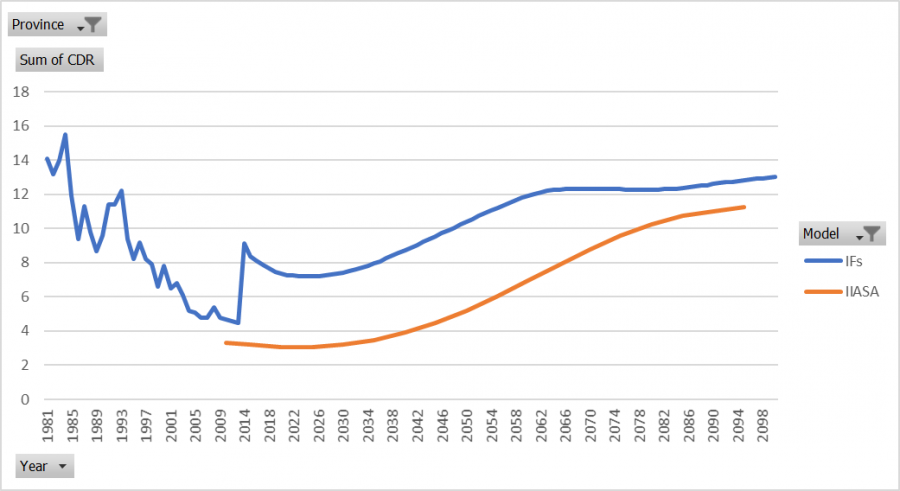
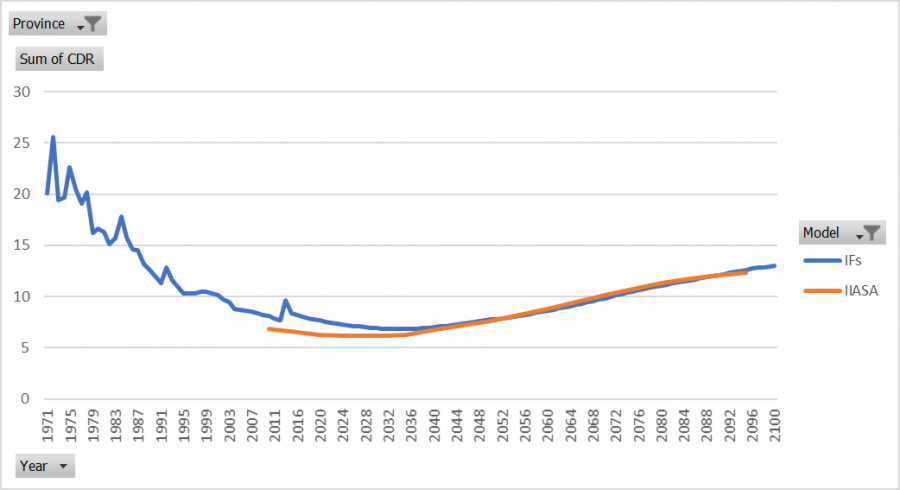
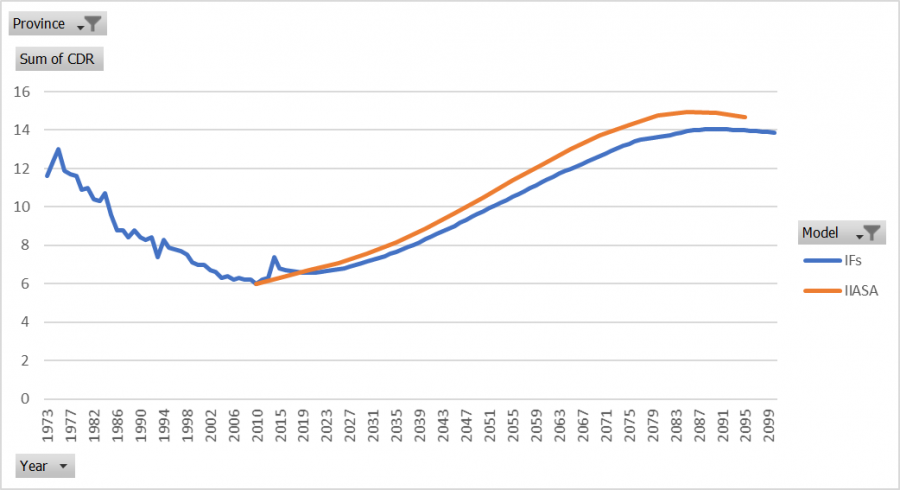
Crude Death Rates
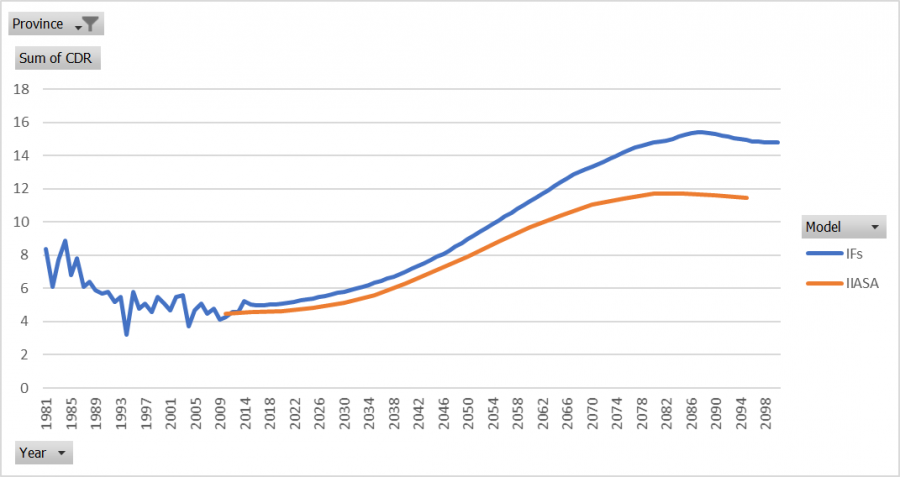
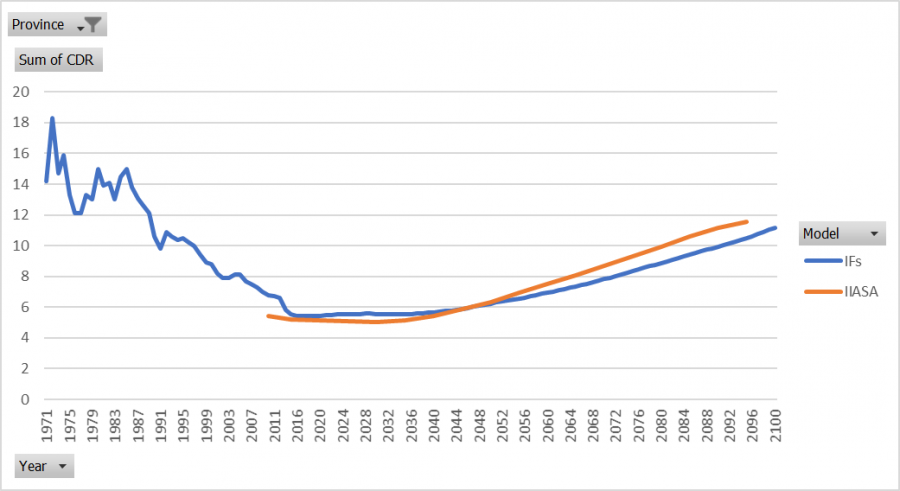
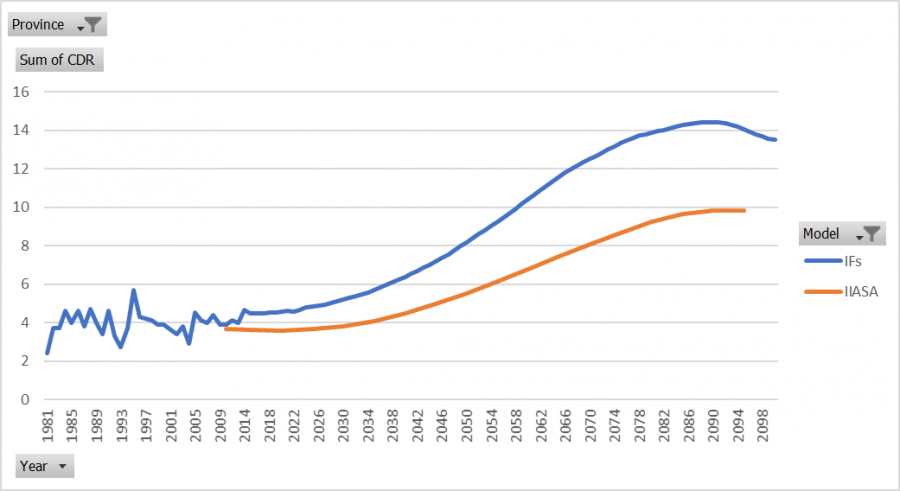
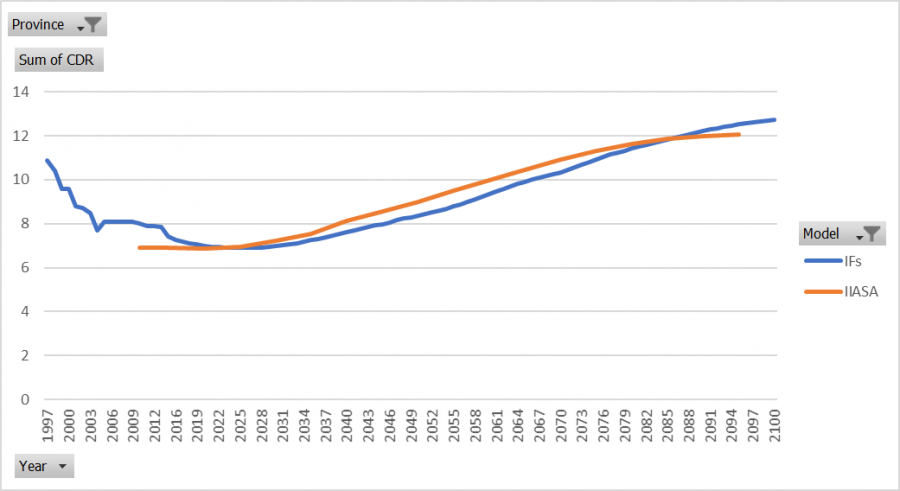
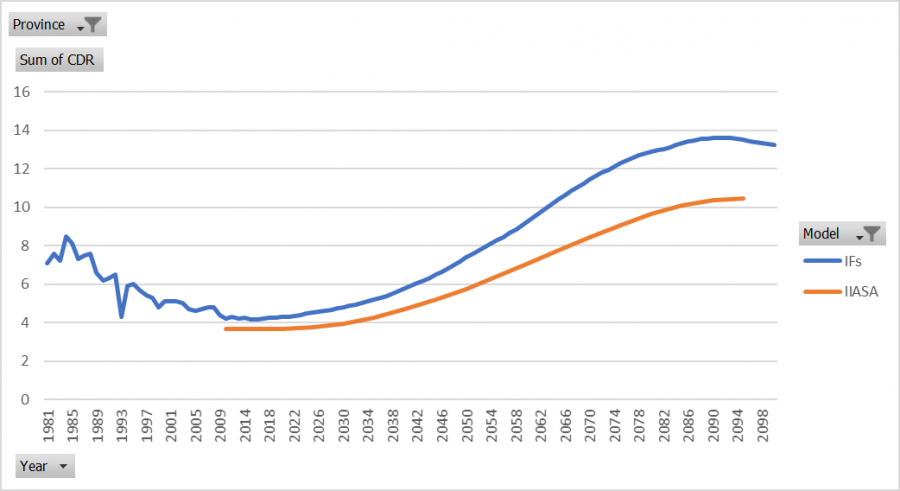
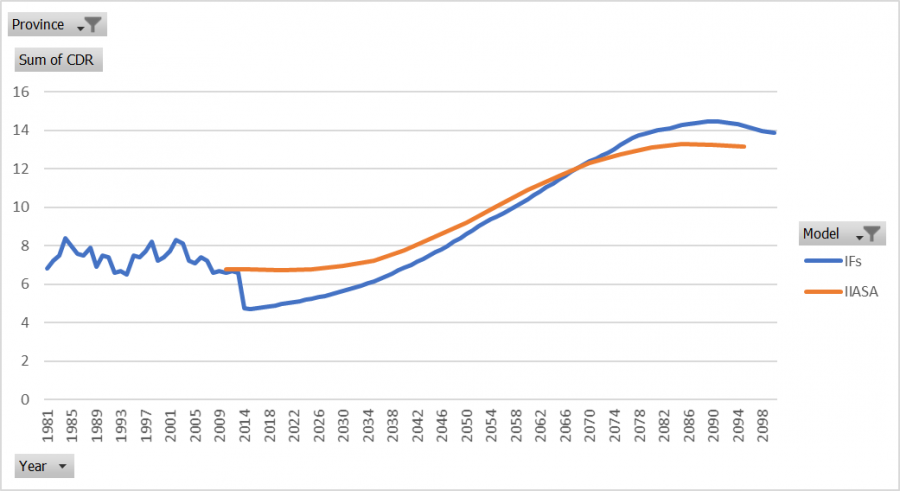
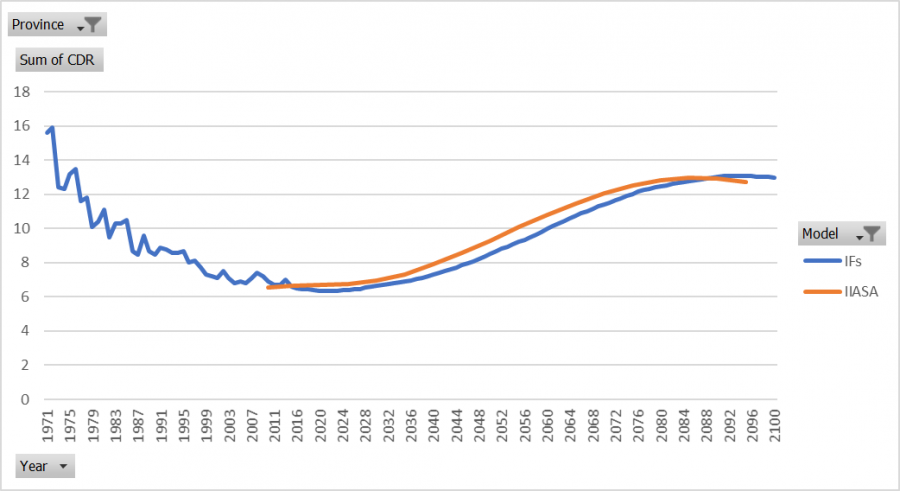
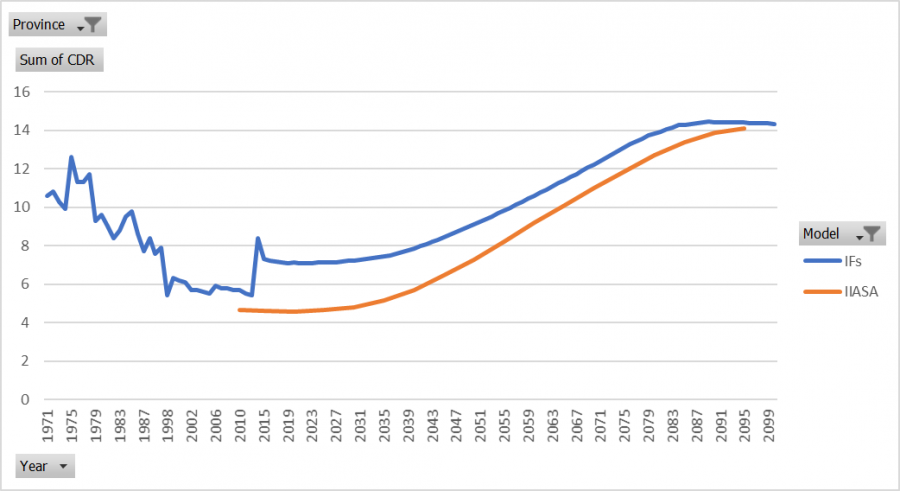
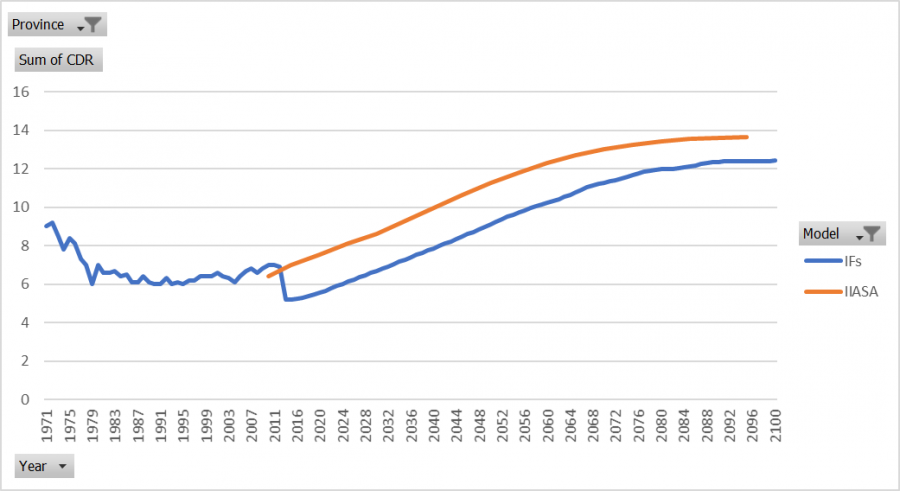
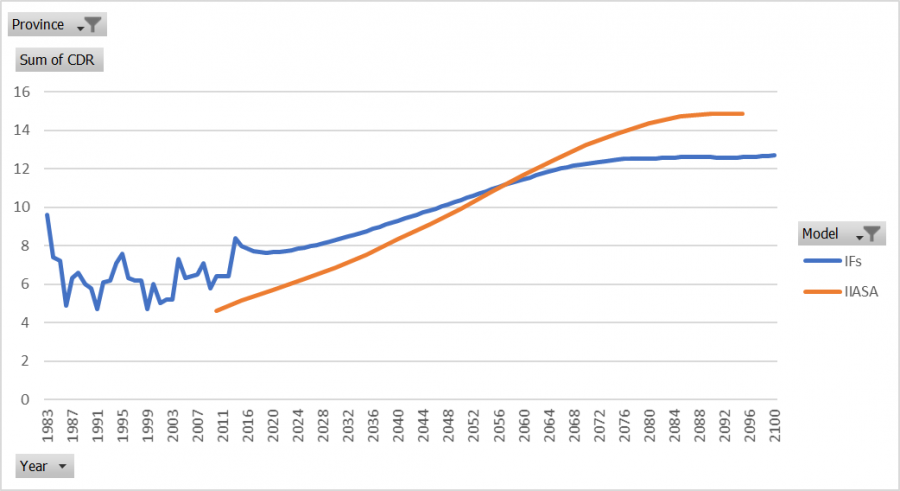
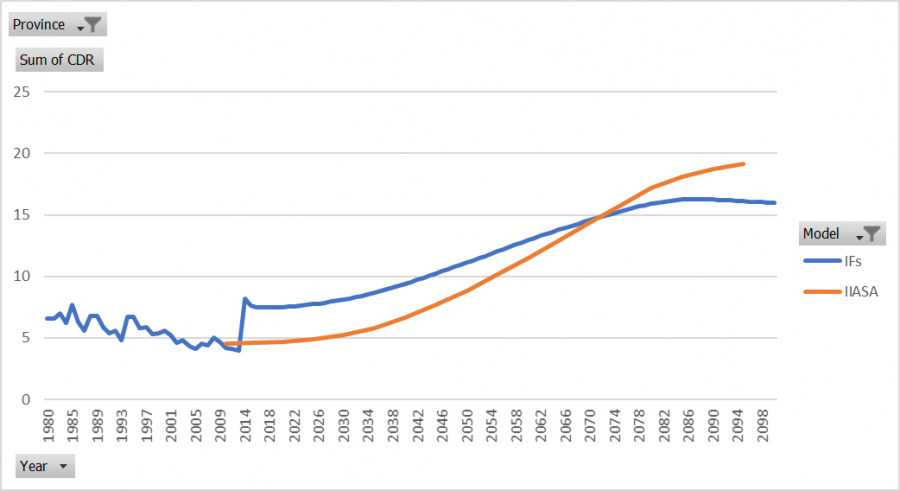
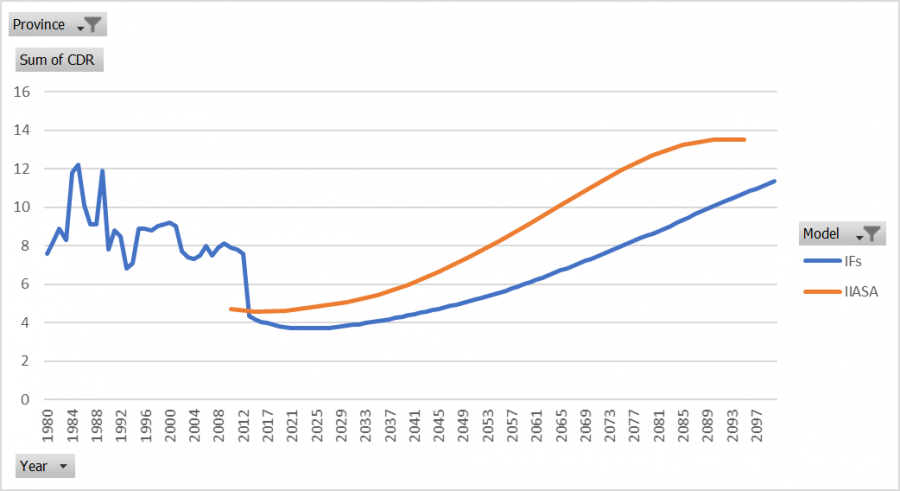
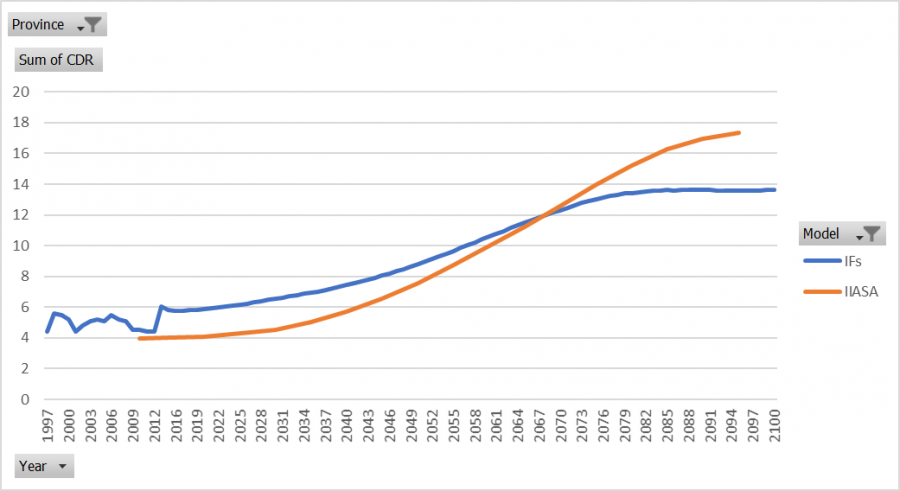
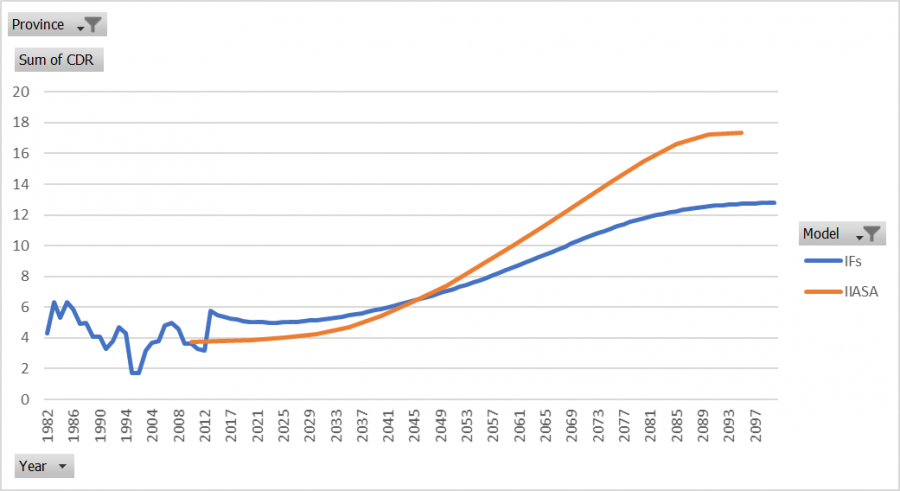
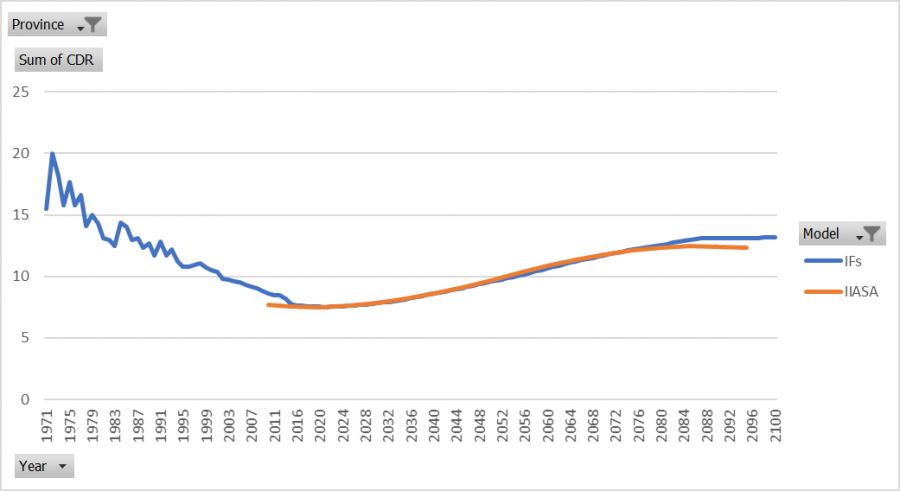
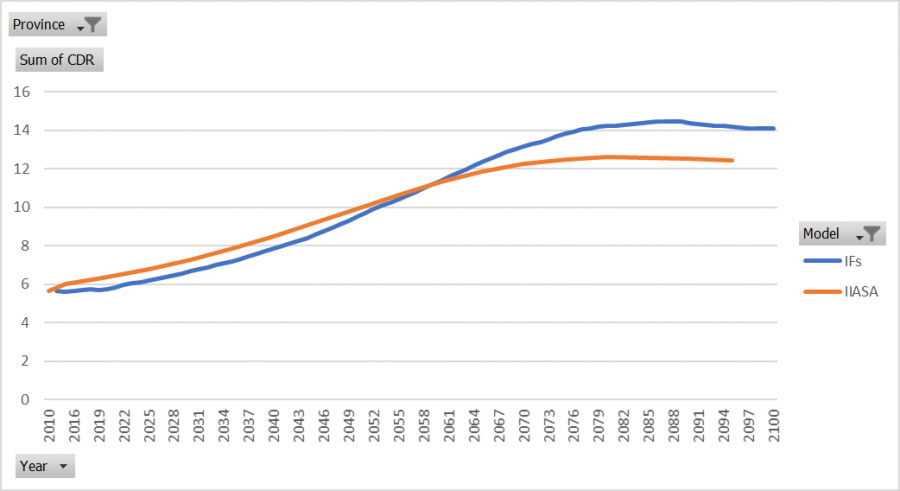
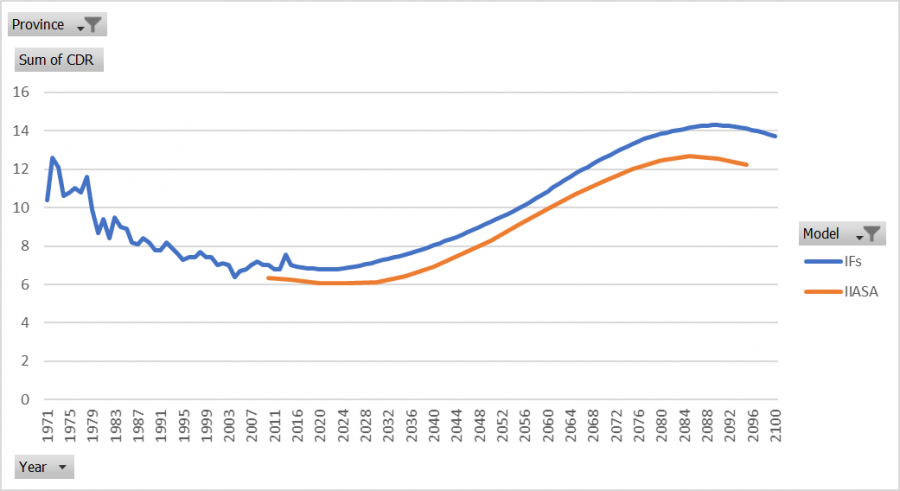
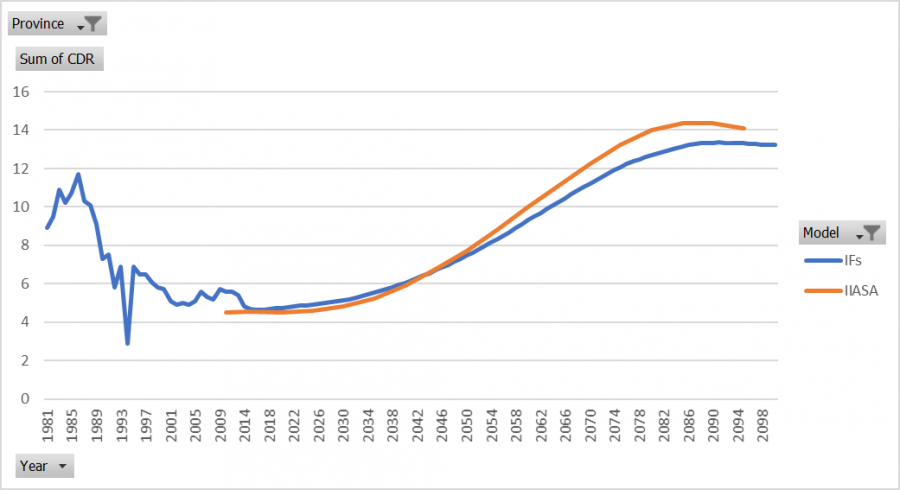
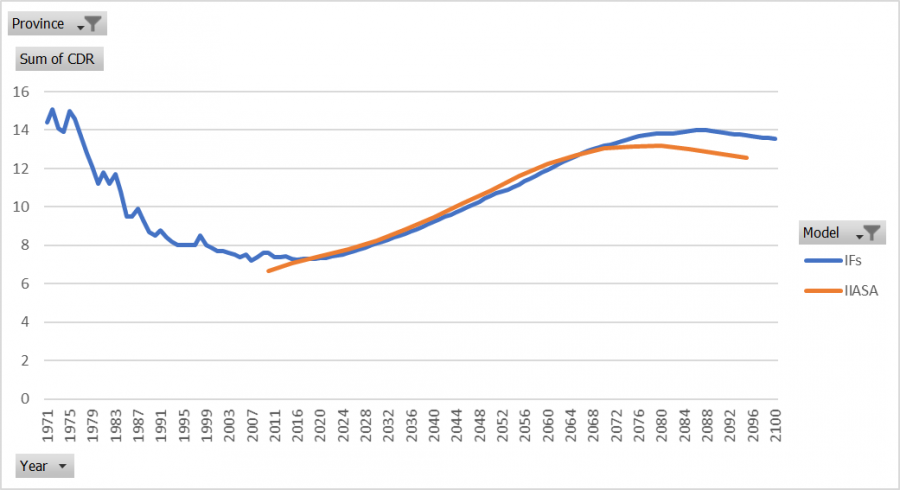
The IFs model's CDRs are significantly greater than IIASA's forecasts. In 2015 the IFs model's CDRs are about 9% greater than IIASA's and by 2095 the difference grows to around 23%.
Migration
Recommendation
Arunachal Pradesh
Population
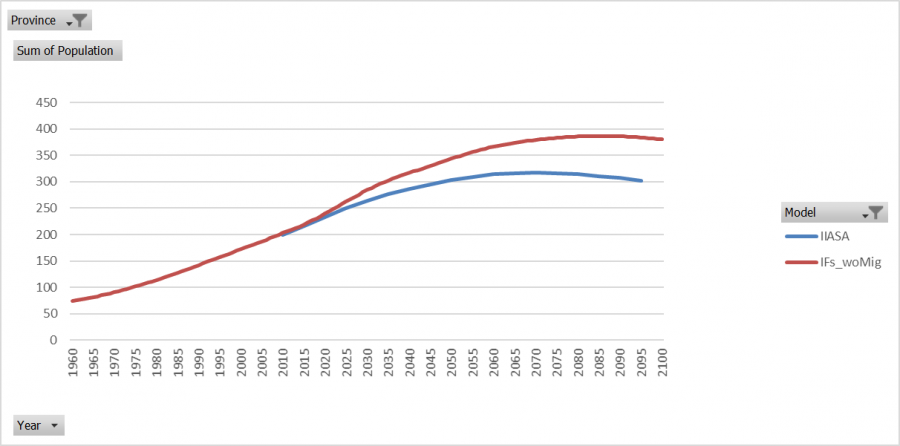
Arunachal Pradesh's population forecast in IFs is close to IIASA's. IFs is less than IIASA by an increasing amount from about 2040 to 2080. In 2080, the difference between the two model's forecasts peaks at about a 4.3% difference. From 2080 through the end of the time horizon the difference between the two models decreases slightly to around 4%.
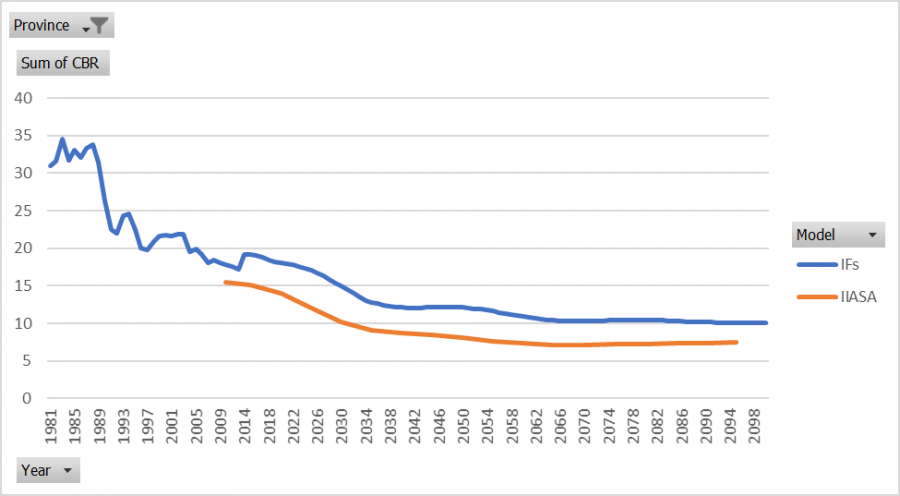
Crude Birth Rates
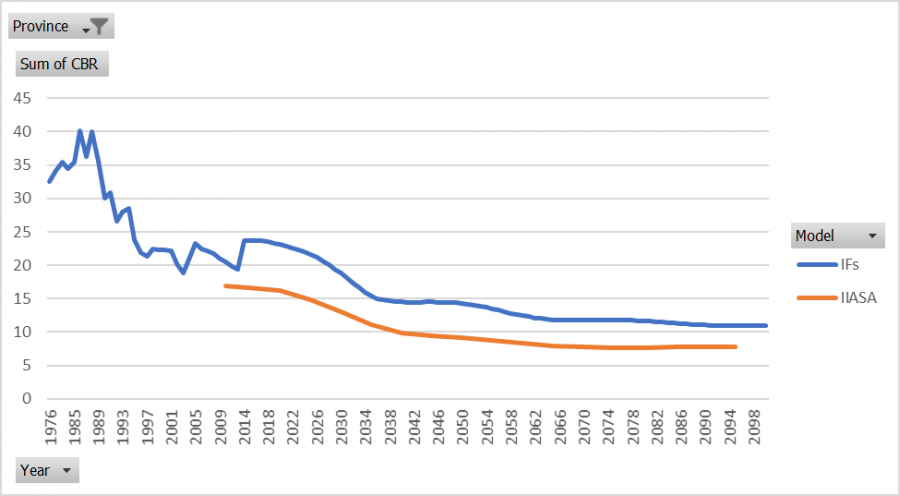
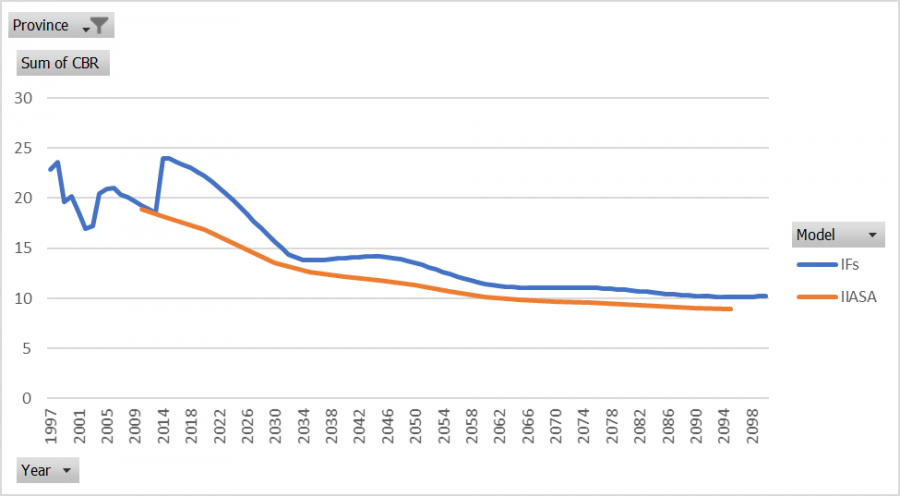
Arunachal Pradesh's CBRs in the IFs model jump up in 2014 at model initialization. The IFs model's forecasts are significantly higher than IIASA's, ranging between 18% and 36% difference.
Crude Death Rate
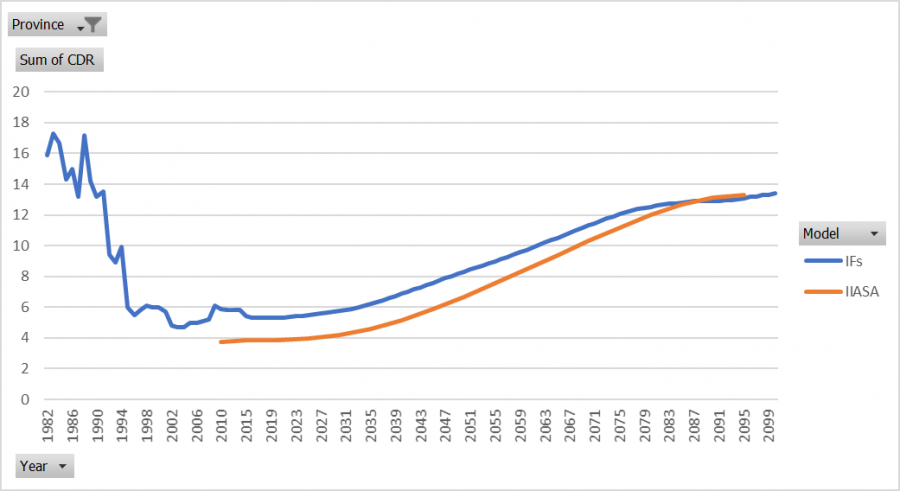
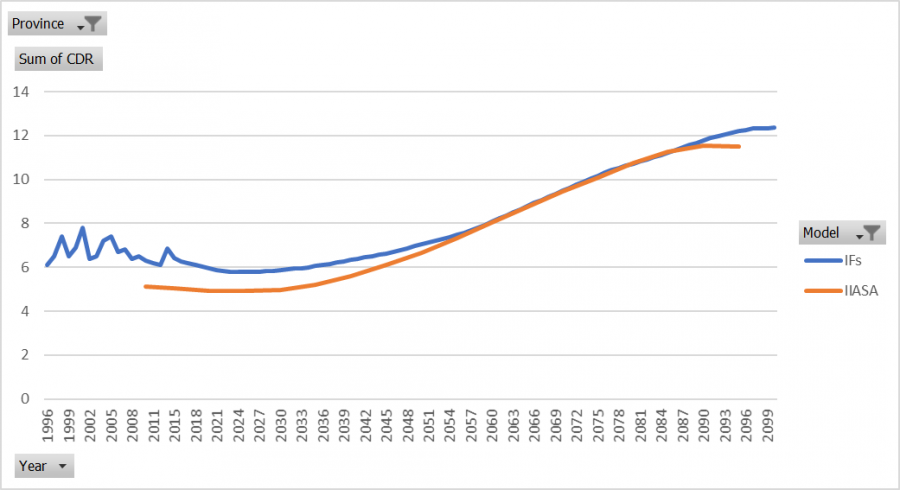
Arunachal Pradesh's CDRs in IFs are greater than in IIASA's by 36% initially. Overtime, the two models become closer and closer until 2090 when IIASA's forecasts for CDR pass IFs.
Assam
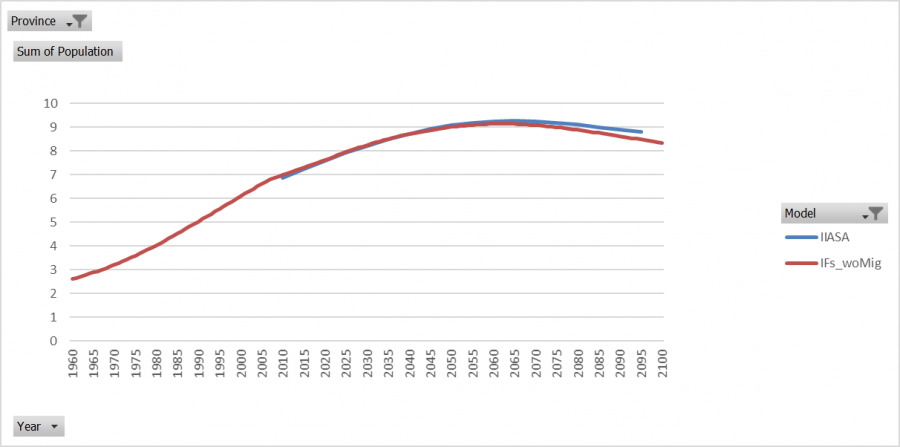
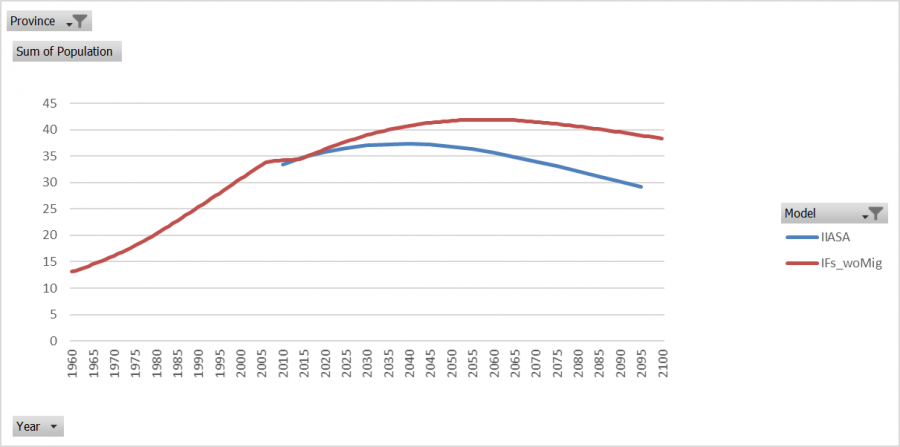
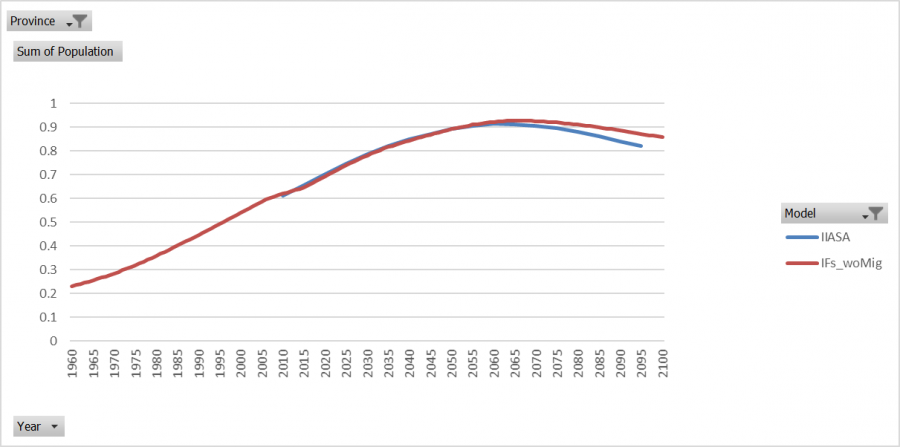
Population
The IFs model's population forecasts are slightly greater than IIASA's by less than 5% in all years. The average difference between the two models is around a 3%. 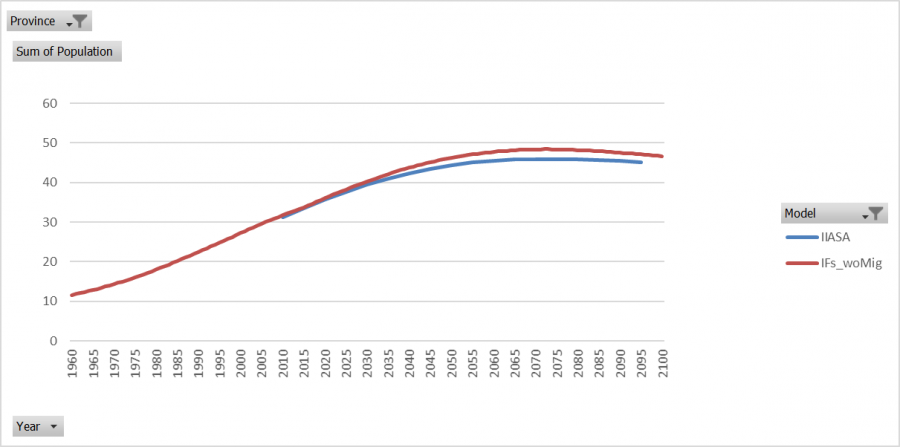
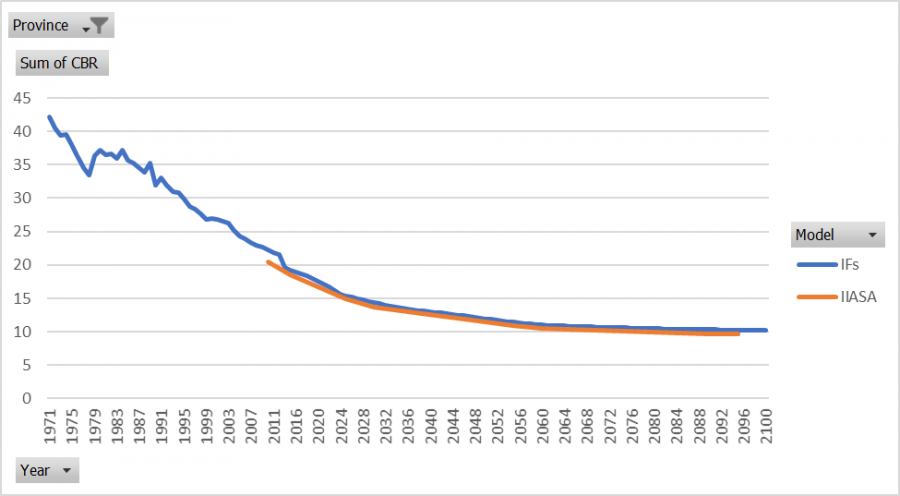
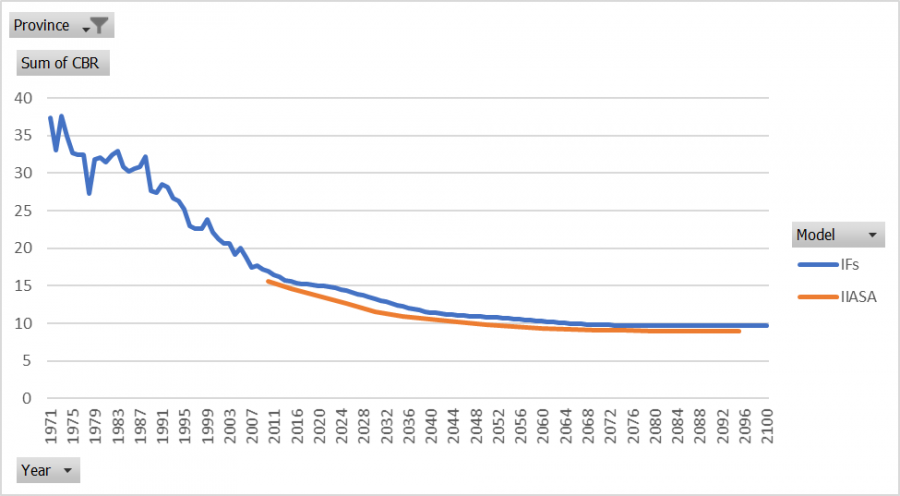
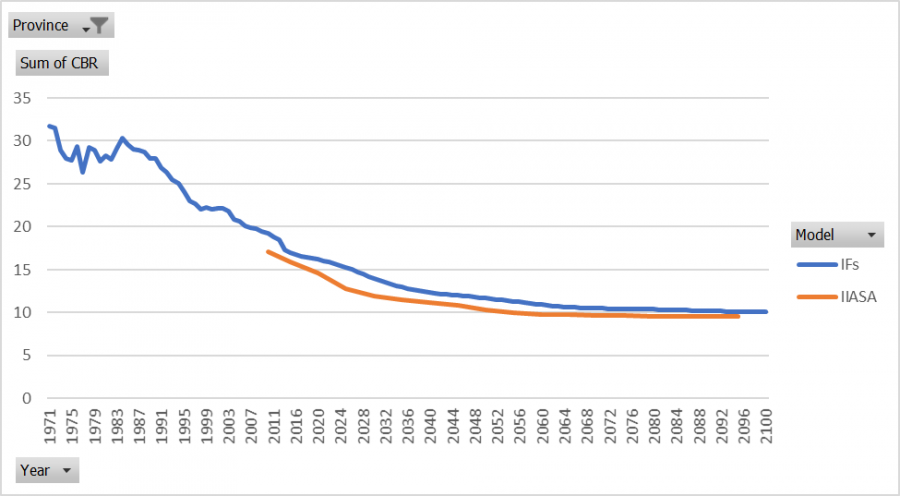
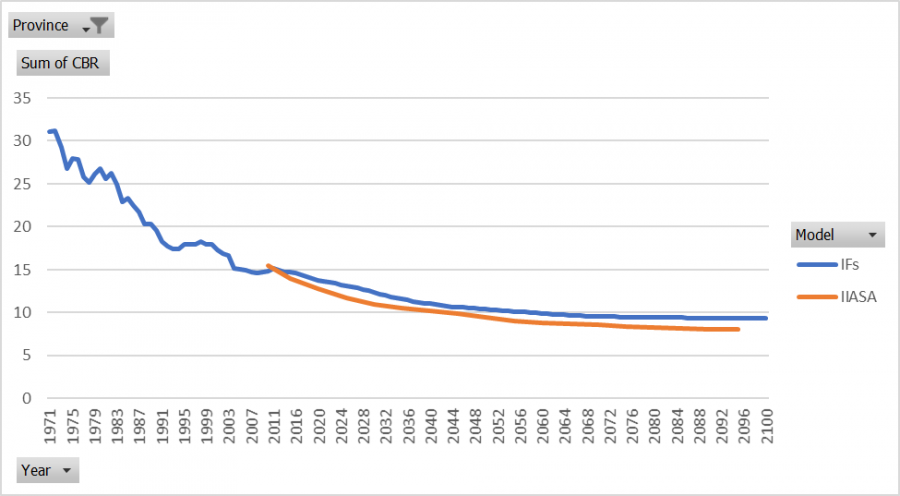
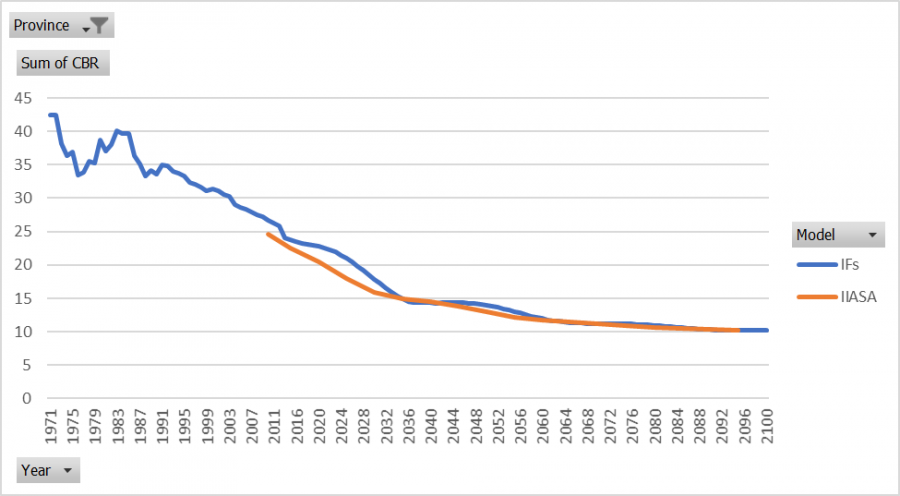
Crude Birth Rates
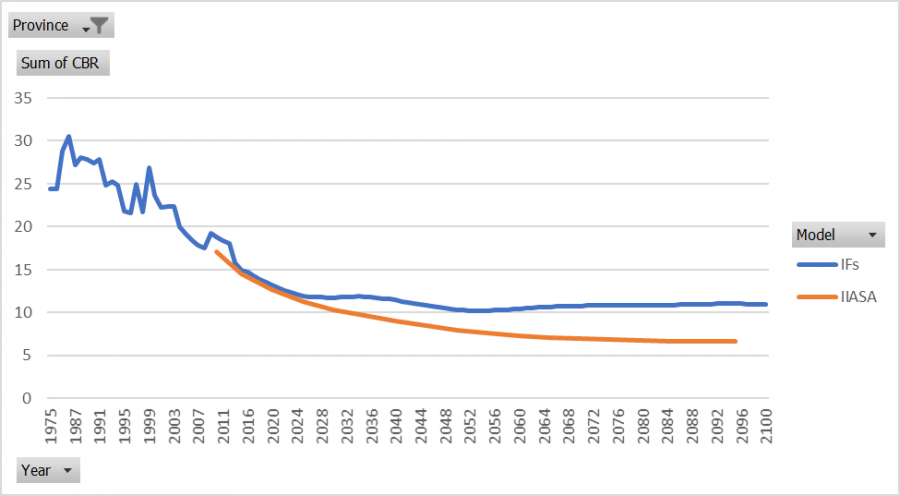
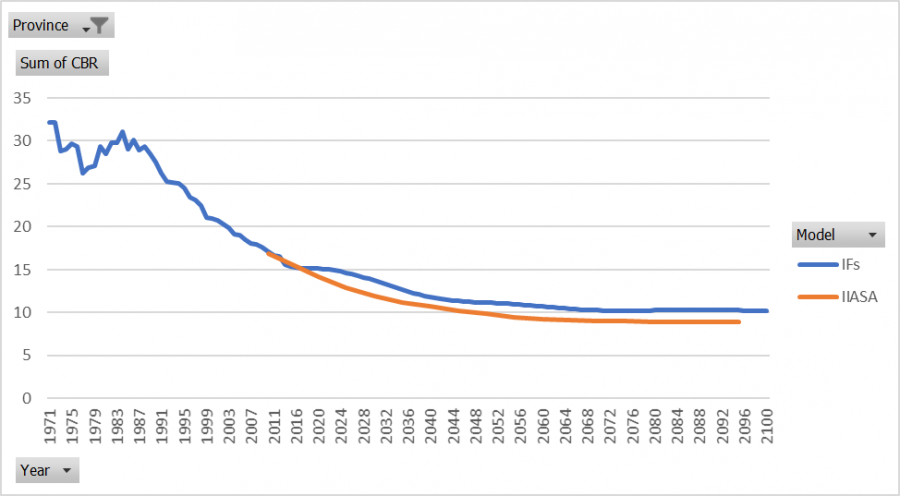
CBRs are relatively close in the two models. The largest difference is in 2095 where IFs's population forecast is nearly 8% lower than IIASA's. 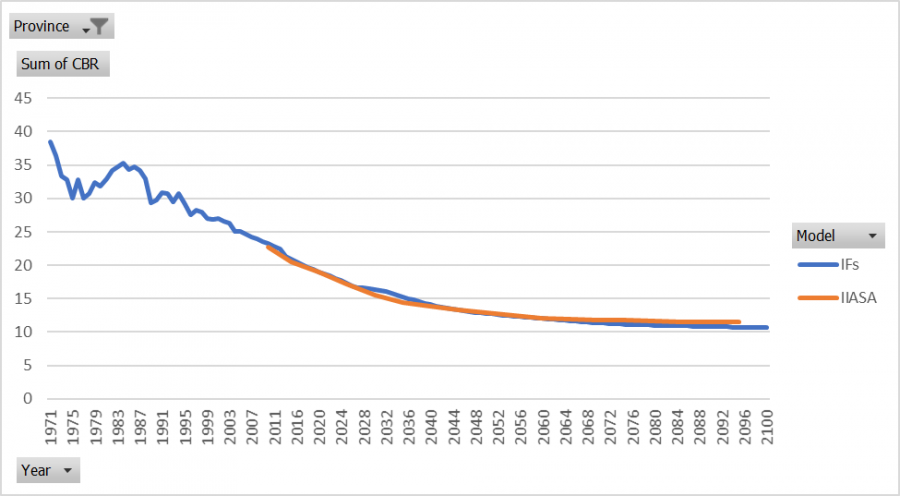
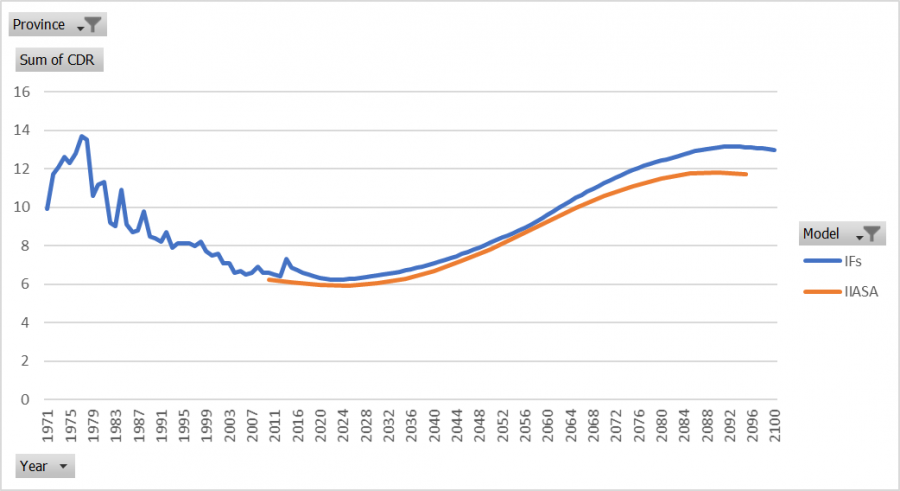
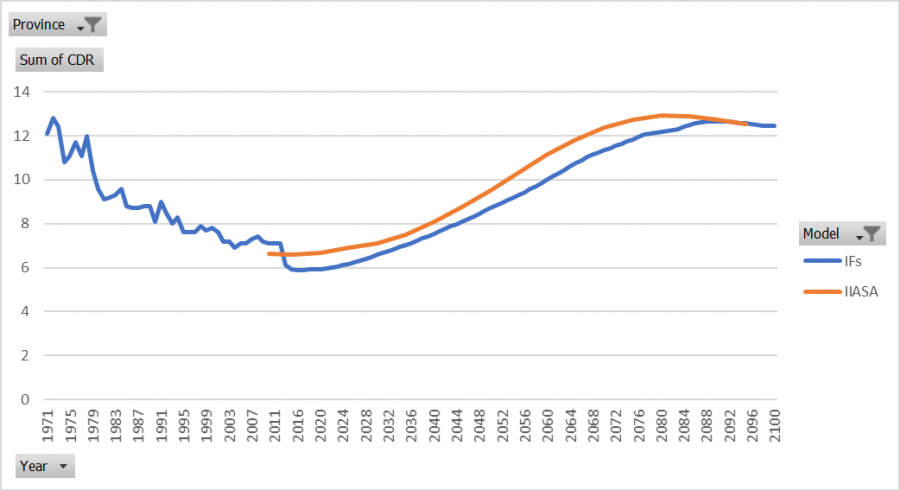
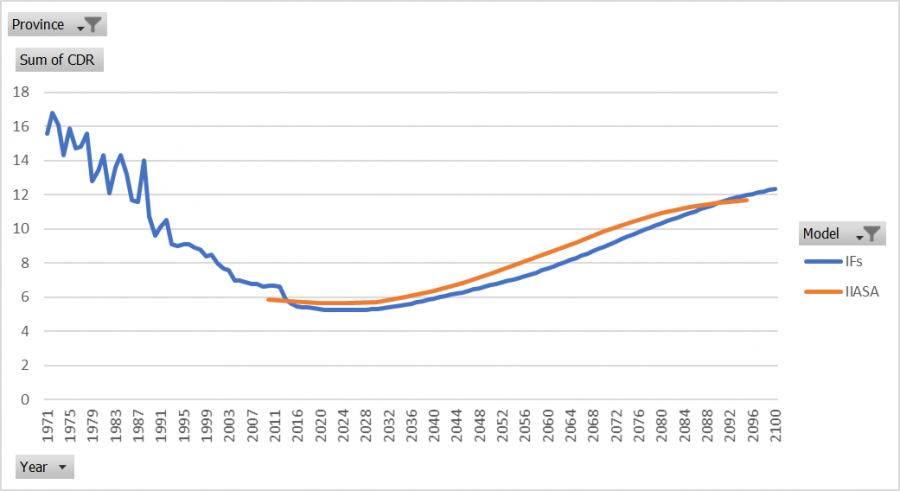
Crude Death Rates
In 2010 there is an 18% difference between IIASA and IFs's historical data. By 2015 the two models are very close and IIASA is greater than IFs until around 2070. After 2070 IFs' CDRs are greater than IIASA's by an increasing rate. From 2015 through 2100 there is not a difference between the two models that is greater than 5.5%.
Bihar
Population
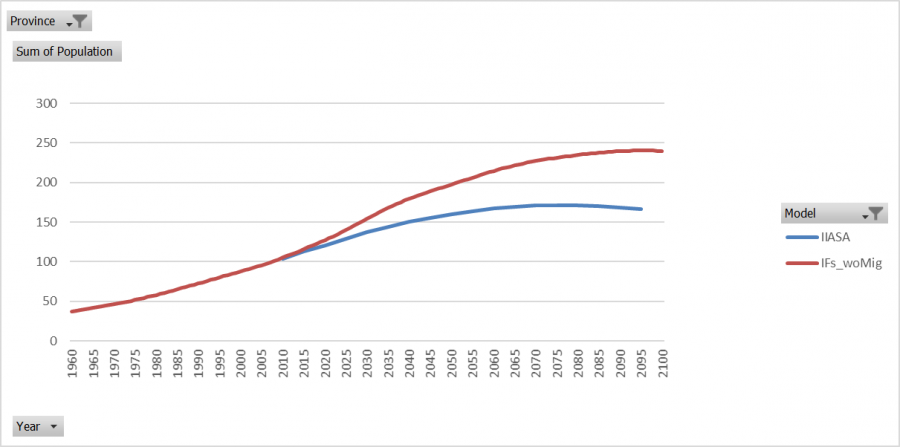
Bihar is one of the largest provinces in India and IFs is forecasting greater population growth than what is seen in IIASA's forecasts by about 70 million by the end of the time horizon. In 2095, IFs forecasts Bihar's population to be about 31% greater than IIASA's forecast.
Crude Birth Rate
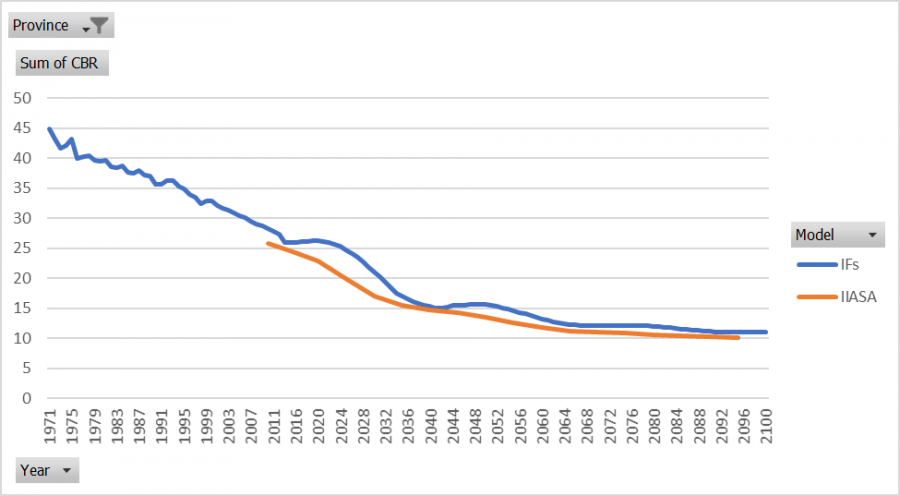
IFs forecast of Bihar's CBRs are greater than IIASA's. IFs forecasts rise and fall two times in the forecasts. IIASA's forecasts are smoother than IFs and steadily decline over time. In 2030 the difference between the two models is at its' greatest reaching about a 24% difference. In 2095 the difference between the two model's declines to its' lowest point at about 3% difference.
Crude Death Rate
In 2010 the two model's have their greatest difference, with IFs's CDR being 20% greater than IIASA's. From IFs model initialization in 2014 through 2060 the two models are quite close, with less than 10% difference in all years. After 2060, IIASA's forecasts are greater than IFs by about 10% to 13%.
Chandigarh
Population
IFs forecast of Chandigarh's population is significantly less than IIASA's forecast by an increasing amount throughout the forecasts. By 2095 IFs is less than IIASA by 129%.
Crude Birth Rate
IFs and IIASA's forecasts of CBR are similar, with IFs forecasts being greater than IIASA's by between 2% and just under 11% in 2095.
Crude Death Rate
IFs forecast of CDRs are significantly greater than IIASA's forecast by between 19% and 36%. The two model's starting points in 2010 are close and have about a 5% difference.
Chhatisgarh
Population
The IFs model's forecast of population in Chhatisgarh is greater than IIASA's population forecasts by an increasing margin. By 2095 IFs' population is about 11% greater than IIASA's.
Crude Birth Rates
From 2010 through 2030 the two models' forecasts of CBRs have the greatest difference, ranging from 4% in 2015 to 11% in 2025. From 2030 through the end of the time horizon, the two models are similar with less than 3% difference in any given year.
Crude Death Rates
IFs' and IIASA's CDRs in 2010 are at their greatest difference, with IFs being about 13% greater than IIASA. In 2025 IFs' CDRs drop below IIASA's forecast of CDR until 2080. Between 2025 and 2080, IFs is between 0% and 8% less than IIASA's forecast. After 2080, IFs' CDRs increase beyond IIASA's and by 2095 IFs is about 4% greater than IIASA's.
Dadra and Nagar Haveli
Population
Dadra and Nagar Haveli's population forecast in IFs is significantly lower than IIASA's. By 2095 IFs forecast is about 111% lower than IIASA's forecast.
Crude Birth Rates
IFs forecasts of CBRs are significantly greater than IIASA's. By 2095 IFs forecasts of CBRs is 33% greater than IIASA's. There is a noticable shift up in IFs' forecast in 2014 when the model initializes.
Crude Death Rates
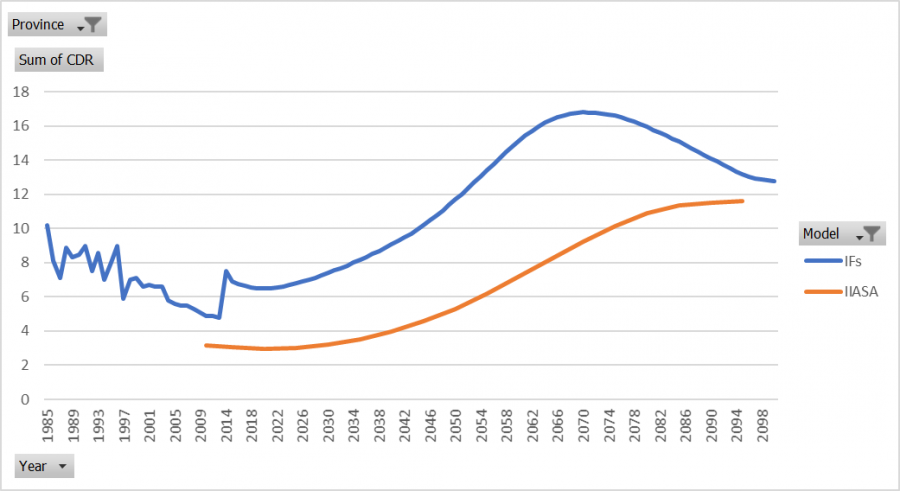
CDRs in the IFs model are significantly greater than IIASA's in all years. There is a significant jump in CDR in the IFs model at model initialization in 2014. The difference between the two models is greatest in magnitude in 2015 with IFs being 62% greater than IIASA's CDR. The models have the least difference in total in 2010 with about 0.75 deaths per thousand difference.
Daman and Diu
Population
IFs population forecasts for Daman and Diu are significantly less than the IIASA population forecasts. The magnitude of difference between the population forecasts in the IFs model and IIASA's model is at its greatest in 2095 with the IFs population being 268% less than the IIASA population.
Crude Birth Rates
IFs' CBRs are greater than IIASA's for all years but for the first 15 years of forecasts, from 2010 through 2025, are very close. IIASA's forecasts have CBR declining more rapidly after 2025 than IFs' forecasts. By 2095 IFs' CBRs are about 39% greater than IIASA's.
Crude Death Rates
IFs forecasts CDRs to be much higher than IIASA does. There is a noticable upward shift in IFs' CDR in 2014 at the model initialization, then CDRs decline until around 2020. After 2020 IFs forecasts CDRs to rise more rapidly than IIASA until it peaks in 2070, then CDRs decline in the IFs model until the end of the time horizon in 2100. IIASA's forecast is smooth and steadily increases until it plateaus around 2090. The magnitude of difference ranges from around 11% to 62%.
Delhi
Population
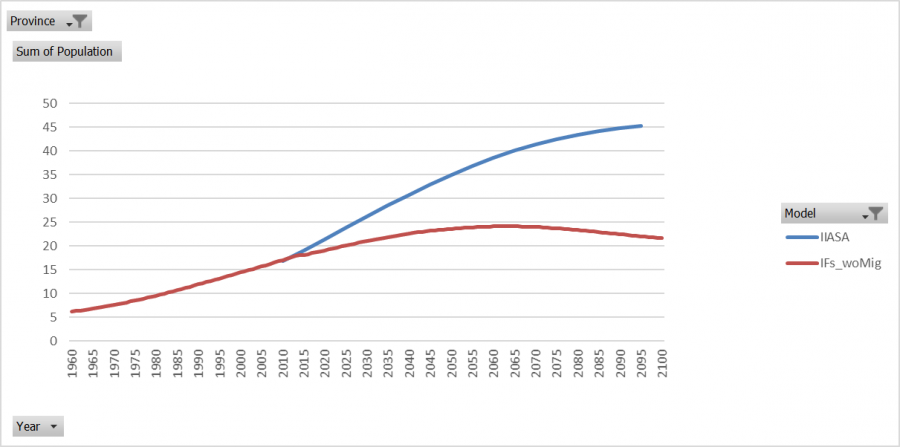
IIASA's population forecast for Delhi is significantly greater than IFs' population forecast. By 2095, IIASA forecasts a population of about 45 million. Alternatively, in IFs the population is forecast to be around 22 million. This difference between the two models is around 106% in 2095.
Crude Birth Rates
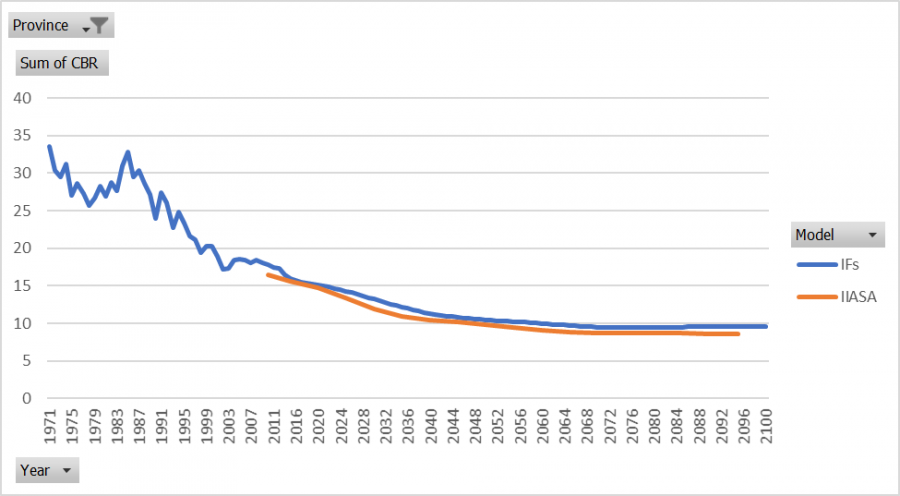
CBRs in the two models are relatively close with less than an 11% difference in any given year. IFs' forecast of CBR are greater than IIASA's in all years.
Crude Death Rates
CDRs in the IFs model are greater than IIASA's forecasts in all years. The difference increases every year up until 2075 where the difference between the two models peaks at 27%.
Goa
Population
Goa's population in IFs is significantly less than the population in IIASA's model. By 2095 IFs population is 59% less than IIASA's.
Crude Birth Rates
Goa's CBRs are greater in the IFs model than the IIASA model for all years by about 1.5 births per thousand. The magnitude of difference between the two models ranges from 11% to 17%.
Crude Death Rates
There is a significant downward shift in IF's forecast of CDR in 2014 at model initialization. This shift results in a 43% magnitude of difference between IFs and IIASA's models, despite the two models having very close starting points in 2010. IFs' forecasts of CDRs increase more rapidly than IIASA's, and by 2070 IFs' CDRs become greater than IIASA's through the end of the time horizon.
Gujarat
Population
The population forecasts of Gujarat are similar in the two models, with IFs' forecasts being greater than IIASA's in all years. The magnitude of difference between the two models is less than 5% in all years.
Crude Birth Rates
IFs' CBRs are greater than IIASA's for all years, but the two models are within 4 births per thousand or less of each other. The magnitude of difference ranges from 7% to 11%.
Crude Death Rates
IIASA's CDR forecasts are greater than IFs from 2015 through the end of the time horizon in 2095. IFs appears to have a jump down in CDRs at model initialization in 2014. The largest magnitude of difference between the two models was in 2020 with IFs being 21% less than IIASA's.
Haryana
Population
Population forecasts in Haryana are different between the two models, with IFs being significantly less than IIASA's. By 2095 IFs' population forecast is about 33% less than IIASA's, which translates into a difference of about 11 million people.
Crude Birth Rates
IFs' forecasts of CBRs are greater than IIASA's for all years, but are relatively close with the magnitude of difference ranging from 3% to 6%.
Crude Death Rates
As has been observed previously, there is an upward shift in CDRs in the IFs model in 2014 at model initialization. IF's forecasts are greater than IIASA's for all years. The magnitude of difference ranges from 3% to 12%.
Himachal Pradesh
Population
The population forecasts in the two models are quite close with IIASA's forecasts are slightly larger from 2060 through the end of the time horizon.
Crude Birth Rates
IFs forecasts CBRs to be higher than IIASA for all years by a decreasing margin. In 2030 the magnitude of difference between the two models peaks at 13% and by 2095 the magnitude of difference declines to 7.5%.
Crude Death Rates
IIASA's forecasts of CDRs are greater than IFs until 2085. The magnitude of difference between the two models ranges from -10% to 5%.
Jammu and Kashmir
Population
Jammu and Kashmir's population is forecast to be about 2 million more in IFs than in the IIASA model. The magnitude of difference reaches around 15% in 2095.
Crude Birth Rates
IFs' forecast of CBRs for Jammu and Kashmir is greater than IIASA's forecasts for all years. There is an absolute difference of about 2 births per thousand. The magnitude of difference between the two models is greatest in 2055 with IFs being about 29% greater than IIASA.
Crude Death Rates
There is a noticable upward shift in CDR in the IFs model in 2014 at model initialization. The IFs forecasts of CDRs are greater than IIASA's for all years, but by a decreasing margin over time.
Jharkhand
Population
Jharkhand's population forecasts are about 8.5 million more in IFs than in IIASA. The magnitude of difference is just under 15% by 2095.
Crude Birth Rates
IFs' forecasts of CBRs are greater than IIASA's for all years. The IFs model does not decline at the same rate throughout the time horizon. IIASA's decline in CBR is smoother and steadier.
Crude Death Rates
There is an upward shift in CDRs in IFs at model initialization in 2014. Until around 2045 IFs' forecast of CDRs is significantly greater than IIASA's, by a magnitude of 5% to 23%. After 2045 the CDRs in the two models are very close.
Karnataka
Population
IFs' forecast of population is greater than IIASA's for all years. By 2095, IFs is greater than IIASA by about 10% which equates to about 8 million people.
Crude Birth Rates
IFs' forecasts of CBRs are greater than IIASA's for all years by a decreasing margin. The greatest magnitude of difference was in 2025 by about 16%.
Crude Death Rates
Crude death rates are higher in IIASA's forecasts from 2015 through 2090. There is about 1 less death per thousand in the IFs forecasts with magnitudes of difference ranging from -12% to 7%.
Kerala
Population
Kerala's population is forecast to be significantly higher in the IFs forecasts verus the IIASA forecasts. By 2095 IFs forecasts about 10 million more people than IIASA, with is about a 25% difference.
Crude Birth Rates
IFs forecasts CBRs for Kerala to be greater than what was forecast by IIASA for all years. In 2095 IFs is about 14% greater than IIASA's forecast.
Crude Death Rates
IFs has a noticable downward shift in CDRs in 2014 at model initialization. IFs forecasts CDRs to be less than IIASA's forecasts by about 2 deaths per thousand for most years. The magnitude of difference decreases over time, with a range of 33% to 9%.
Lakshadweep
Population
IFs' forecast for population in Lakshadweep is significantly lower than IIASA's forecast. The magnitude of difference between the two models in 2095 is 64%.
Crude Birth Rates
There is a upward shift in CBRs in the IFs model in 2014 at model initialization. IFs' forecasts are greater than IIASA's for all years by about 4 births per thousand with an overall magnitude varying from 31% to 45%.
Crude Death Rates
There is an upward shift in CDRs in 2014 in the IFs model. From 2010 through 2055 IFs' forecasts of CDRs are greater than IIASA's. After 2055 IFs forecasts are less than IIASA's. The range of magnitude of difference varies from -18% to 36%.
Madhya Pradesh
Population
Madhya Pradesh's population is close in the two models, with IFs' forecasts being slightly less than IIASA's. The difference between the two models increases over time. By 2095, IFs' population forecast is about 4% less than IIASA's.
Crude Birth Rates
IFs' forecast of CBRs decline at different rates throughout the forecasts, whereas IIASA's CBRs decline more steadily. IFs forecasts are greater than IIASA's for most years, but get rather close to IIASA's in 2035 and 2065.
Crude Death Rates
Madhya Pradesh's CDRs have a significant spike in 2014 when the model initializes. IFs' forecasts of CDRs are greater than IIASA's for all years by about 1.5 deaths per thousand.
Maharashtra
Population
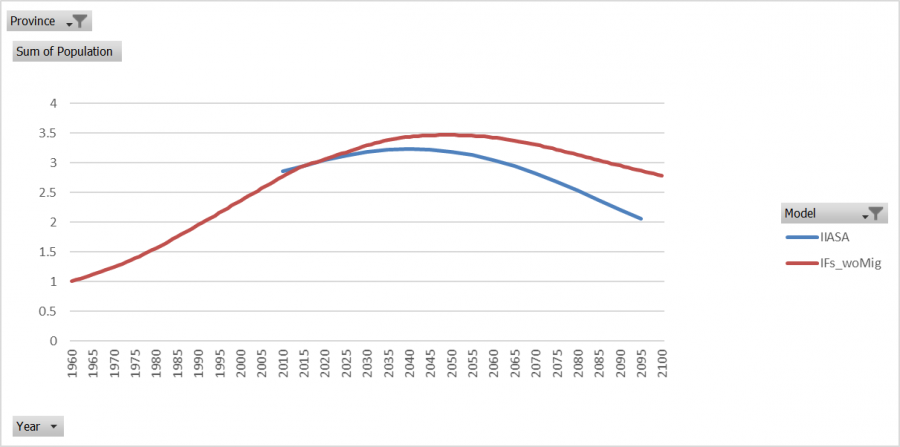
IFs' forecast of Maharashtra's population is significantly less than IIASA's by an increasing margin. In 2095, there is a nearly 40 million difference between the two models. The magnitude of difference reaches 31% in 2095.
Crude Birth Rates
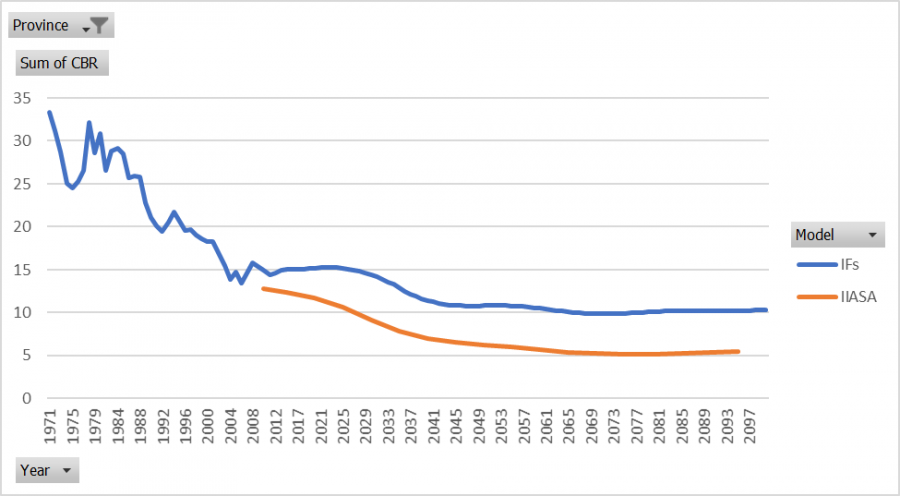
IFs' forecasts are greater than IIASA's for all years by a magnitude of 6% to 14%.
Crude Death Rates
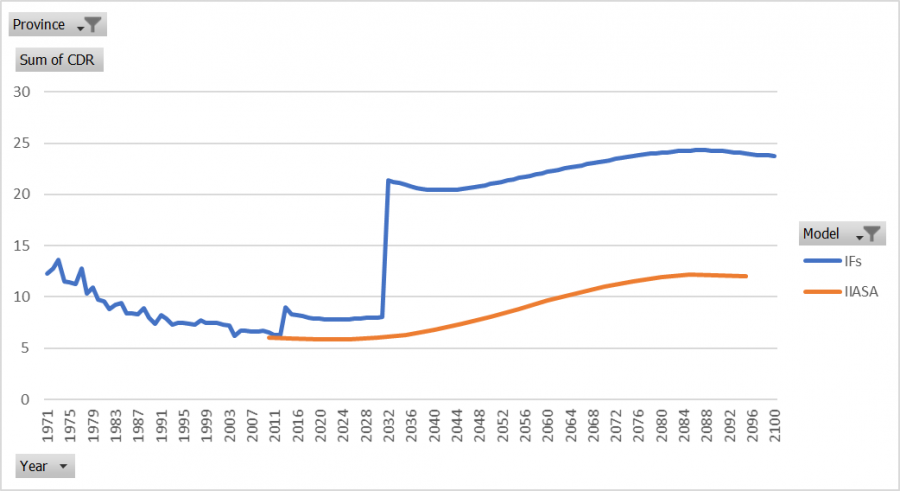
IFs' forecast for CDRs looks bizarre, there is a massive jump in CDR in 2030. IFs' forecasts for CDRs are greater than IIASA's for all years.
Manipur
Population
IFs' population forecast for Manipur are greater than IIASA's by an increasing margin through the end of the time horizon. The magnitude of difference reaches 28% in 2095.
Crude Birth Rates
IFs' forecasts of CBRs are greater than IIASA's for all years by about 5 births per thousand.
Crude Death Rates
In IFs' forecast of CDRs there is an upward shift in 2014 at model initialization which leads to a 40% magnitude of difference between the two models. IFs' CDRs increase throughout the forecasts, but at a lower rate than IIASA's. By 2070, IIASA's CDRs surpass IFs'.
Meghalaya
Population
Meghalaya's population forecasts differ significantly between the two models. IFs' forecast is greater than IIASA's by nearly 2.5 million.
Crude Birth Rates
IFs' forecasts of CBRs are greater than IIASA's for all years by a decreasing margin.
Crude Death Rates
There is a significant drop in CDRs in the IFs model in 2014 at model initialization. From 2015 through 2095 IFs' forecast is less than IIASA's by an increasing margin.
Mizoram
Population
IFs' population forecast for Mizoram is larger than IIASA by an increasing margin throughout the time horizon. By 2095, there are about 500 thousand more people in the IFs model than in IIASA's.
Crude Birth Rates
Mizoram's CBRs in the IFs model are significantly greater than the CBRs in the IIASA model by about 6 or 7 births per thousand.
Crude Death Rates
There is a jump up in CDR in the IFs model in 2014 at model initialization. IFs' forecasts start out being greater than IIASA's, but the IFs CDRs are increasing at a lower rate than IIASA's CDRs are. Thus by 2065, IIASA's CDRs surpass IFs and are greater than IFs by an increasing margin through the end of the time horizon.
Nagaland
Population
IFs' forecast of population in Nagaland is significantly greater than IIASA's forecast. By 2095 IFs' population forecast is about 38% greater than IIASA's.
Crude Birth Rates
IFs forecasts of CBRs in Nagaland are greater than IIASA's by about 5 births per thousand.
Crude Death Rates
There is a shift up in 2014 in CDRs in the IFs model. IIASA's CDRs are forecast to increase at a faster rate than IFs' model and by 2045 IIASA's forecasts of CDRs are greater than IFs'. By 2095 the difference between the two models is greatest with IFs being about 36% less than IIASA.
Orissa
Population
IFs' population forecasts are greater than IIASA's by an increasing margin. By 2095, there is about 3 million more people in the IFs' population model than IIASA's.
Crude Birth Rates
IFs' forecast of CBRs is slightly more than IIASA's but the two models are quite close.
Crude Death Rates
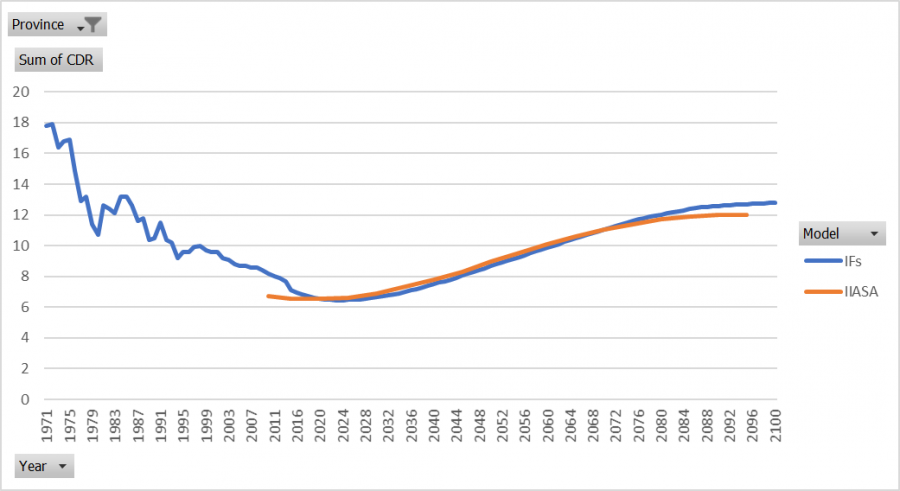
CDRs are almost identical except for in the first year, 2010, and the last year, 2095.
Pondicherry
Population
IFs' forecast of population in Pondicherry is less than IIASA's forecast by an increasing margin over time. By 2095, about 0.7 million less people are forecast to be in Pondicherry in the IFs model than in the IIASA model.
Crude Birth Rates
Pondicherry's CBRs are lower in IFs' forecasts than in IIASA's for most years. Both models are relative close.
Crude Death Rates
CDRs in the IFs' model are greater than IIASA's model from 2010 through 2060 by about 0.5 deaths per thousand. From 2060 on, IFs' forecast of CDRs are greater than IIASA's by an increasing margin. By 2095, IFs' CDRs are greater than IIASA's by almost 2 deaths per thousand.
Punjab
Population
IFs forecasts Punjab's population to be lower than IIASA's by an increasing margin. Punjab's population is forecast to be about 5 million less in the IFs model than in IIASA's model by 2095.
Crude Birth Rates
IFs forecasts CBRs to be greater than IIASA's model by about 11% to 15%.
Crude Death Rates
IFs forecasts CDRs to be greater than IIASA's by about 1 death per thousand.
Rajasthan
Population
IF's forecast of Rajasthan's population is greater than IIASA's for all years by an increasing margin. By 2095 the difference is about 10 million people.
Crude Birth Rates
IFs' forecasts of CBRs in Rajathan are greater than IIASA's by a decreasing margin. By 2060, both model's forecasts are basically the same.
Crude Death Rates
For the most part IFs' forecasts of CDRs are lower than IIASA's by 2% to 12%.
Sikkim
Population
The two models forecasts of population in Sikkim are quite close but differ by an increasing margin.
Crude Birth Rates
CBRs are greater in the IFs model.
Crude Death Rates
CDRs in the two models are close together from 2010 through 2050. After 2050, IIASA's CDRs are greater than IFs by an increasing margin.
Tamil Nadu
Population
IFs' forecast for population in Tamil Nadu is greater than IIASA's by 2% to 6%.
Crude Birth Rate
CBRs are relatively close in both models.
Crude Death Rate
CDRs are close in the two models until 2070. After 2070, the IFs model forecast is greater than IIASA's by an increasing margin. By 2095, IFs CDRs are about 8% greater than IIASA's.
Tripura
Population
Population in Tripura is forecast to be greater in the IFs model than in the IIASA model by an increasing margin. By 2095, IFs' population forecast is greater than IIASA's by about 1.2 million people.
Crude Birth Rates
The IFs' model forecasts CBRs to be greater than IIASA's model by about 5 births per thousand throughout the end of the time horizon.
Crude Death Rates
There is a jump up in CDRs in the IFs' model in 2014 at the model initialization. From 2015 through 2050, IFs' forecast of CDR is greater than IIASA's at a decreasing rate over time. After 2050, IIASA's CDRs surpass the IFs' forecasts and the difference between the two models increases. By 2095, IIASA's CDRs are about 6 more deaths per thousand.
Uttaranchal
Population
IFs' forecast of Uttaranchal's population is greater than IIASA's by an increasing margin. By 2095, IFs' population forecast is about 7% greater than IIASA's
Crude Birth Rate
There is a jump up in 2014 in IFs' CBR forecast when the model initializes. This jump produces a 25% difference between the two models. This difference declines until 2030, then there is an increase until 2045. From 2045 on the difference between the two models decreases until the end of the time horizon. IFs' forecasts of CBRs are greater than IIASA's for all years.
Crude Death Rate
The two models start at different points, with the IFs model being about 20% greater than IIASA. By 2055, the two models' forecasts of CDRs converge and stay together until 2085.
Uttar Pradesh
Population
IFs forecast of population in Uttar Pradesh is greater than IIASA's by an increasing margin. By 2095, Uttar Pradesh is forecast to have about 80 million more people in the IFs forecasts.
Crude Birth Rates
IFs' forecast of CBRs in Uttar Pradesh is greater than IIASA's for all years by a shifting margin. The difference between the two model's peaks in 2025 with about a 19% difference. By the end of the time horizon in 2095, the two models are almost the same. IIASA's CBRs are forecast to decline steadily.
Crude Death Rates
There is a jump up in CDRs in 2014 in the IFs model when the model initializes. From 2010 through 2040 IFs' forecasts of CDRs are greater than IIASA's by a decreasing margin. From 2040 through the end of the time horizon, the two models are about the same.
West Bengal
Population
IFs' population forecast of West Bengal is greater than IIASA's by an increasing margin. By 2095, IFs forecasts about 15 million more people in West Bengal than in the IIASA model.
Crude Birth Rates
IFs forecasts CBRs to be greater than IIASA's forecast by about 2 births per thousand.
Crude Death Rates
There is a spike in CDRs in the IFs model in 2014, when the model initializes. From 2020 on the IIASA model's CDRs are greater than the IFs model.
