India 2017 Consolidation: Difference between revisions
AltheaDitter (talk | contribs) No edit summary |
AltheaDitter (talk | contribs) No edit summary |
||
| (76 intermediate revisions by the same user not shown) | |||
| Line 88: | Line 88: | ||
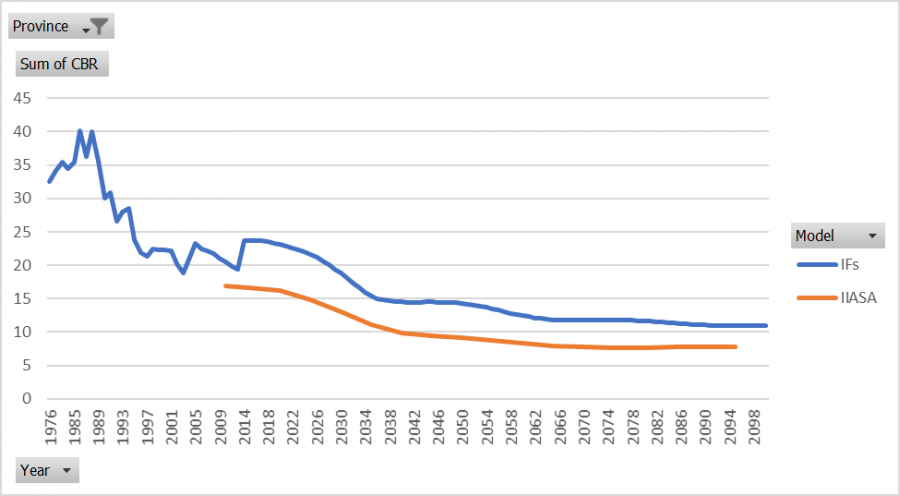
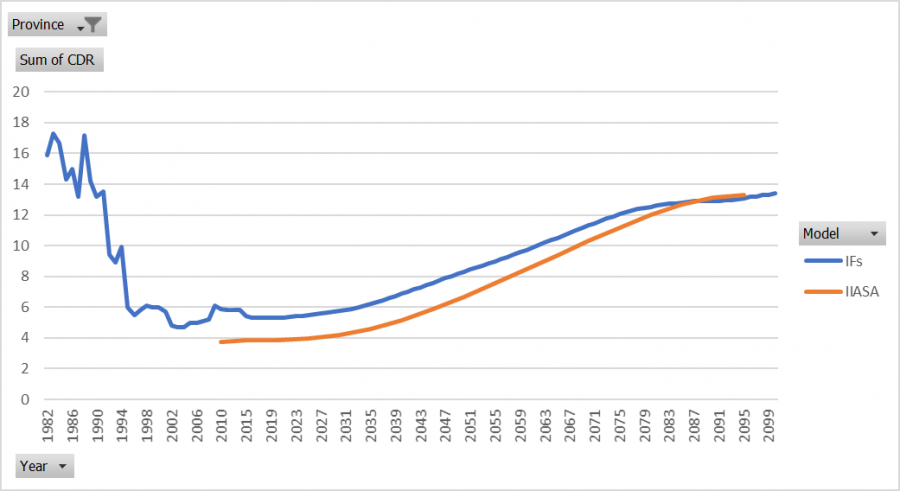
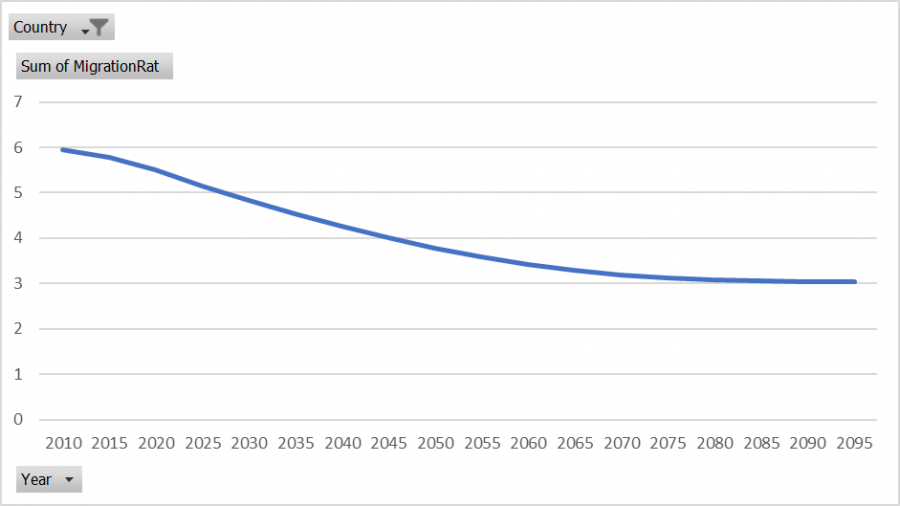
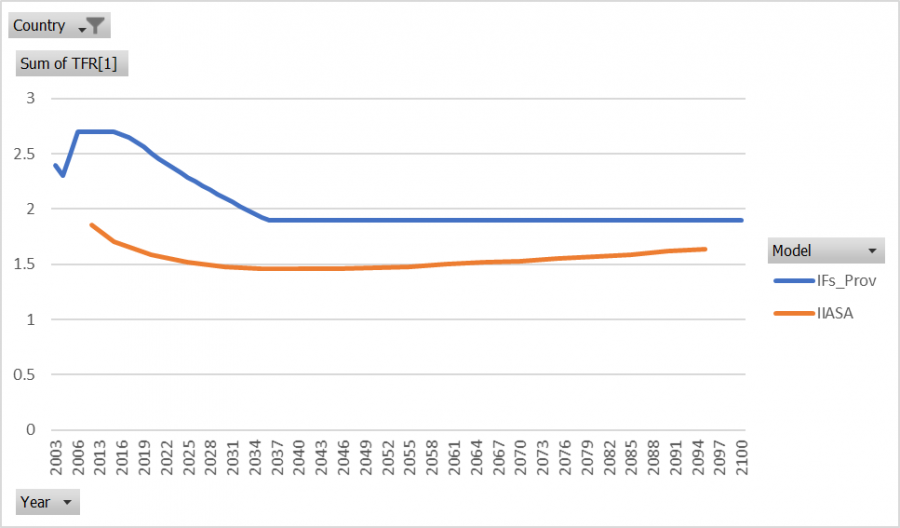
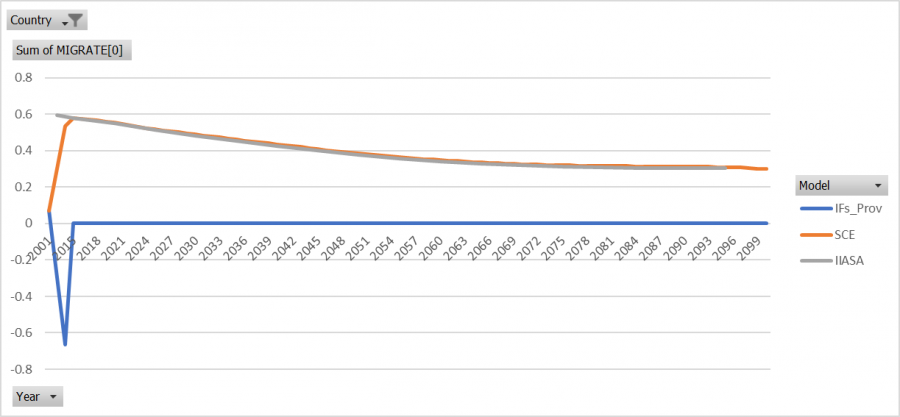
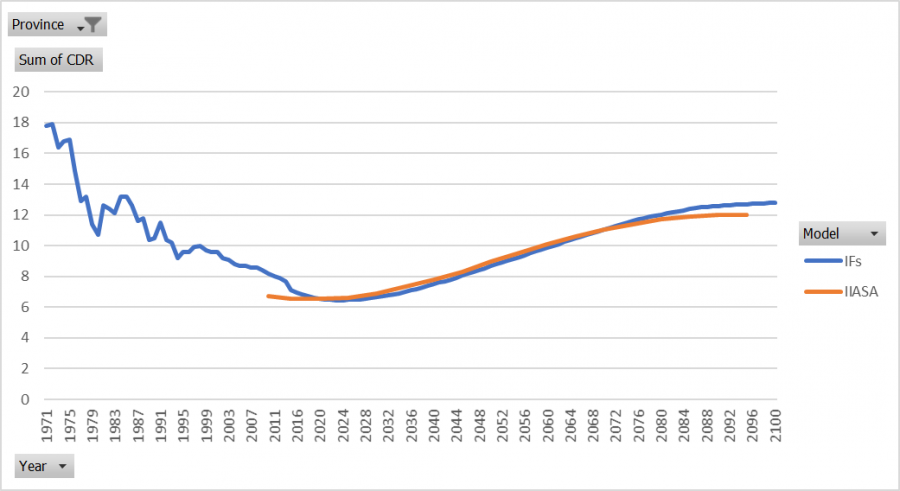
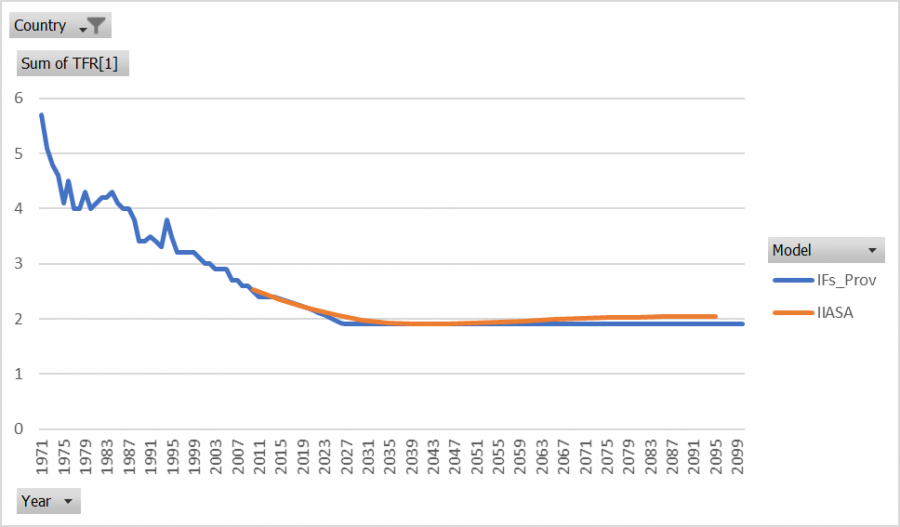
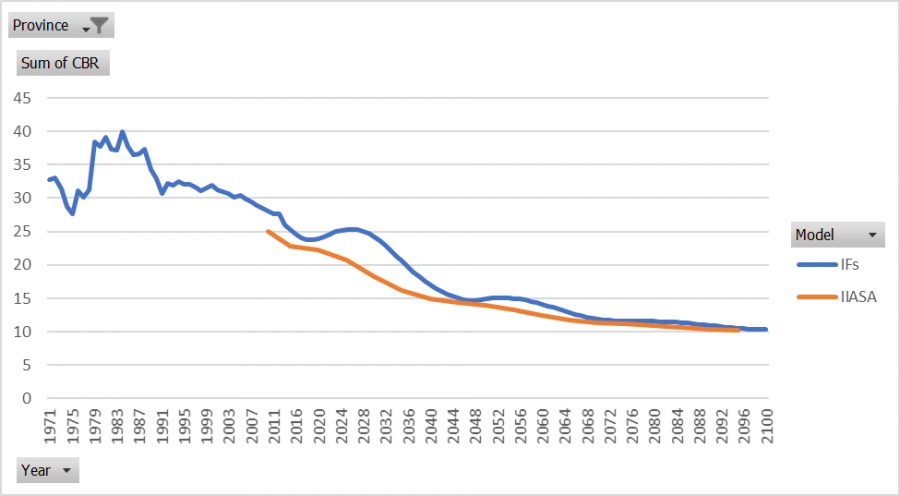
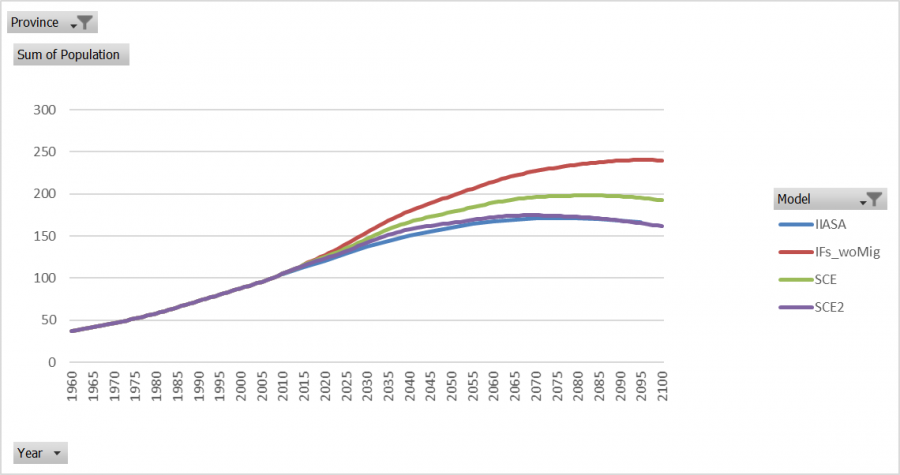
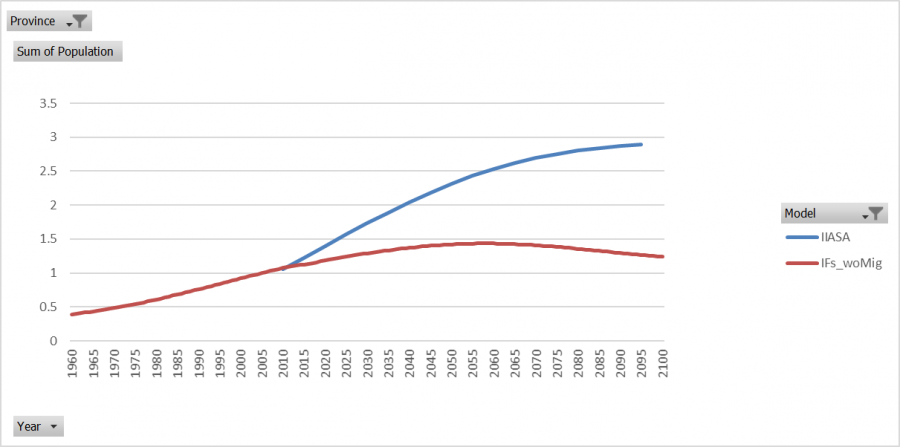
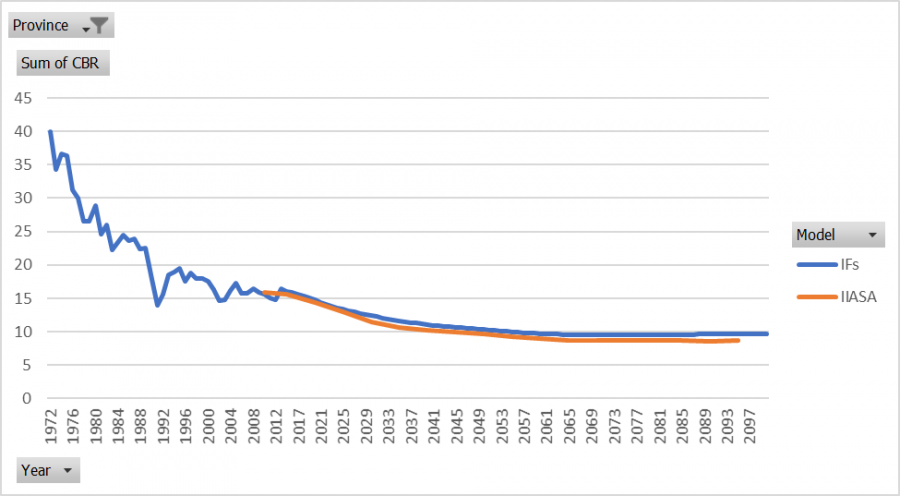
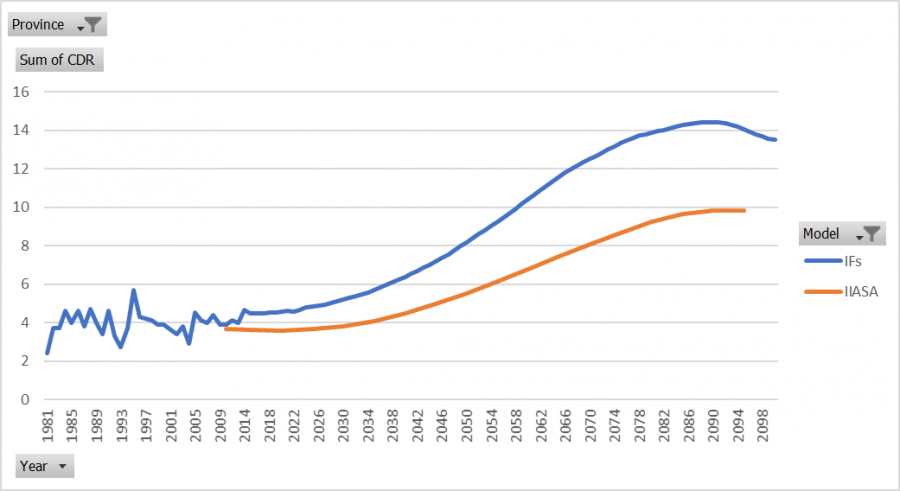
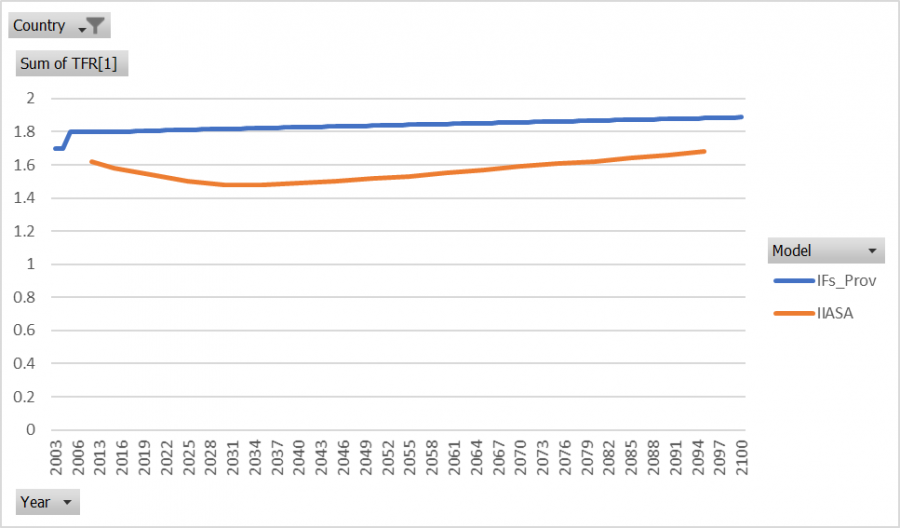
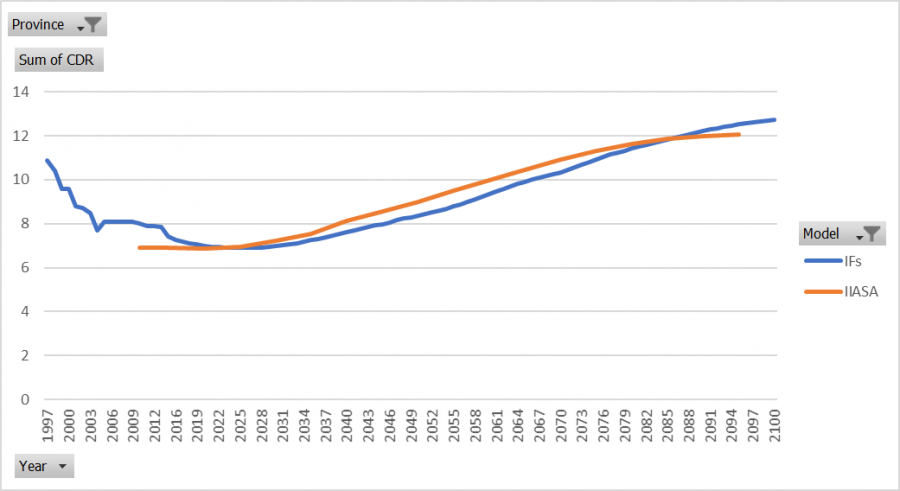
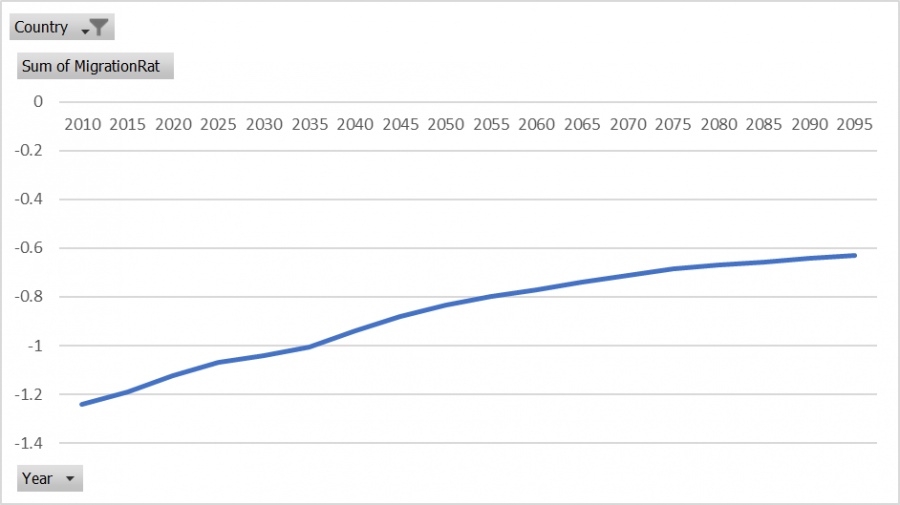
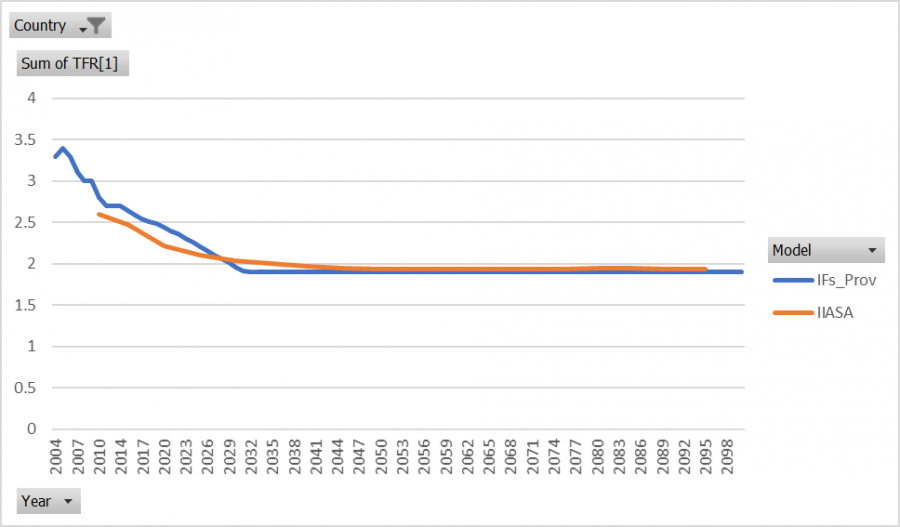
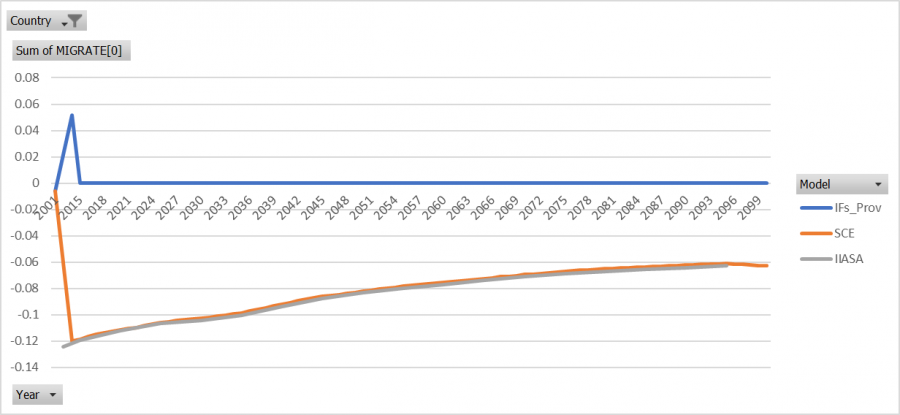
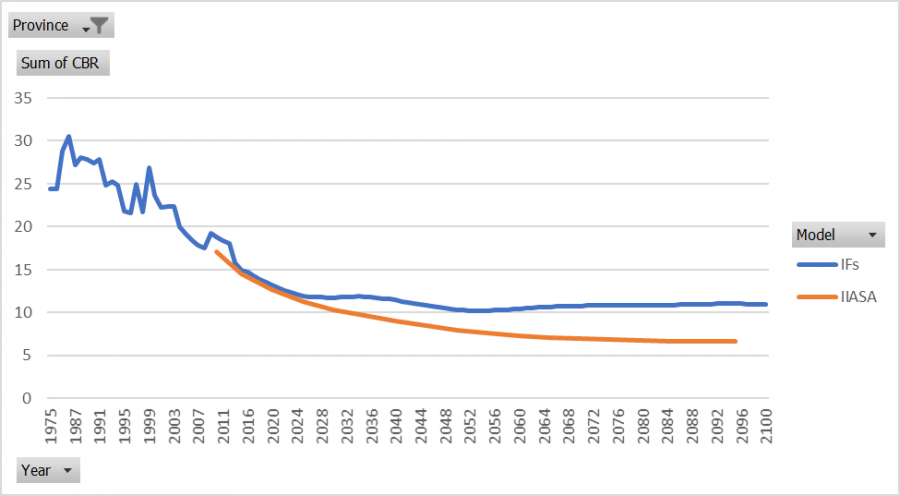
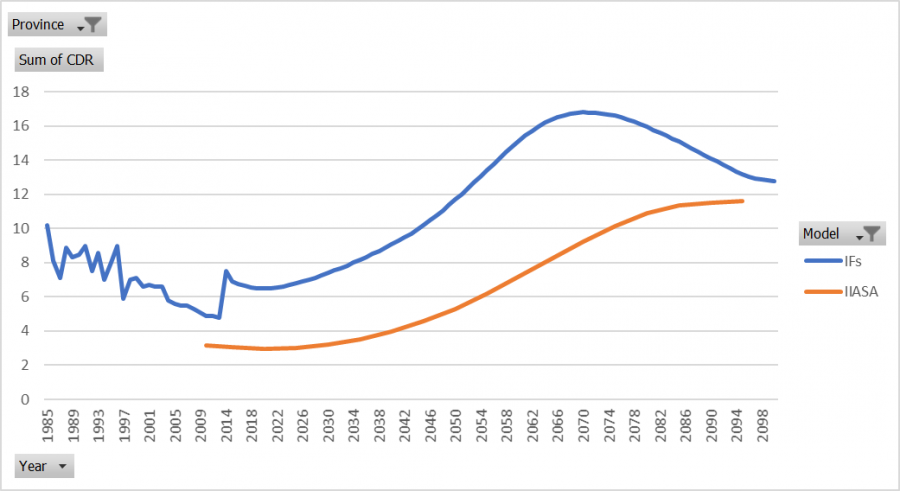
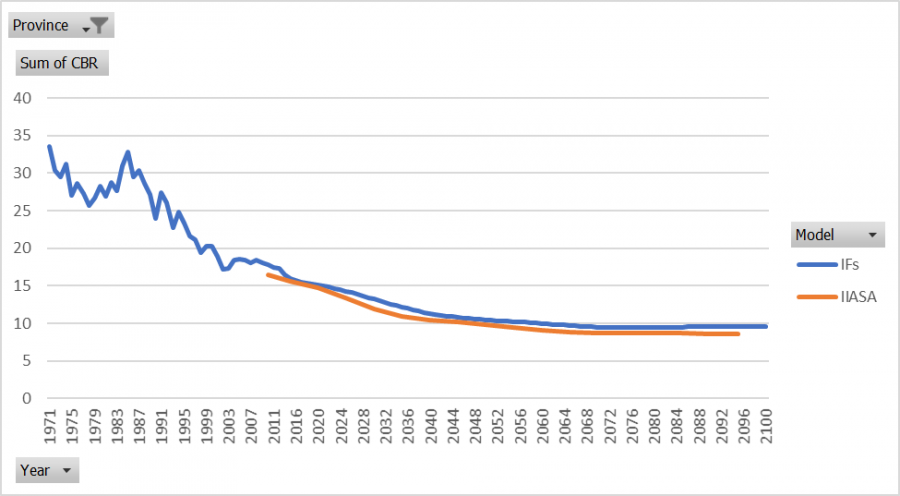
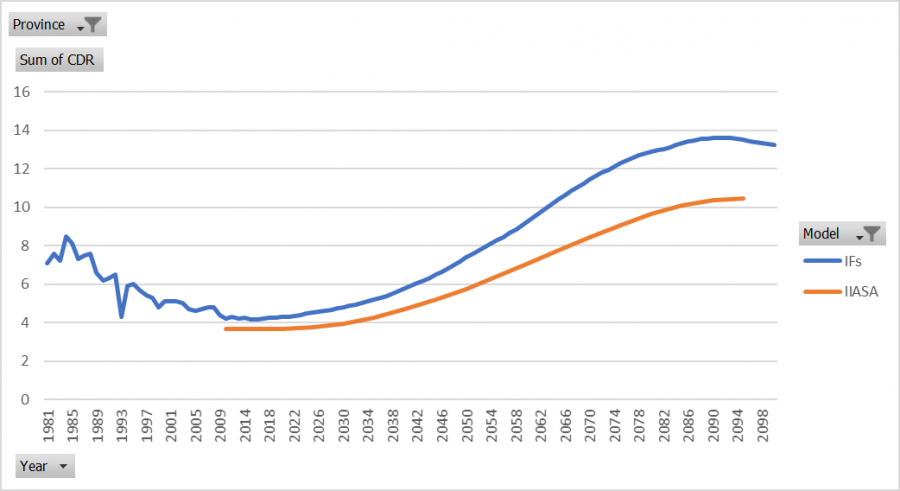
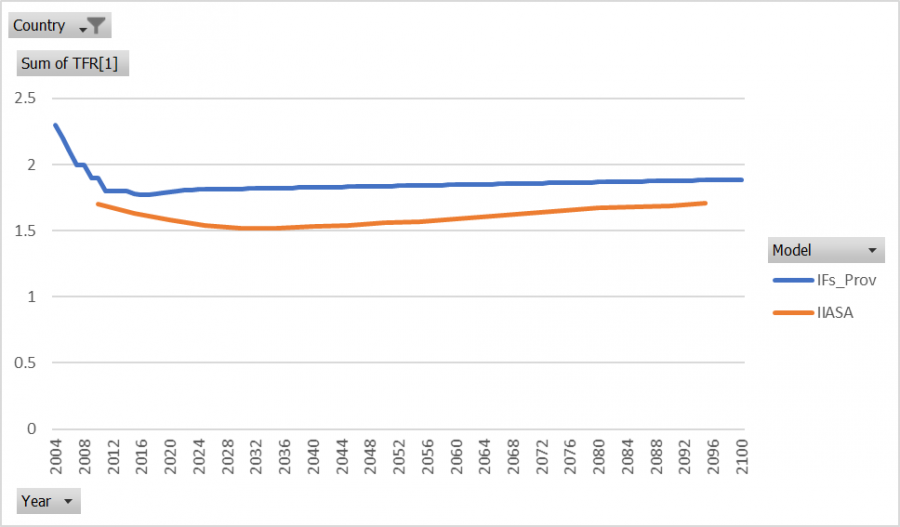
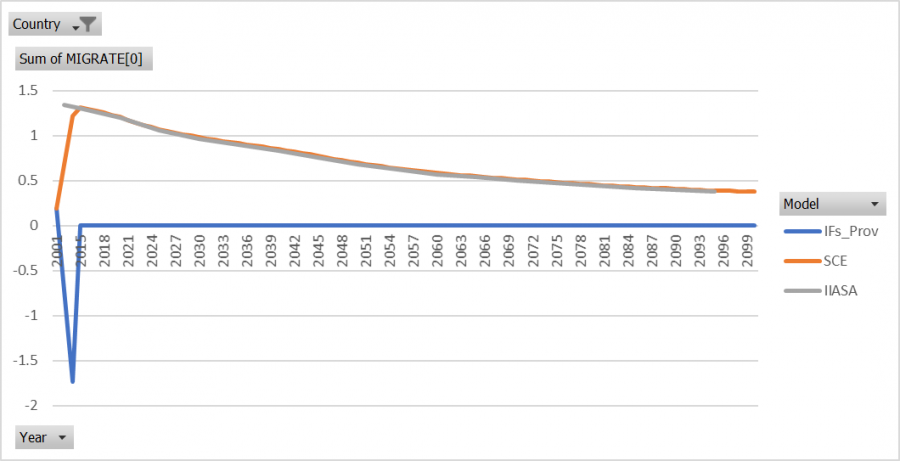
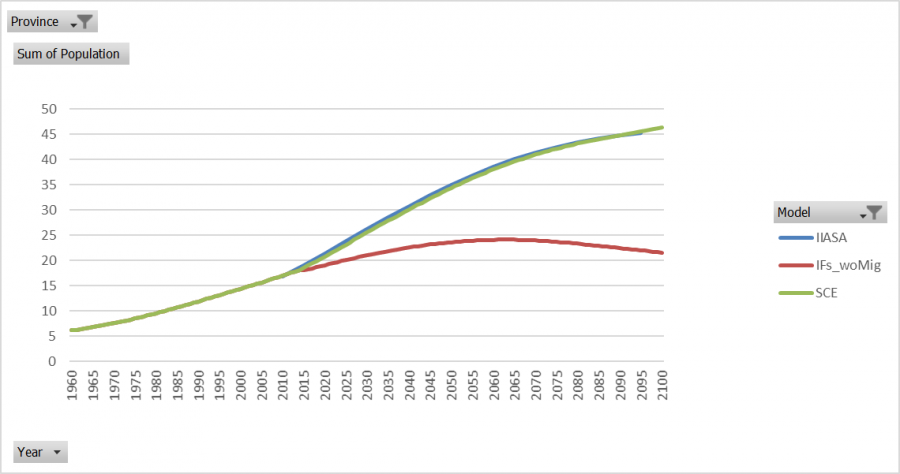
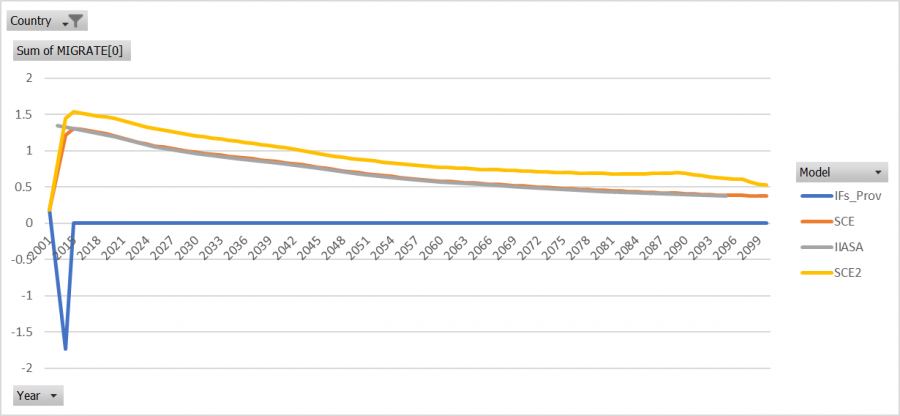
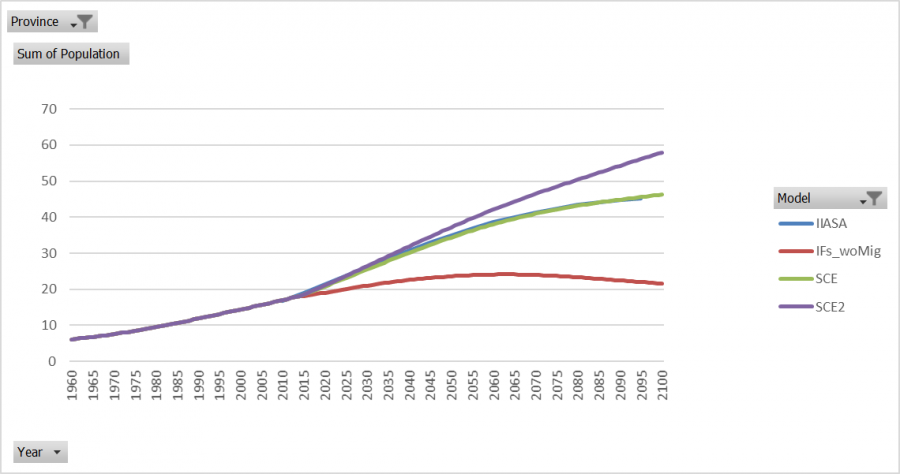
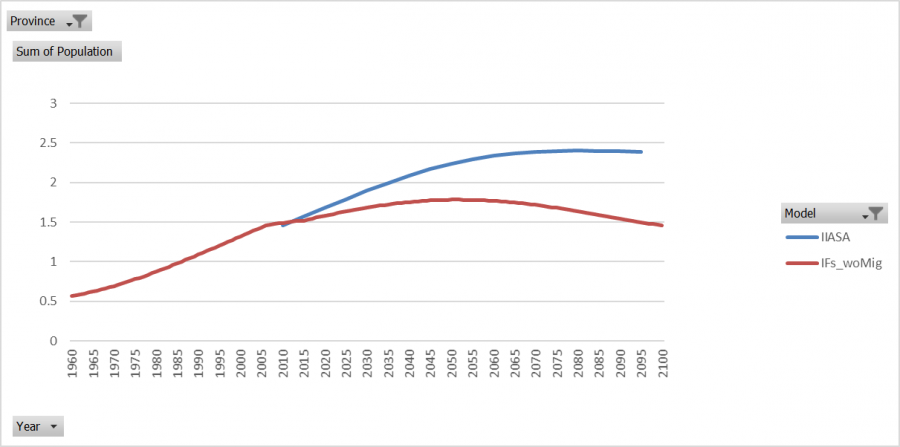
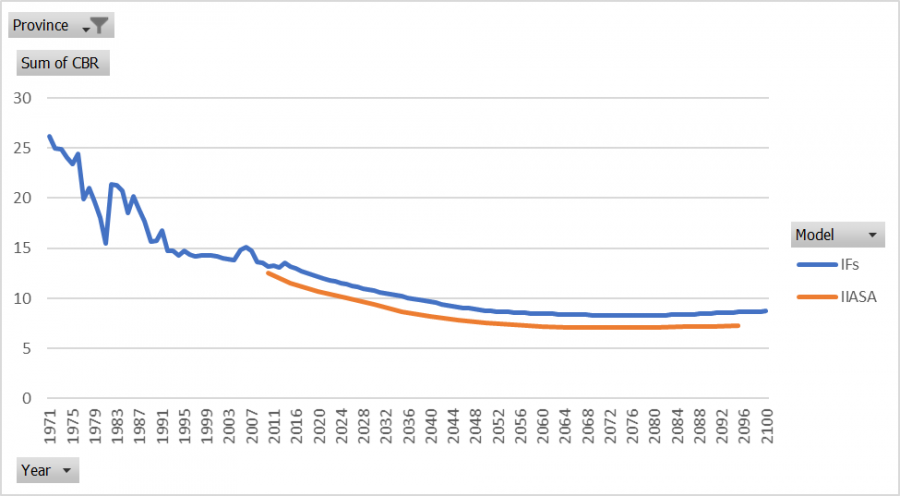
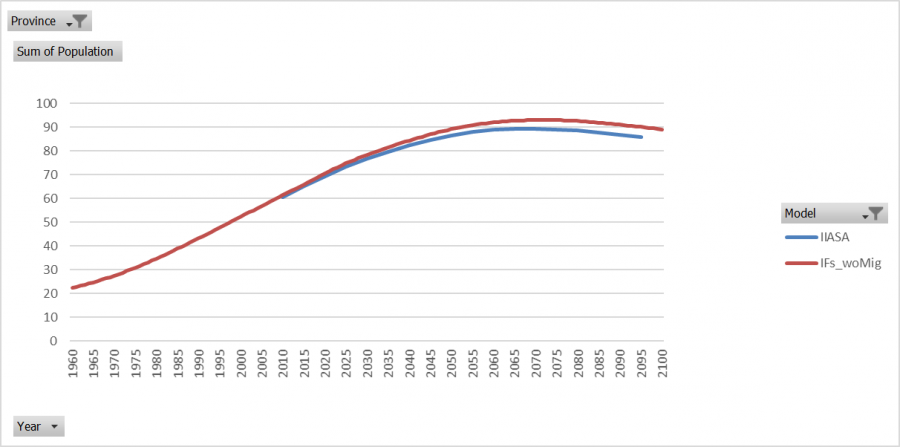
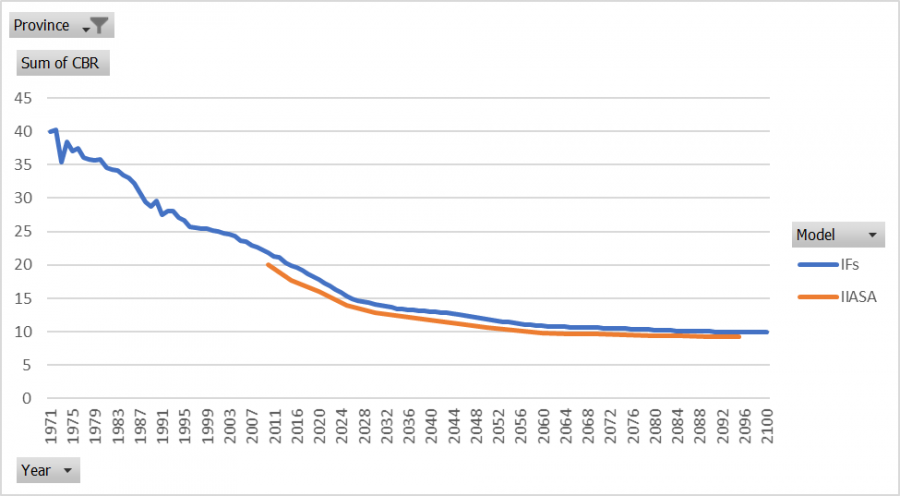
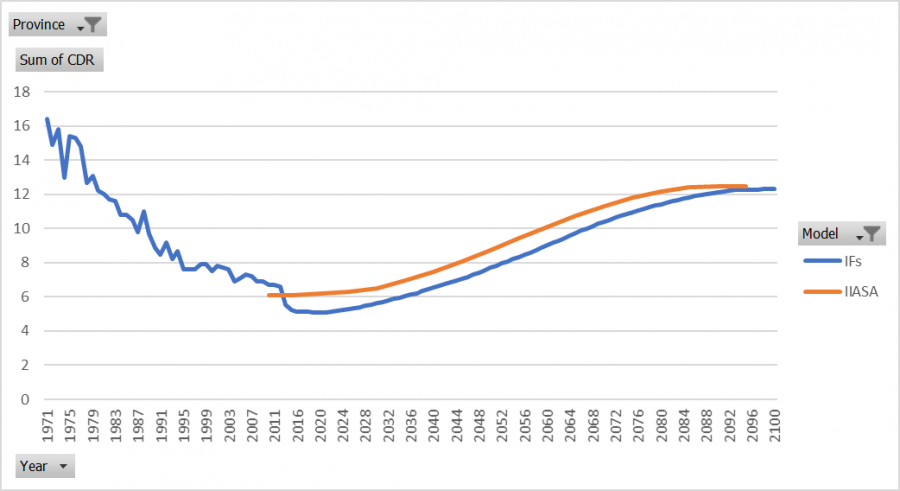
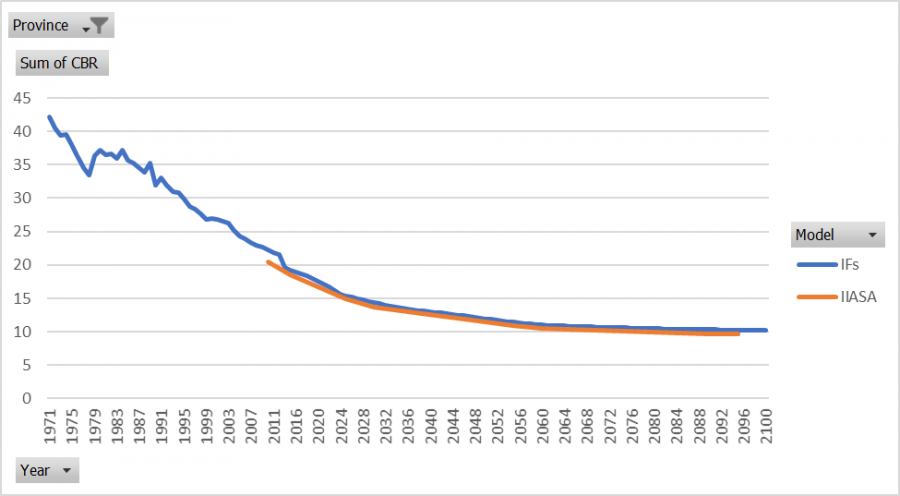
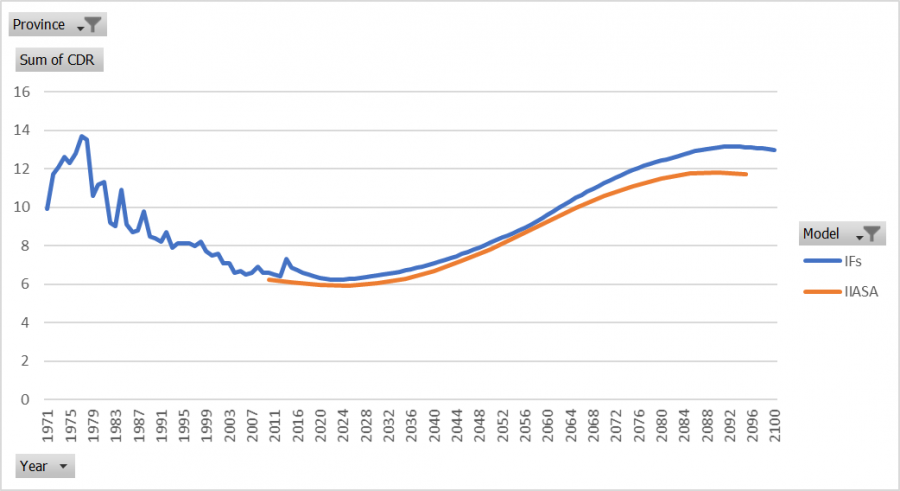
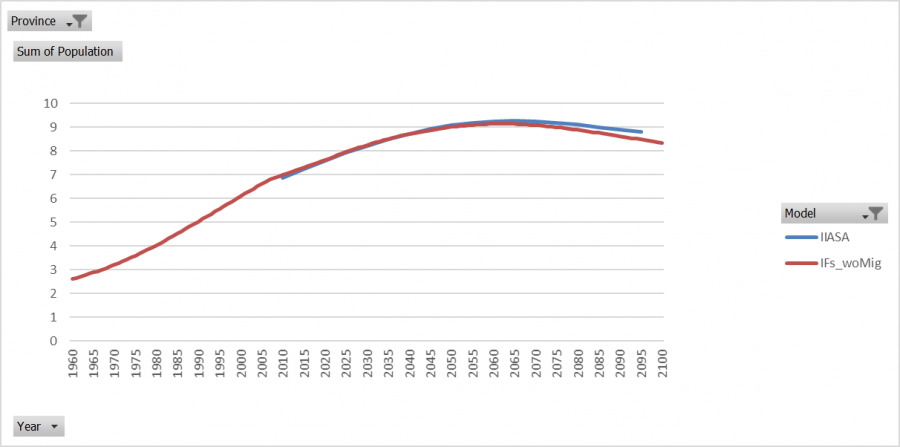
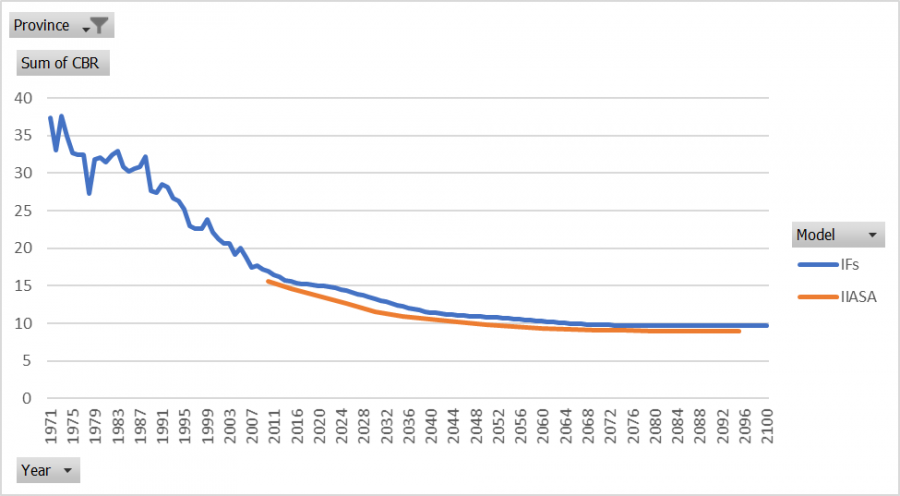
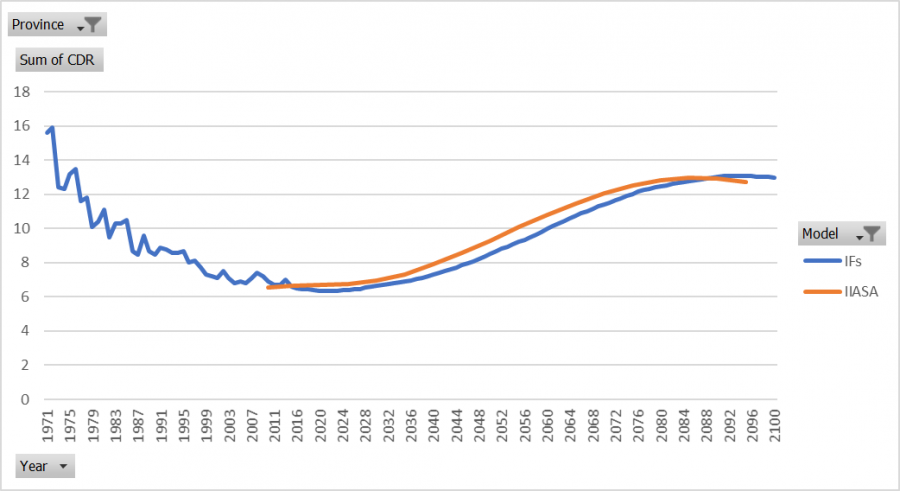
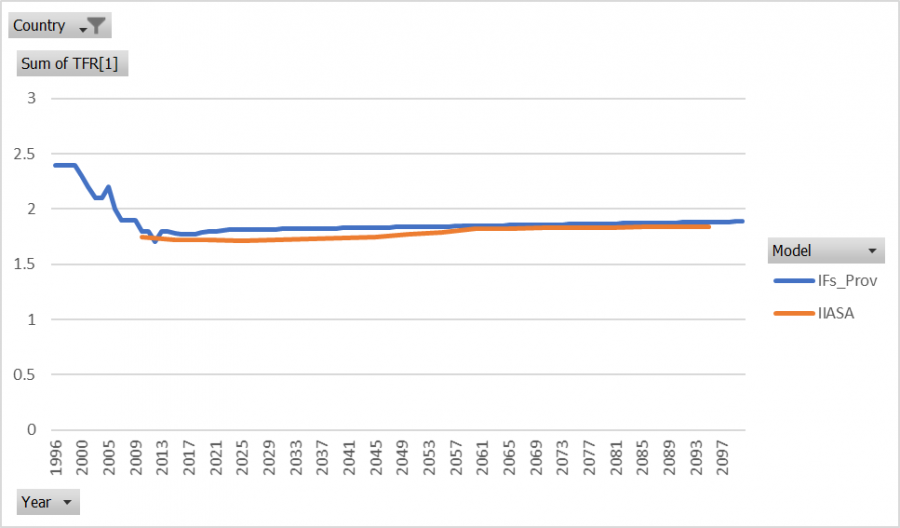
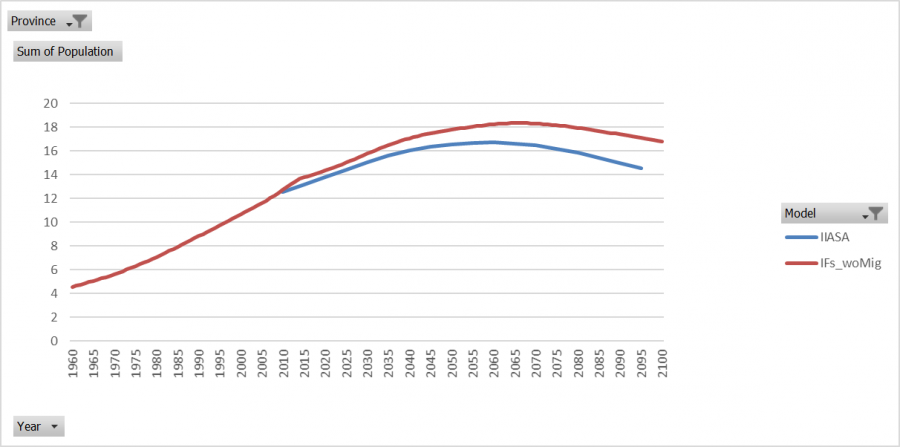
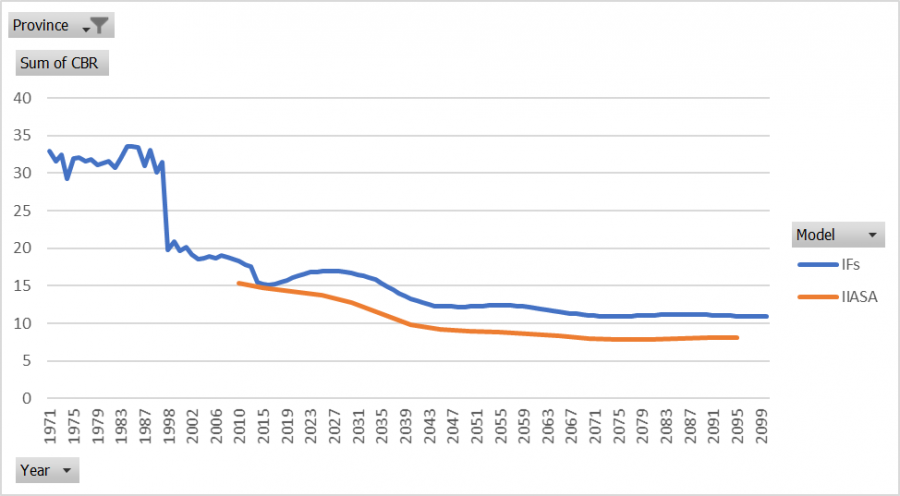
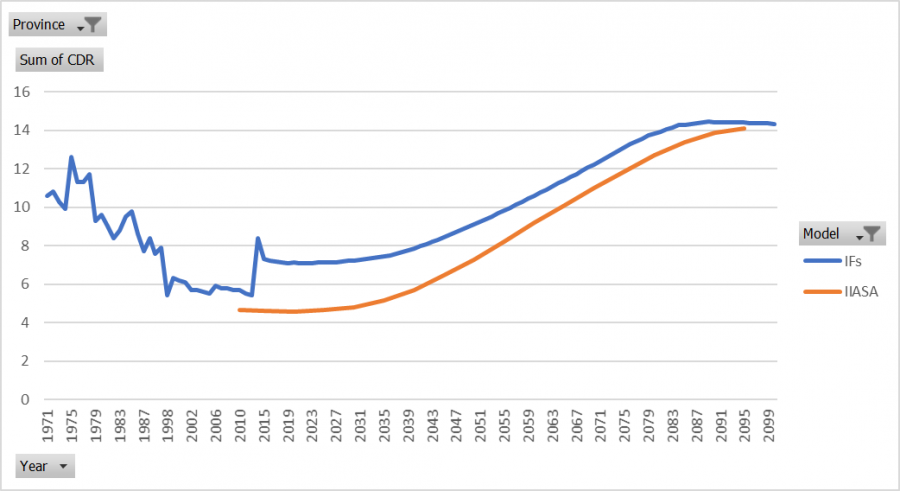
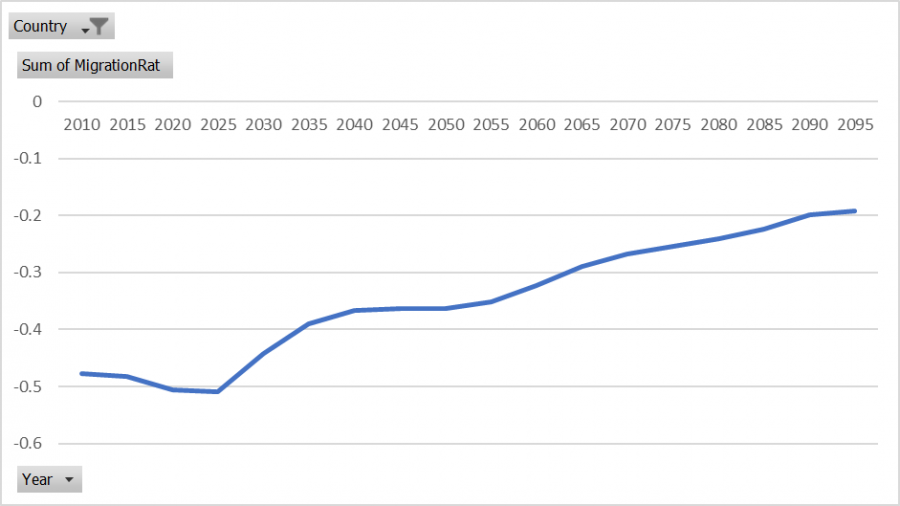
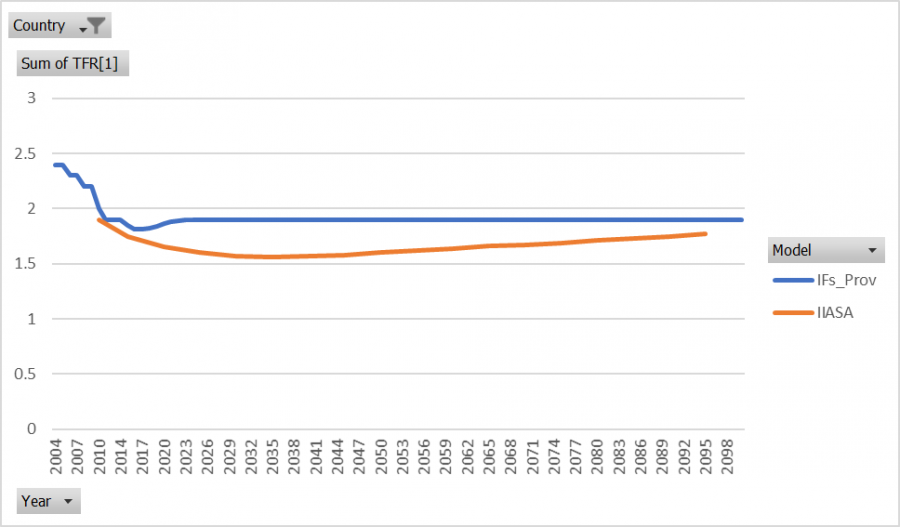
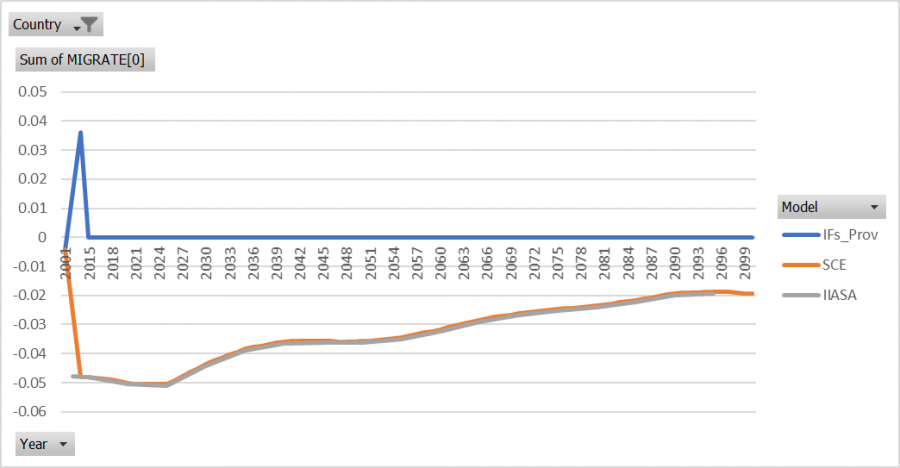
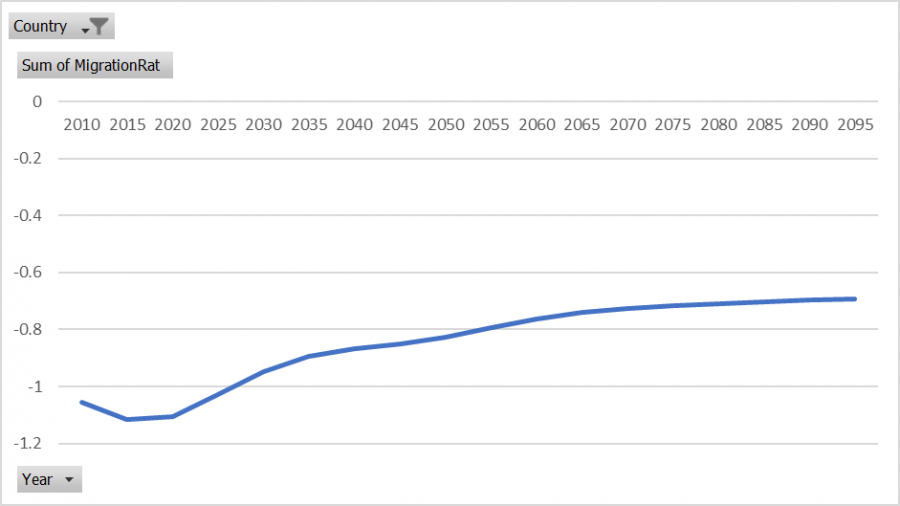
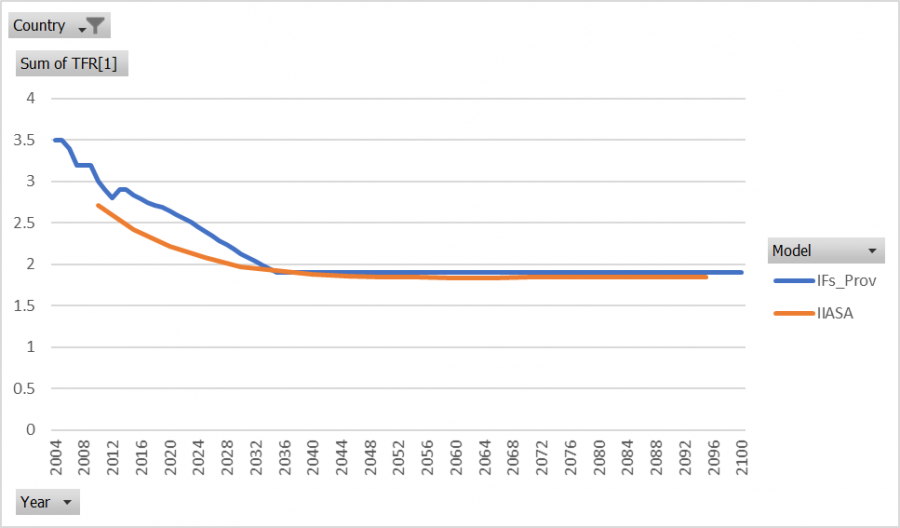
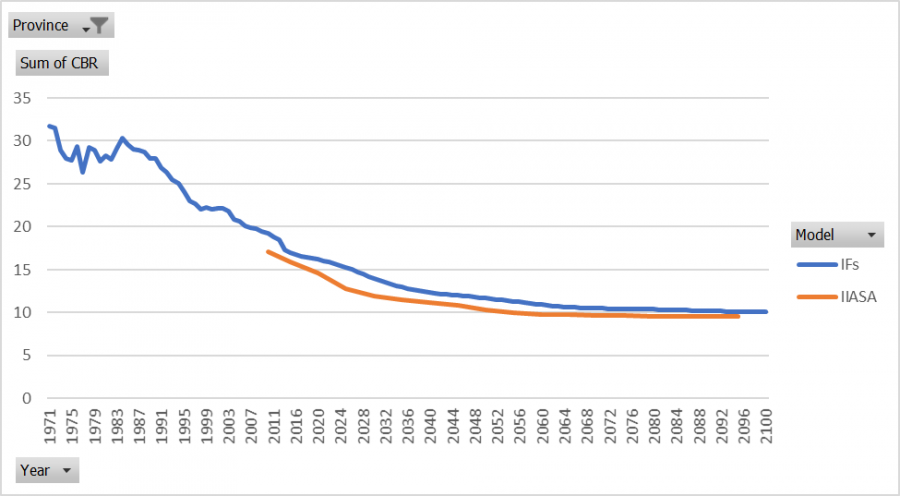
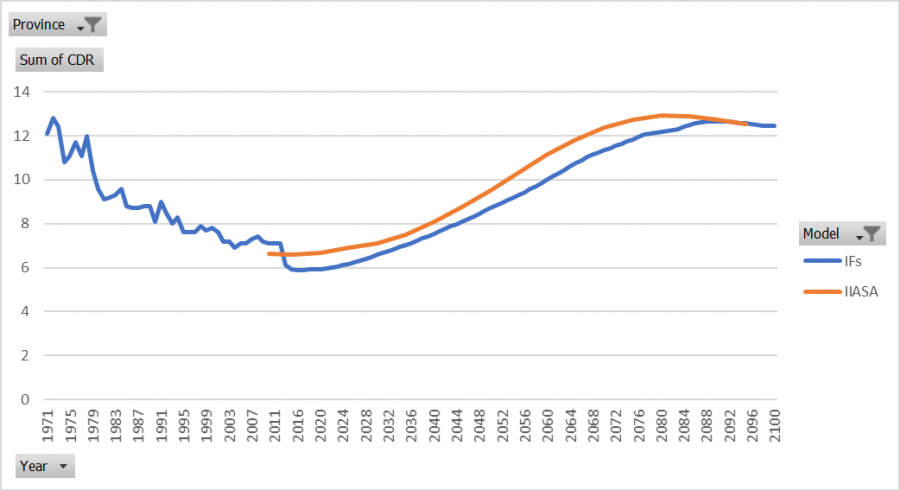
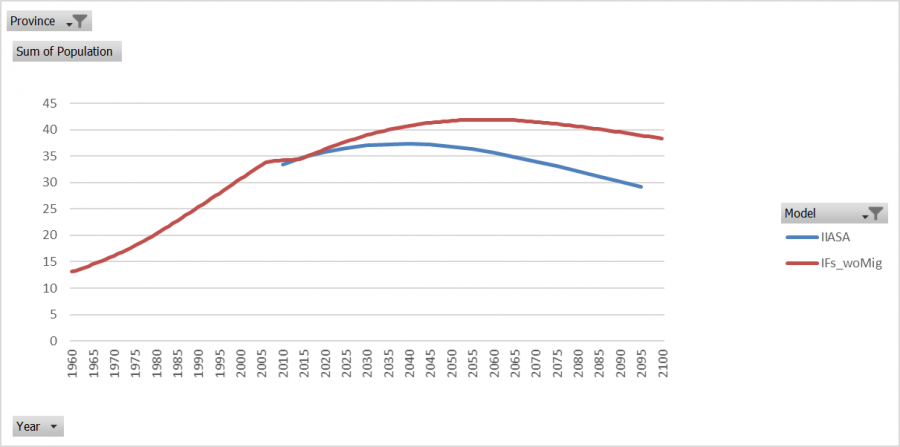
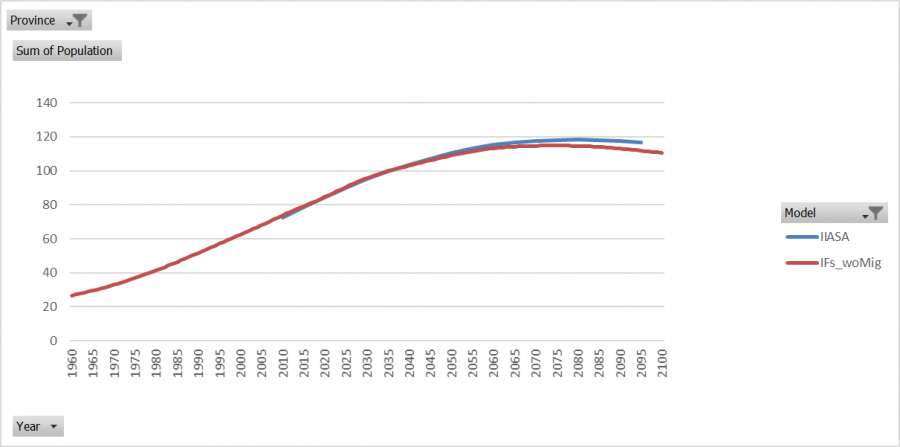
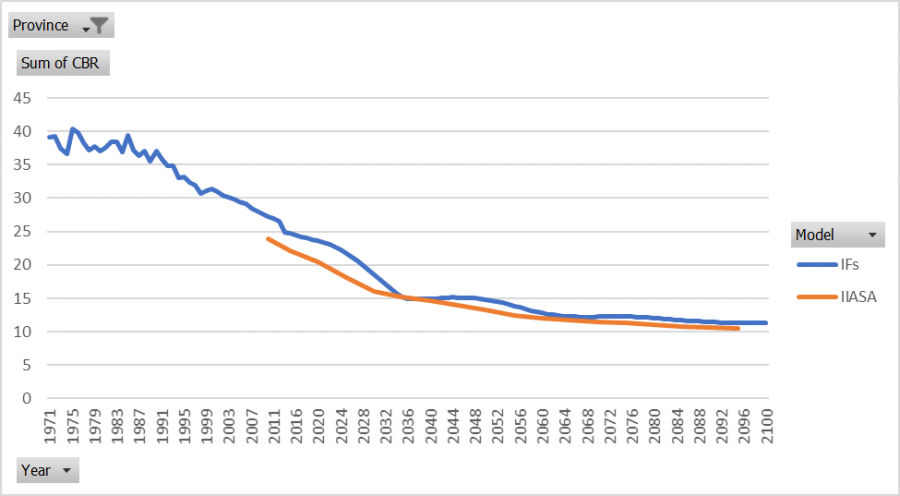
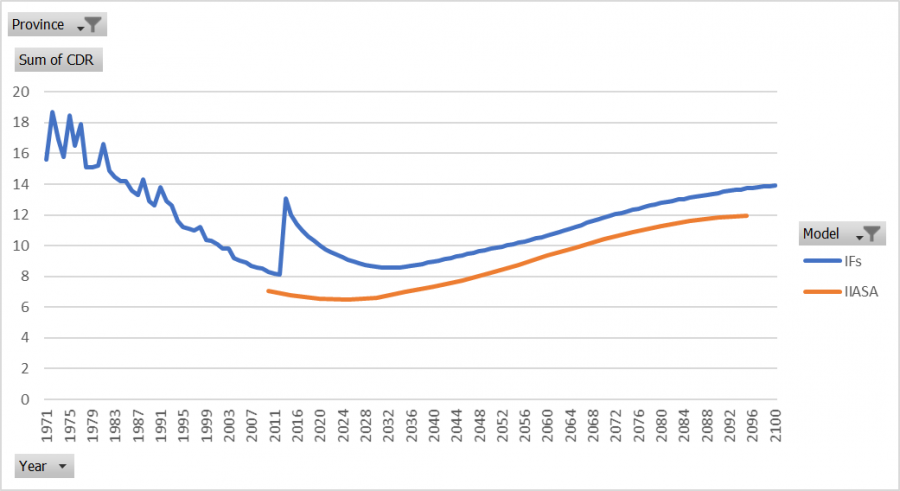
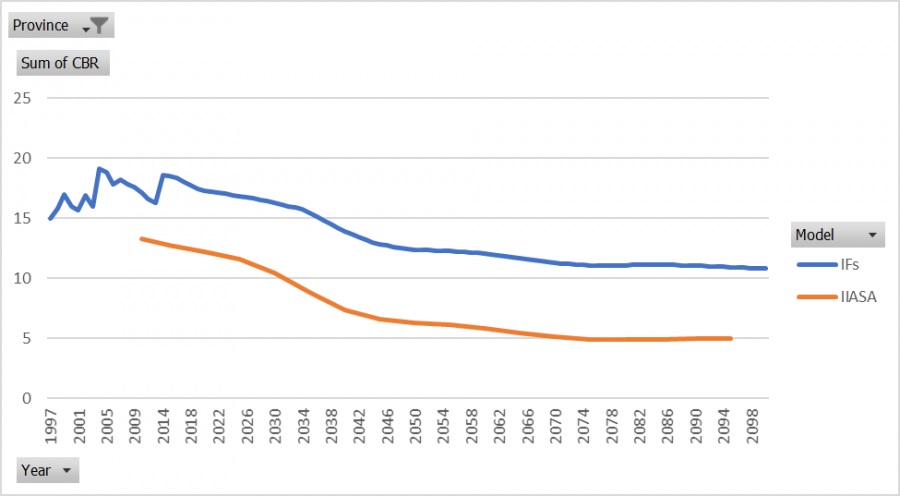
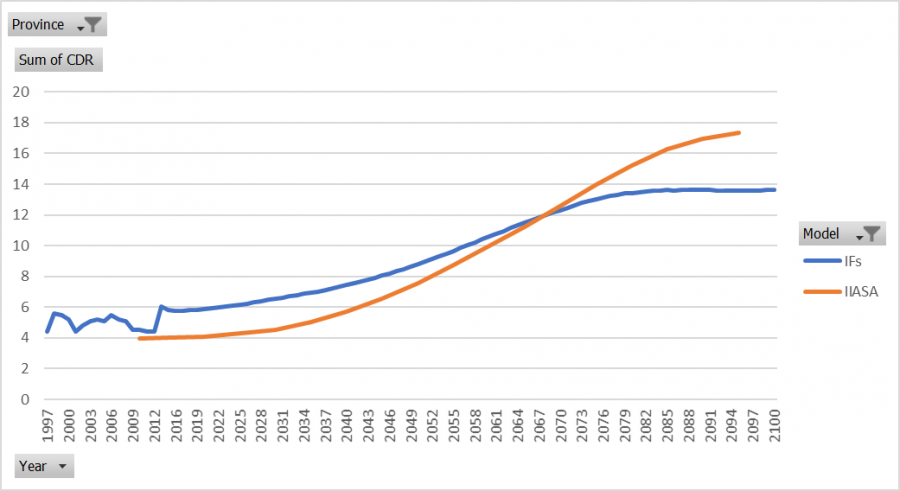
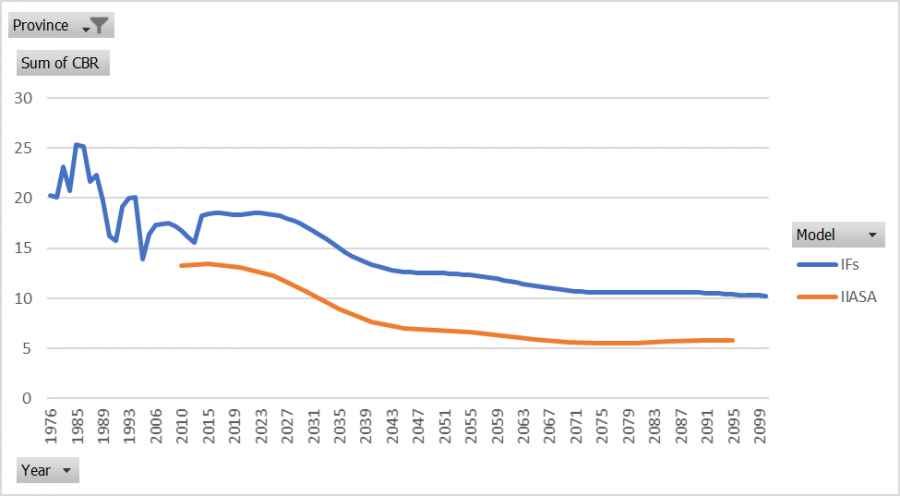
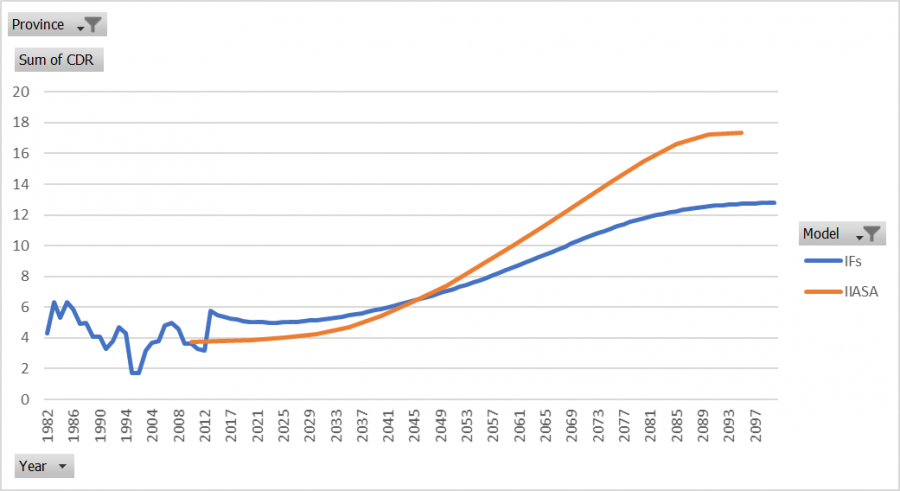
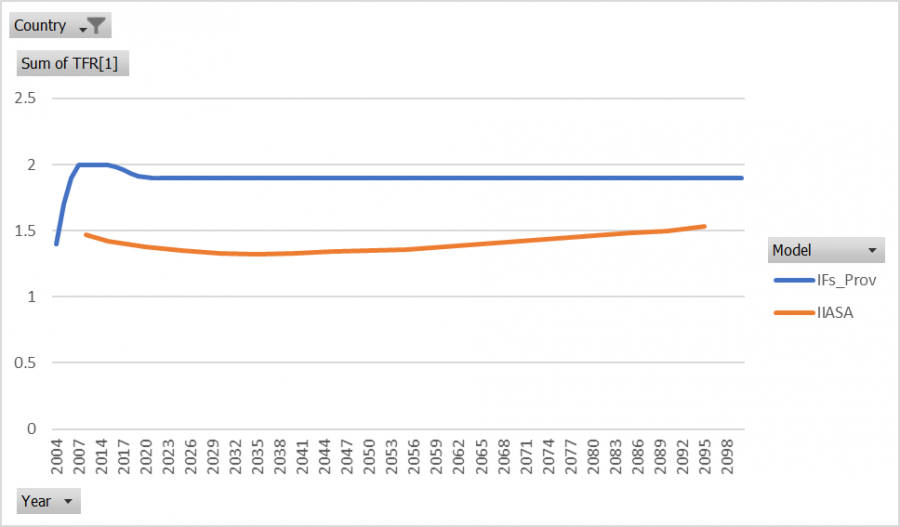
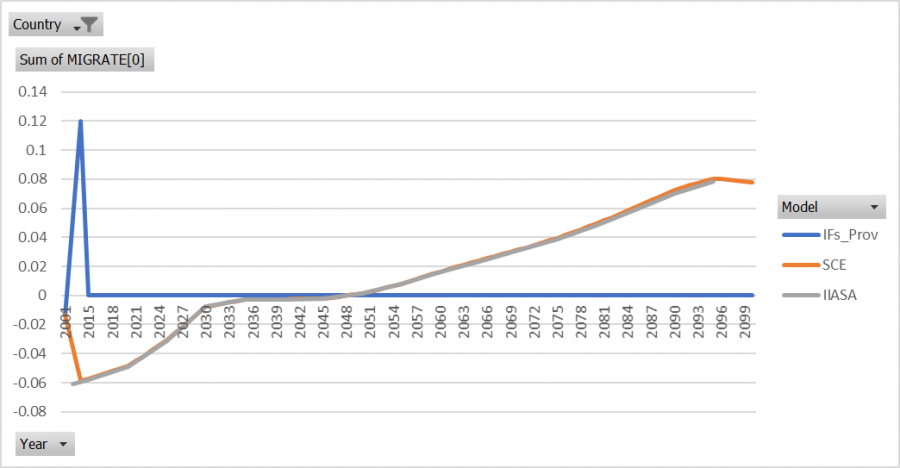
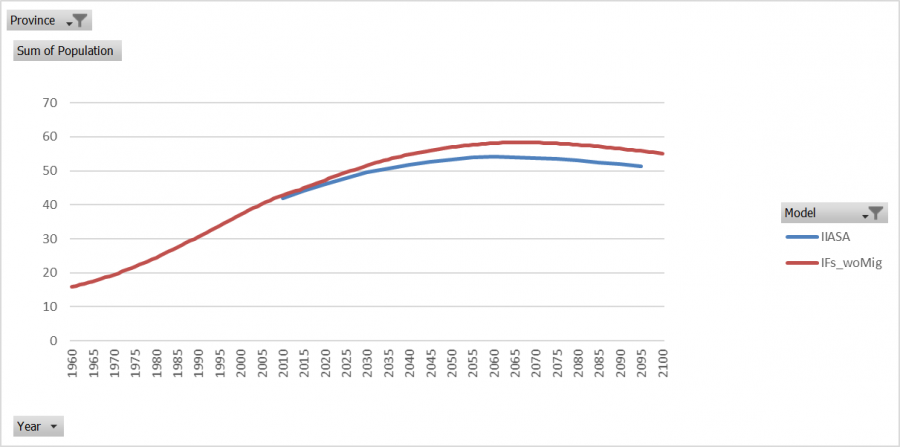
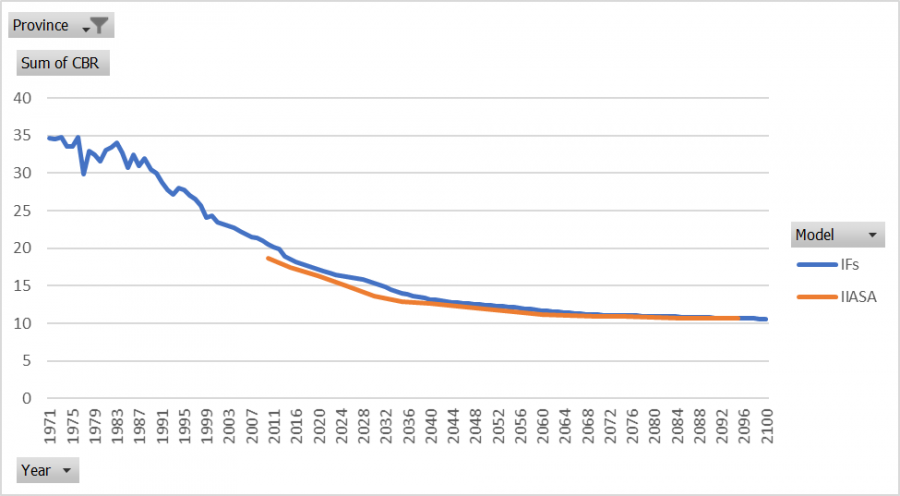
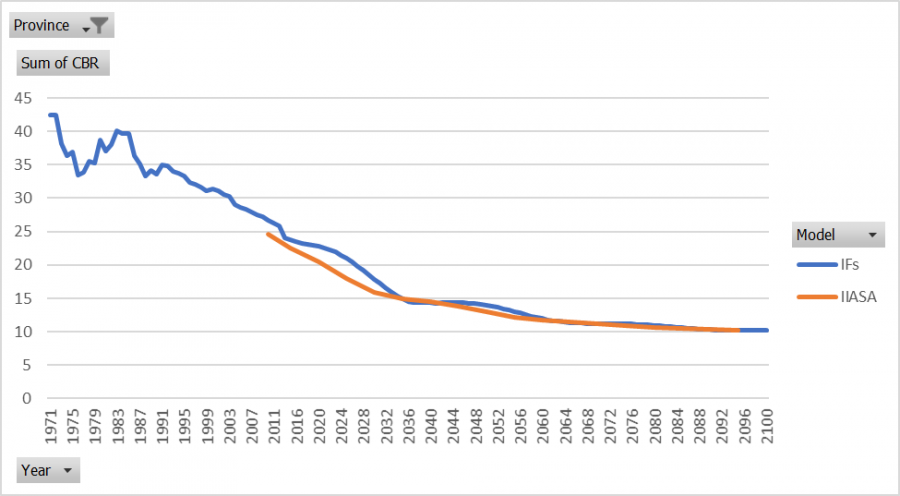
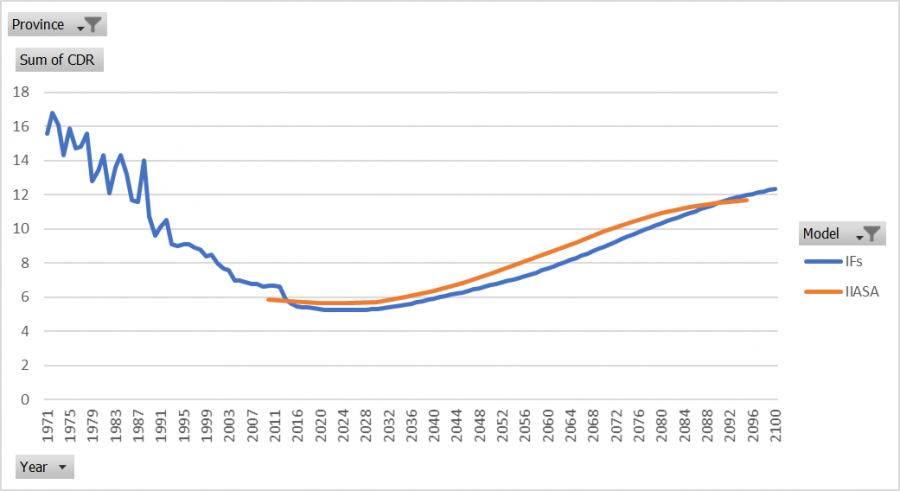
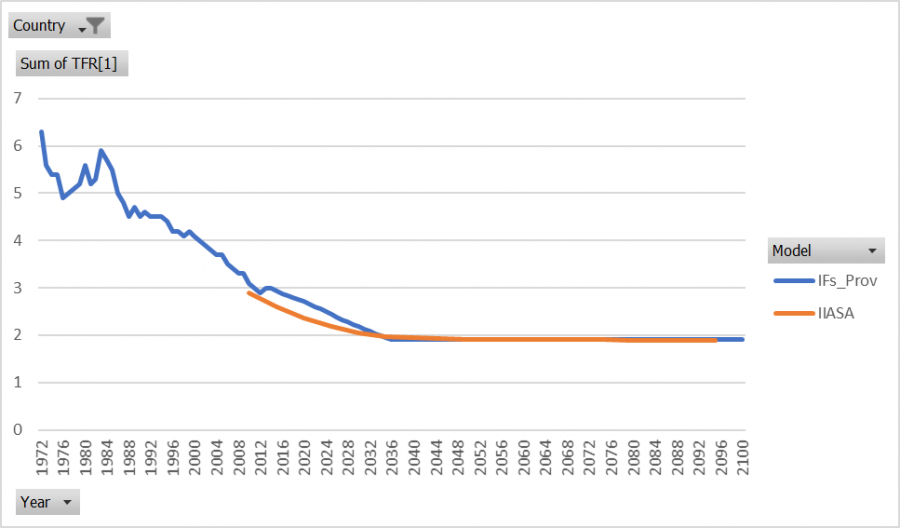
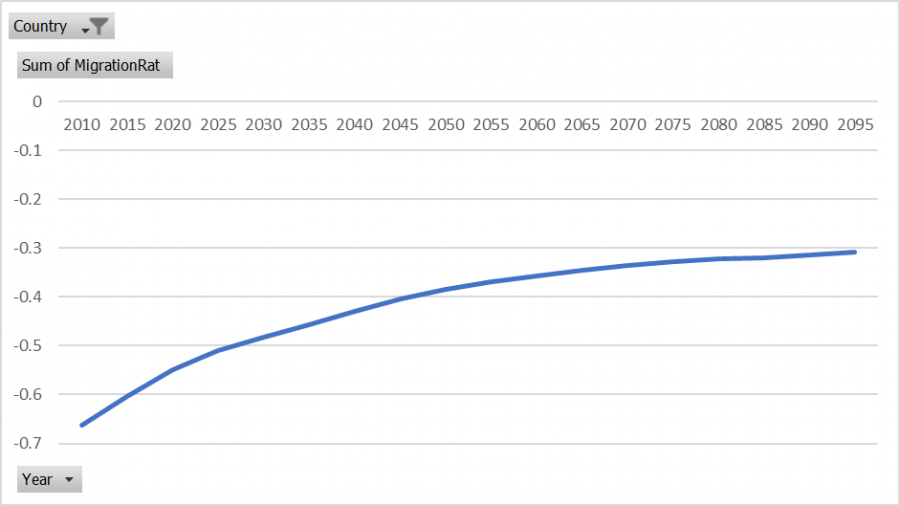
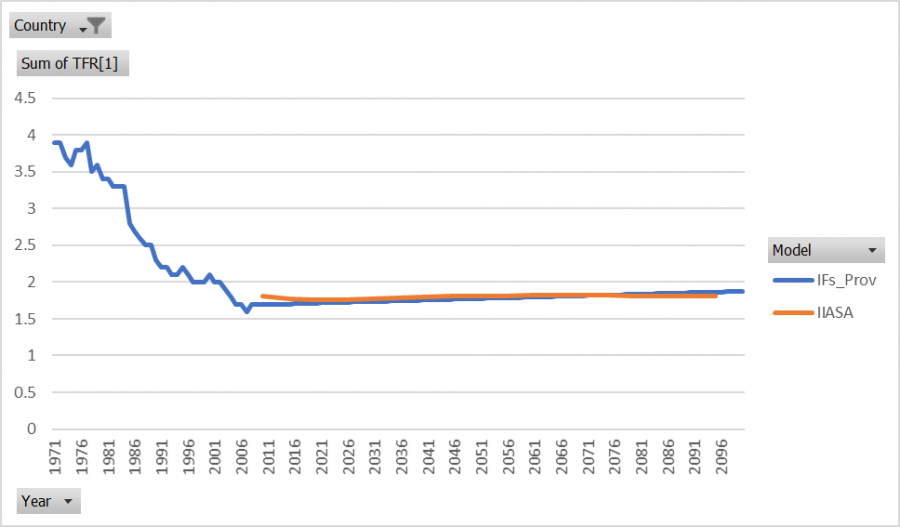
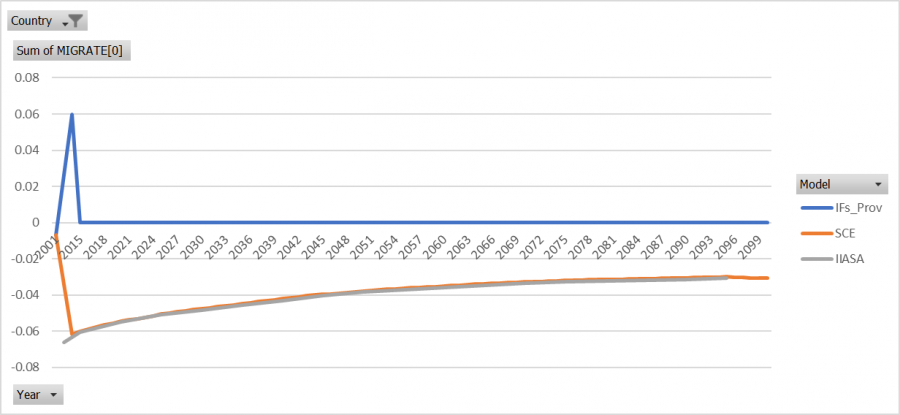
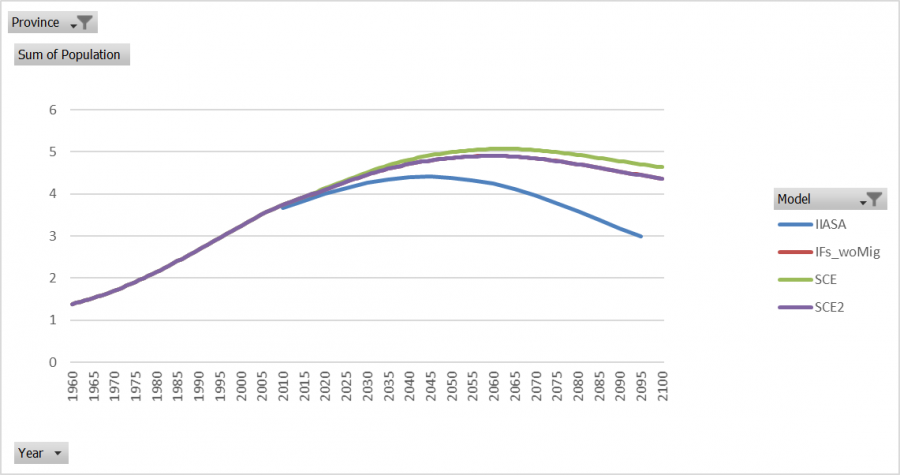
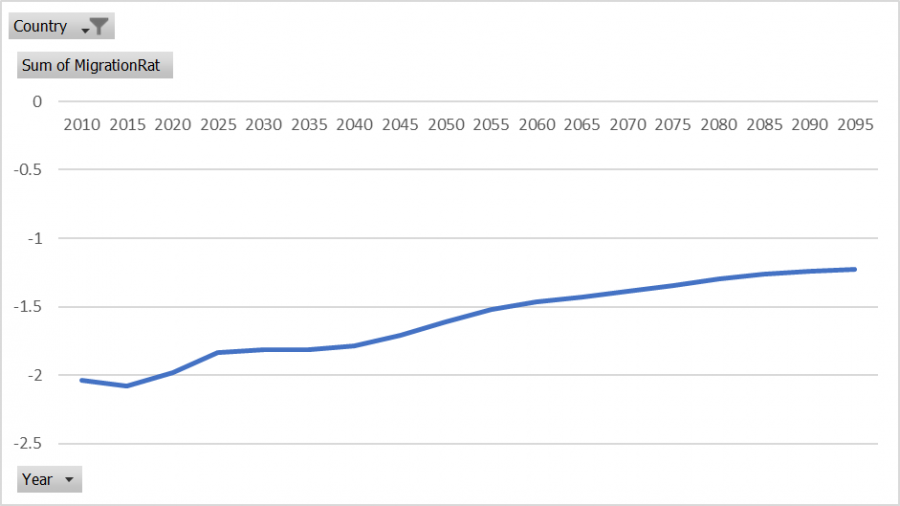
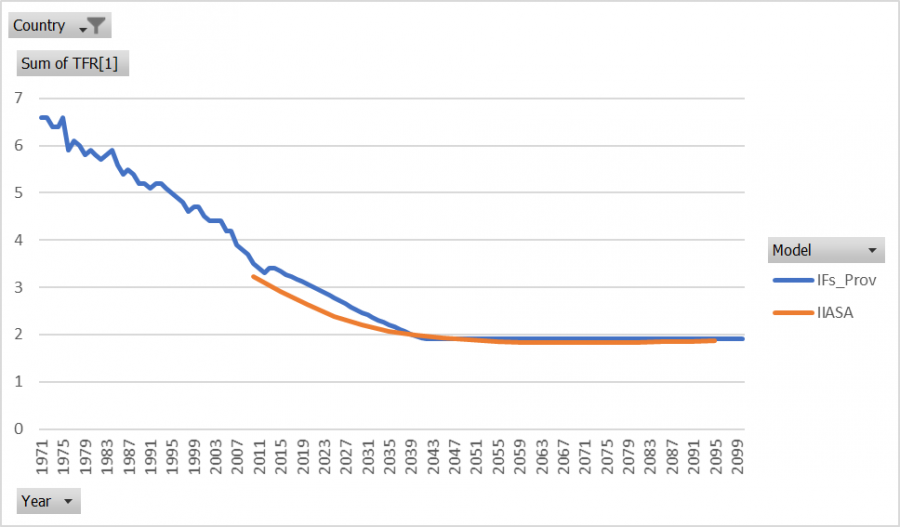
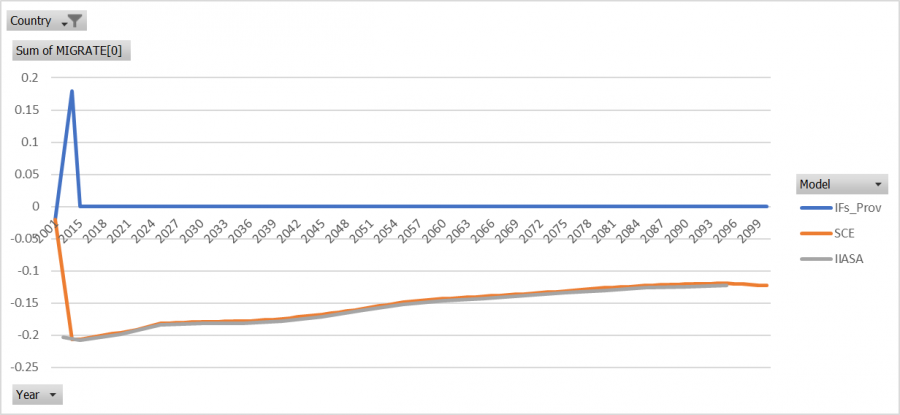
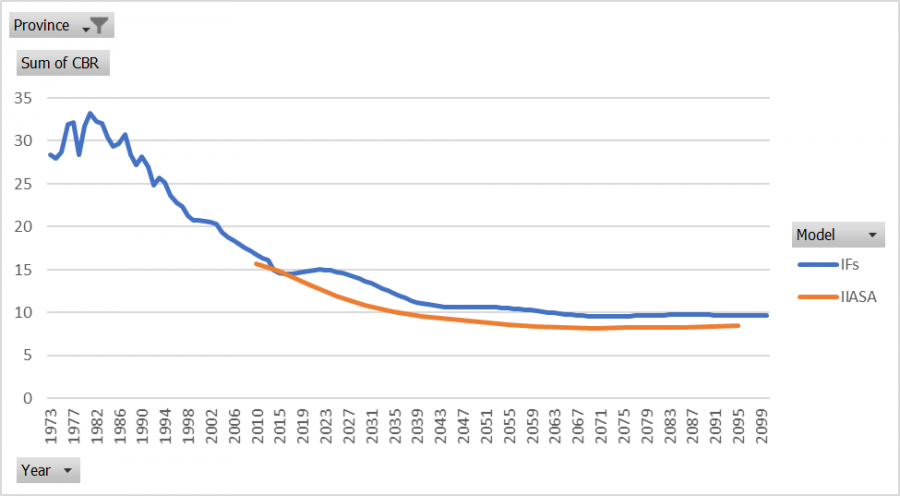
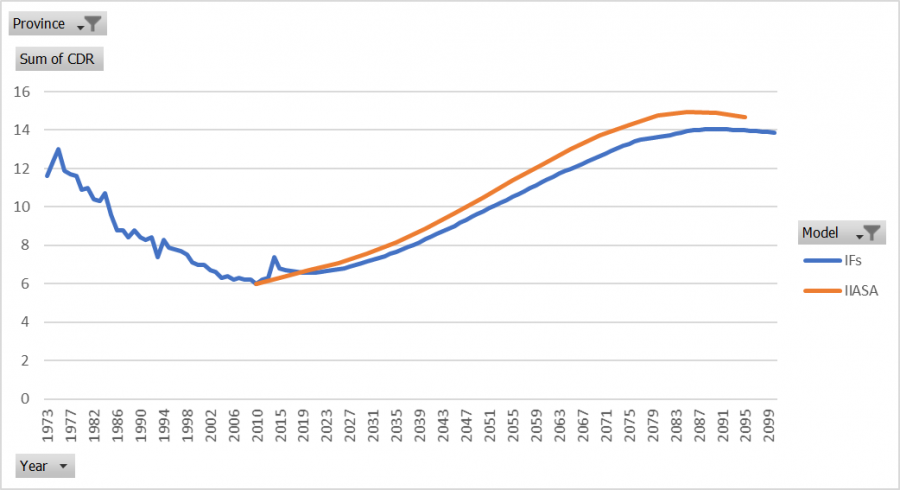
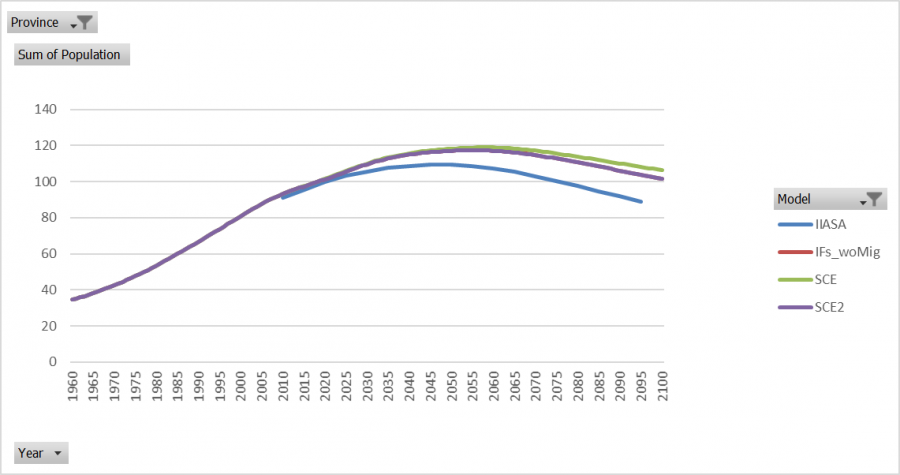
India's subnational population was rigorously vetted and one of the tools available was subnational population forecasts that were developed by IIASA. These forecasts were compared with each state and territory in India, as were the components of these forecasts. The components include births, deaths, and migration. Below is a state-by-state comparison of the IFs base case (without migration) with IIASA's forecasts for population, births, deaths, and migration. | India's subnational population was rigorously vetted and one of the tools available was subnational population forecasts that were developed by IIASA. These forecasts were compared with each state and territory in India, as were the components of these forecasts. The components include births, deaths, and migration. Below is a state-by-state comparison of the IFs base case (without migration) with IIASA's forecasts for population, births, deaths, and migration. | ||
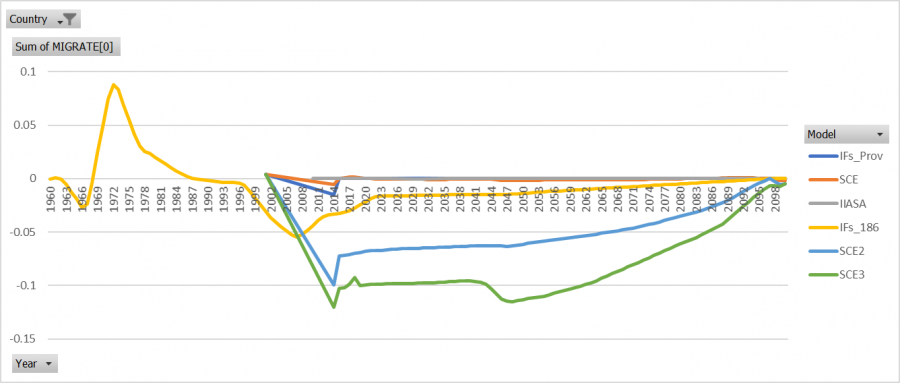
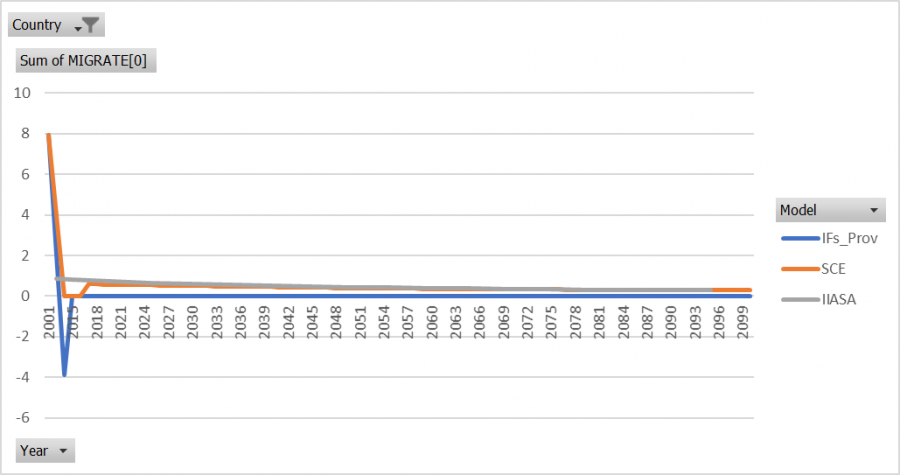
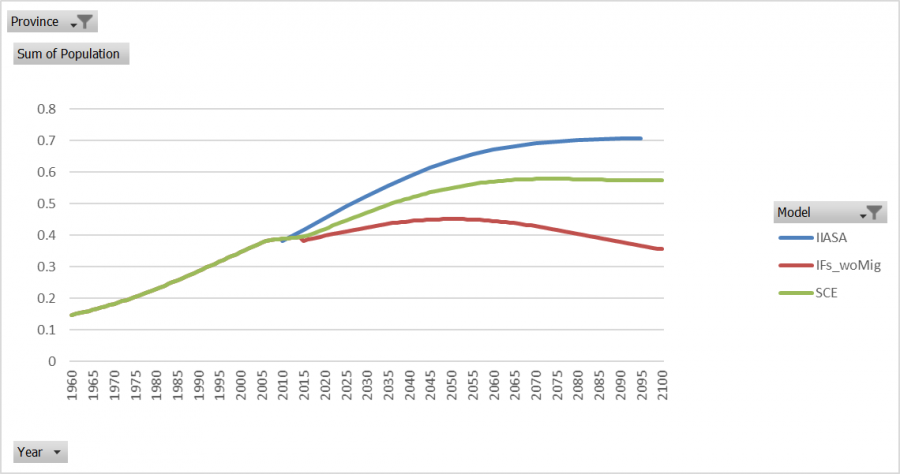
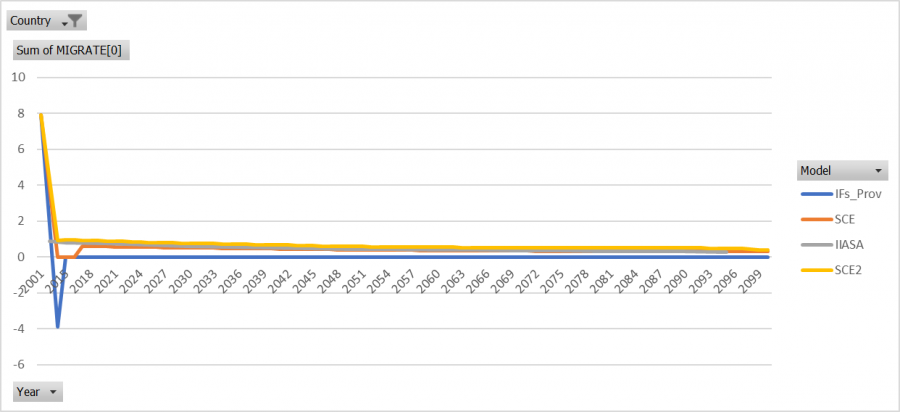
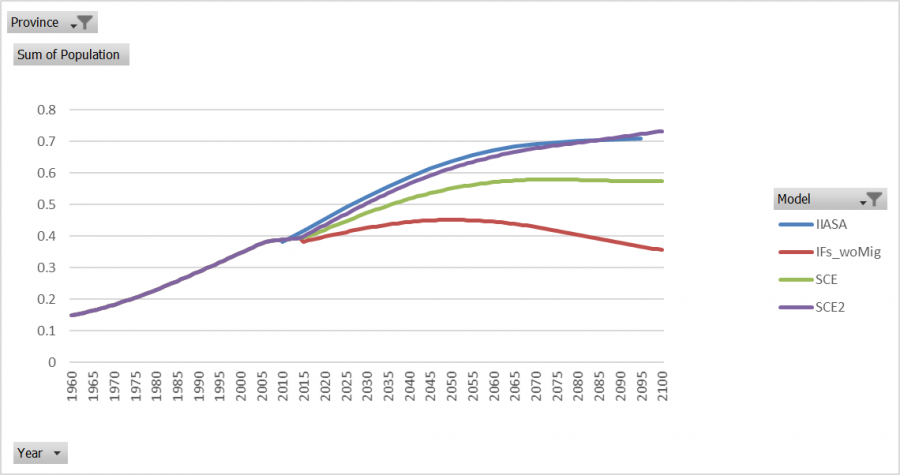
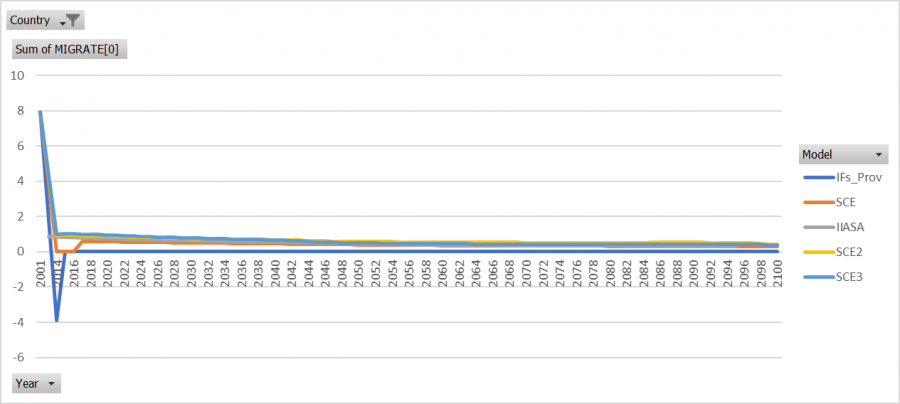
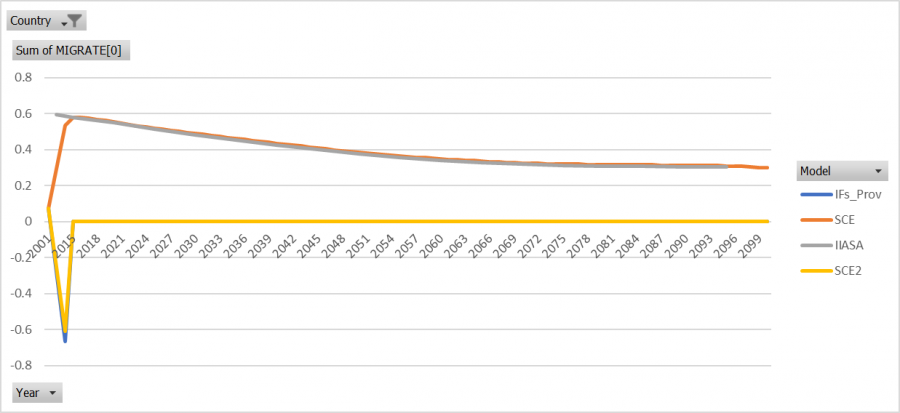
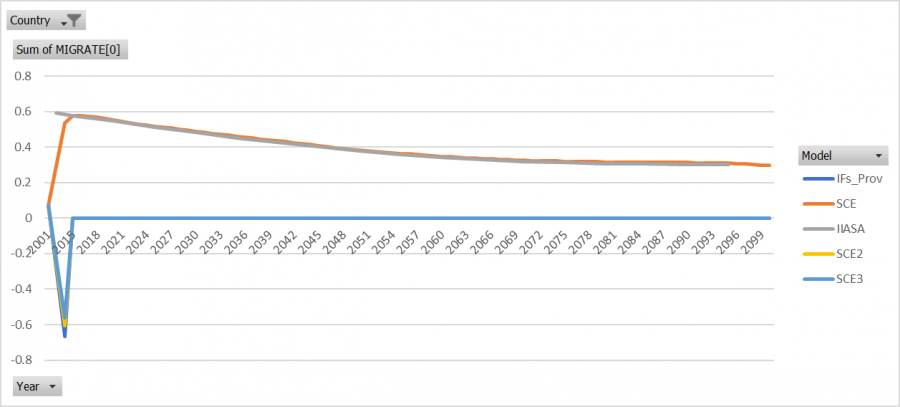
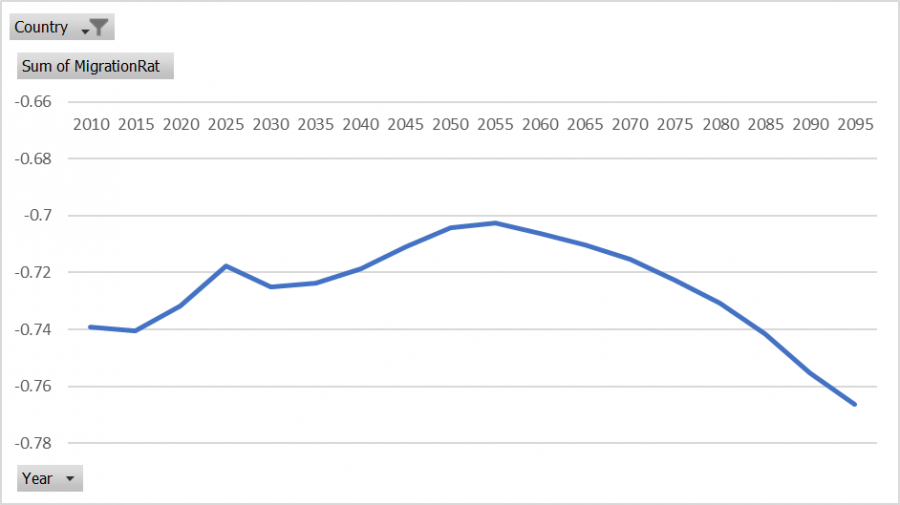
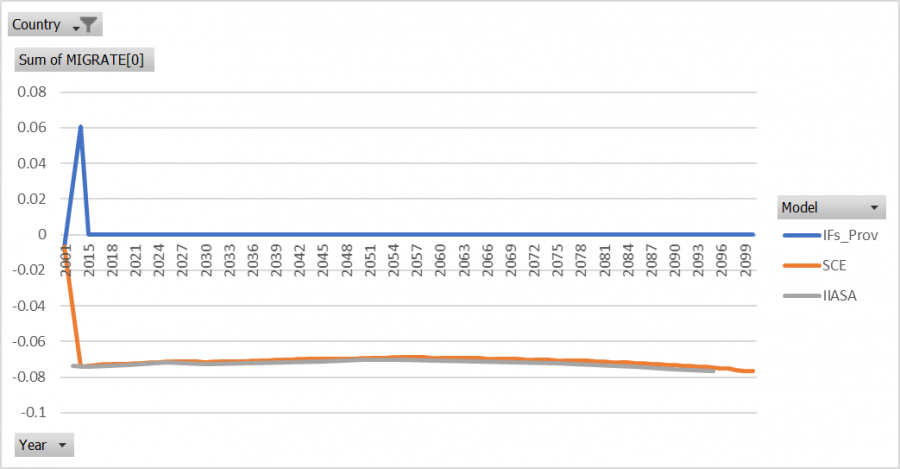
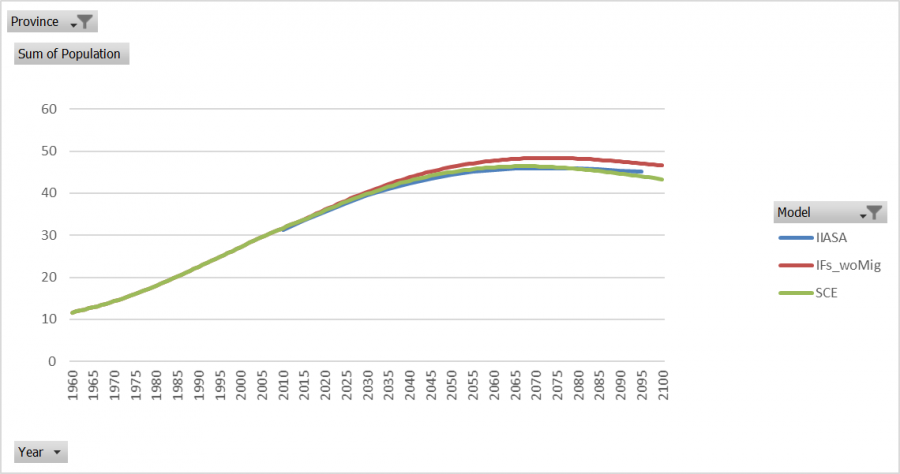
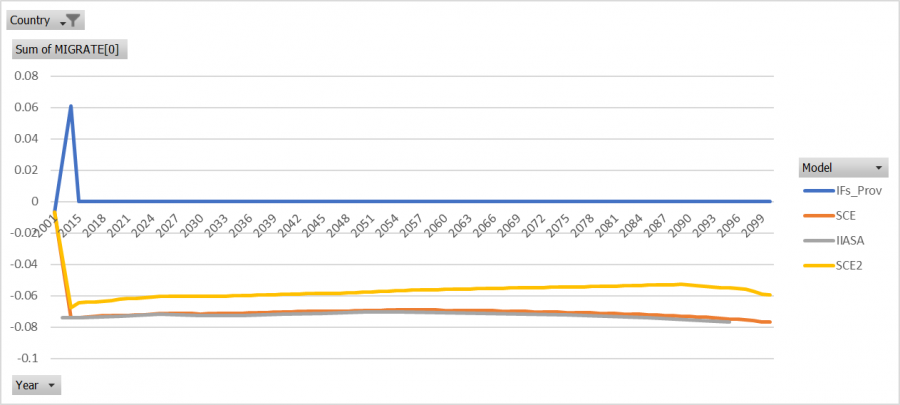
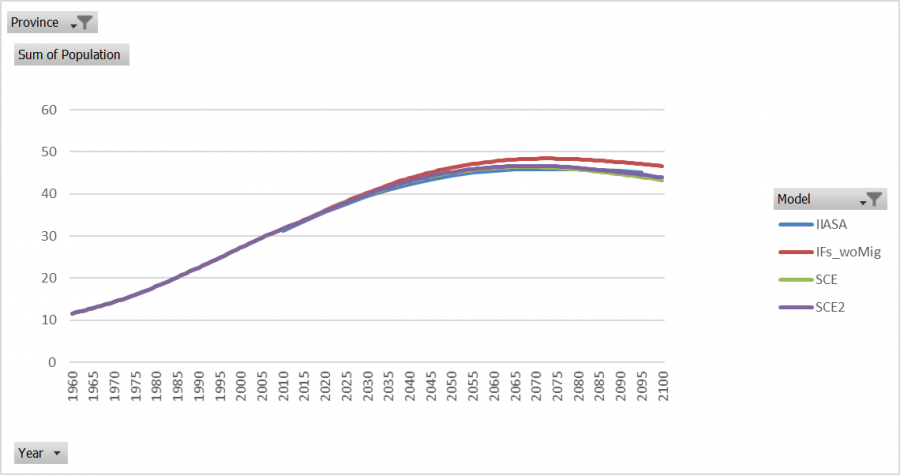
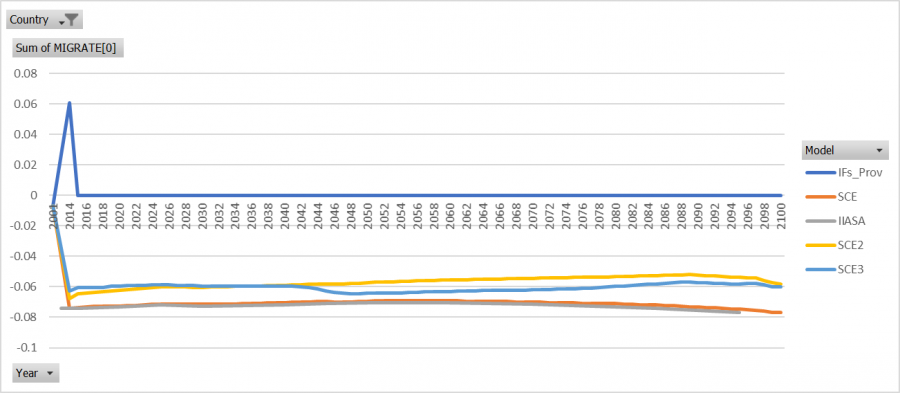
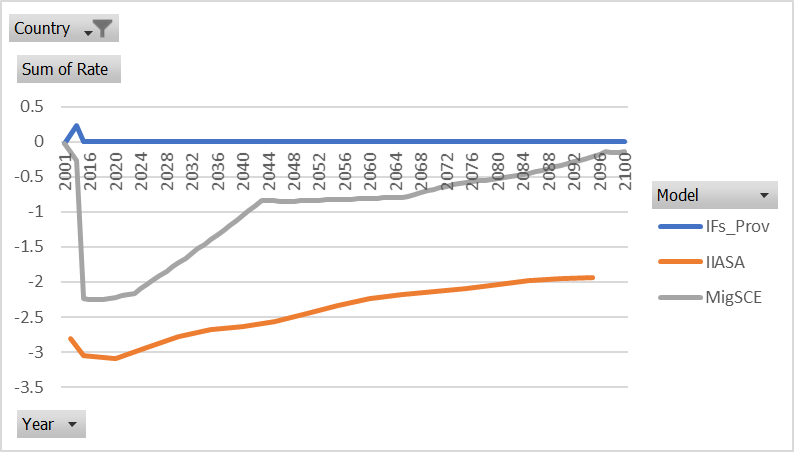
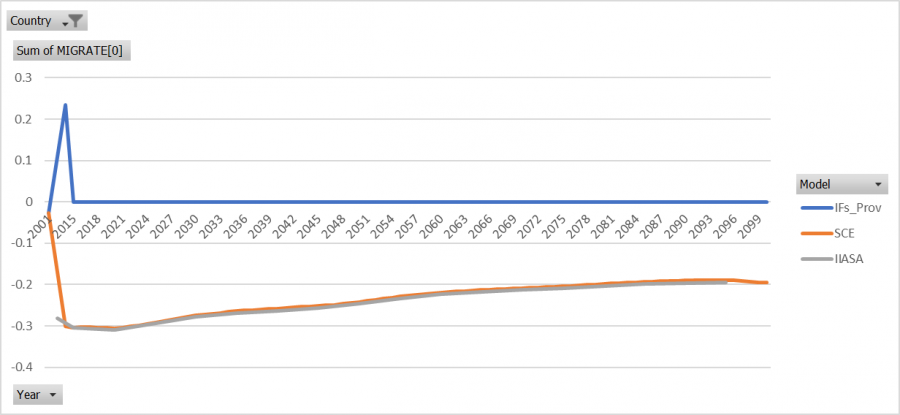
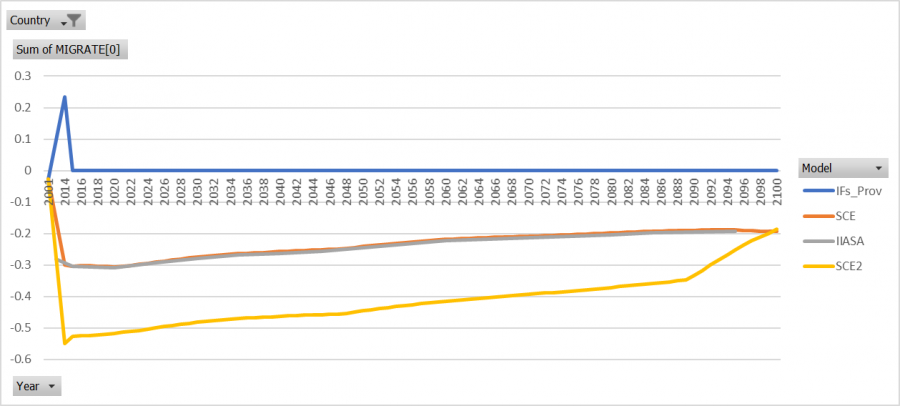
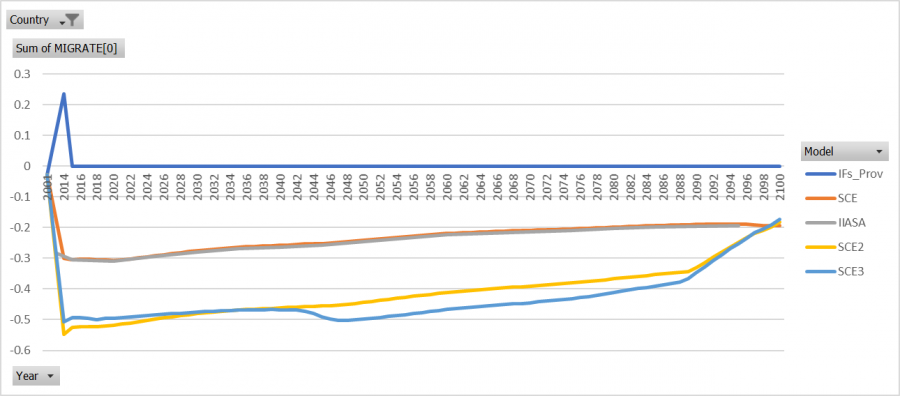
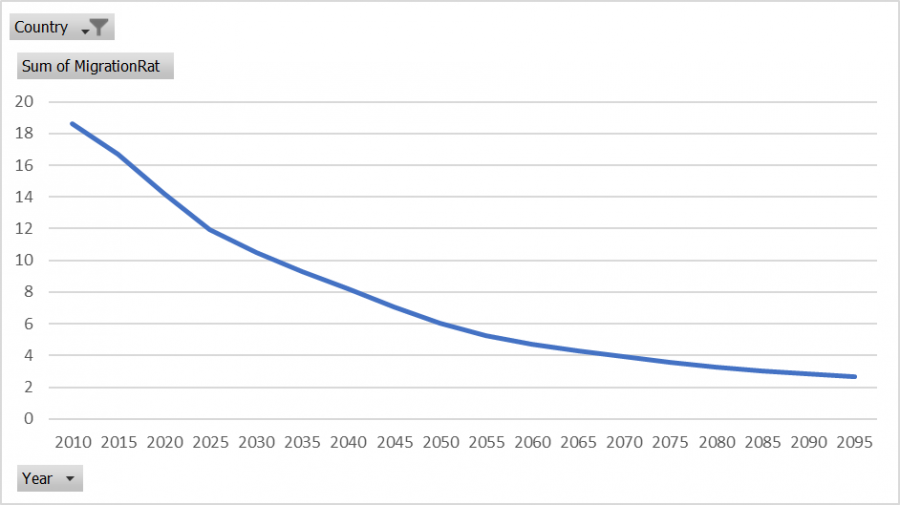
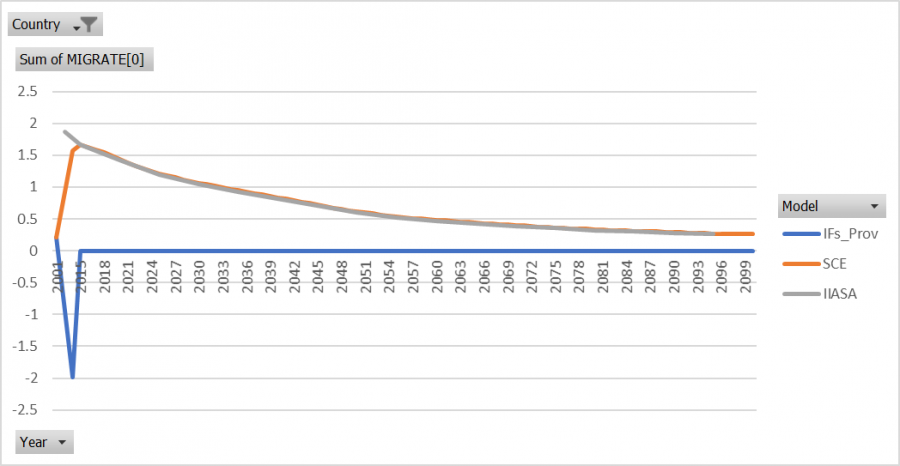
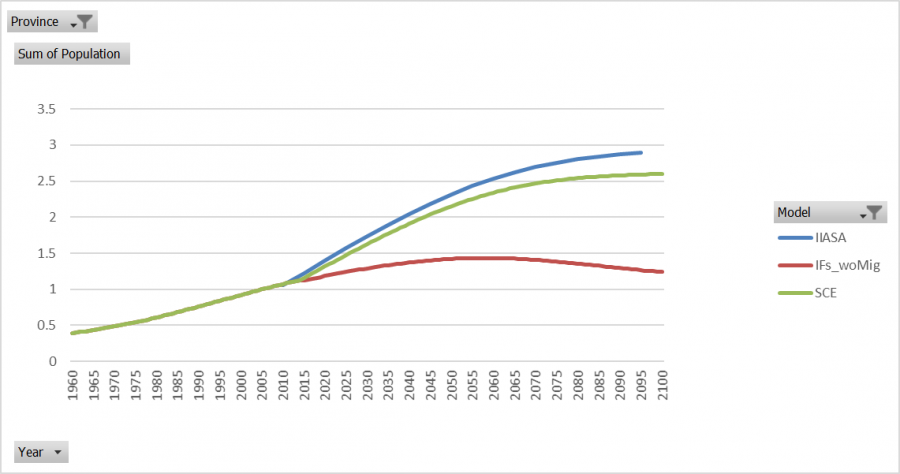
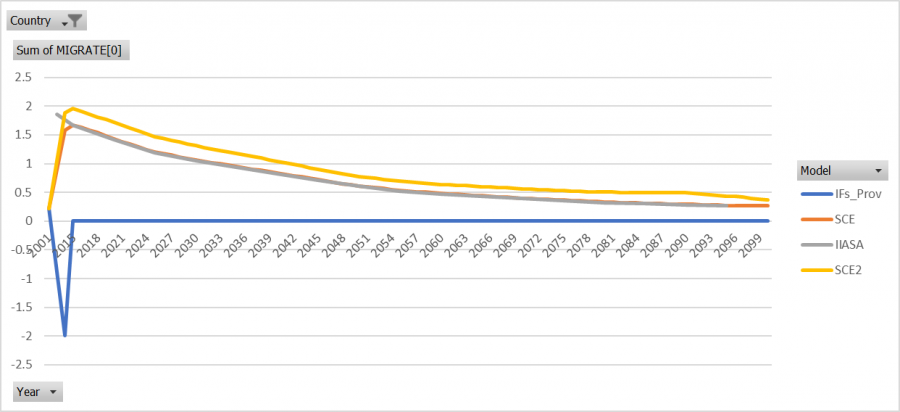
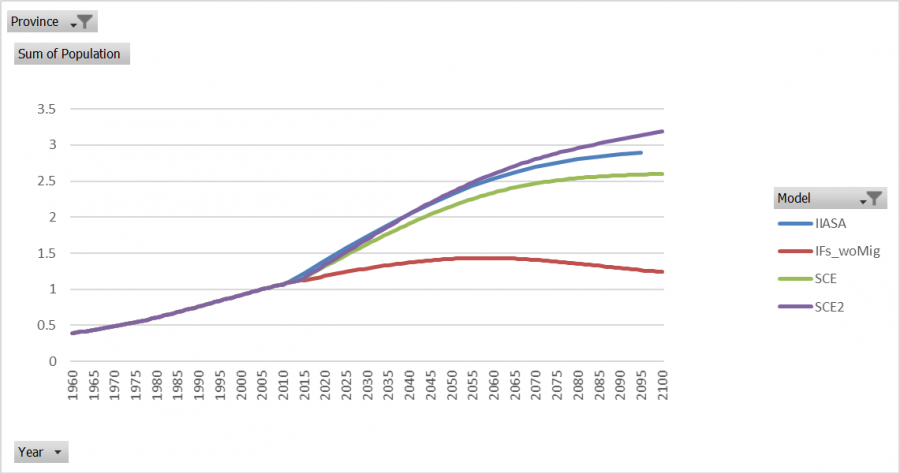
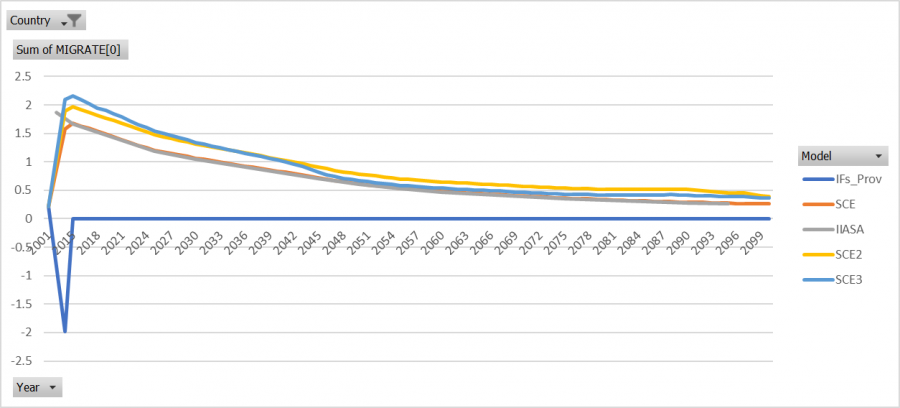
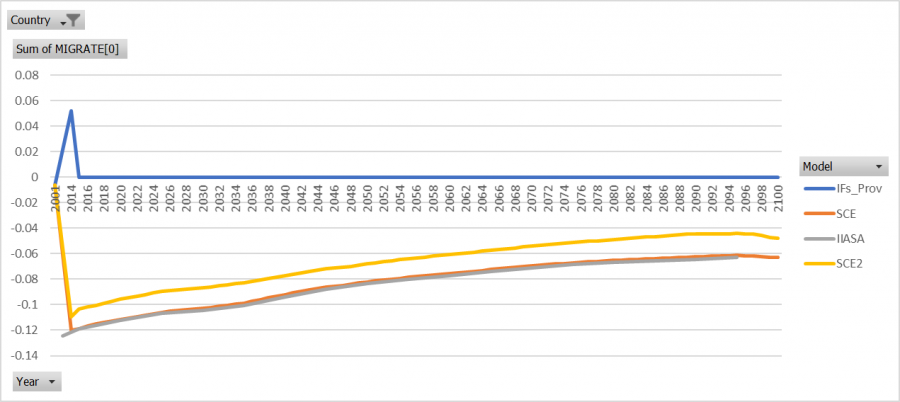
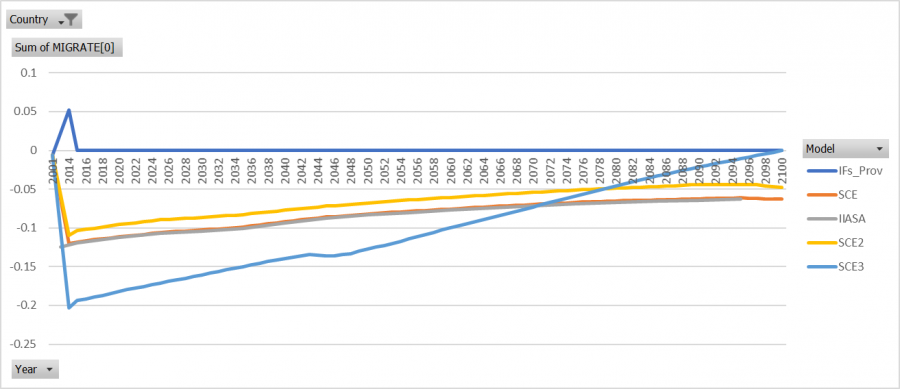
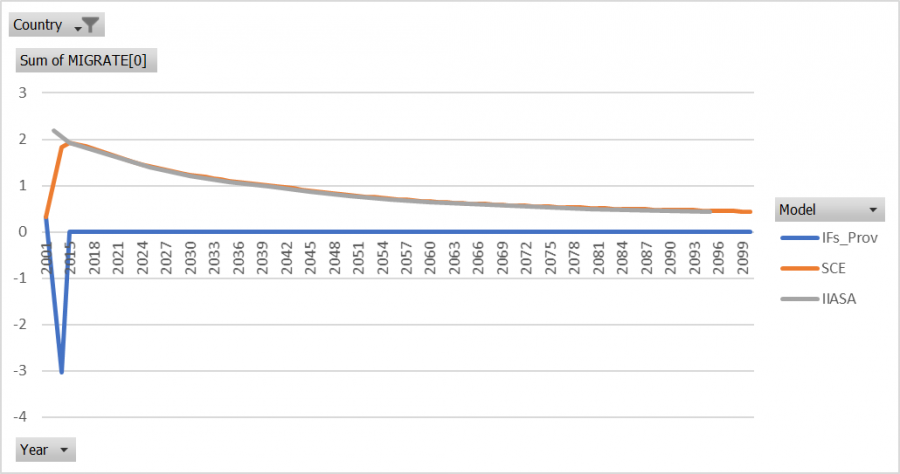
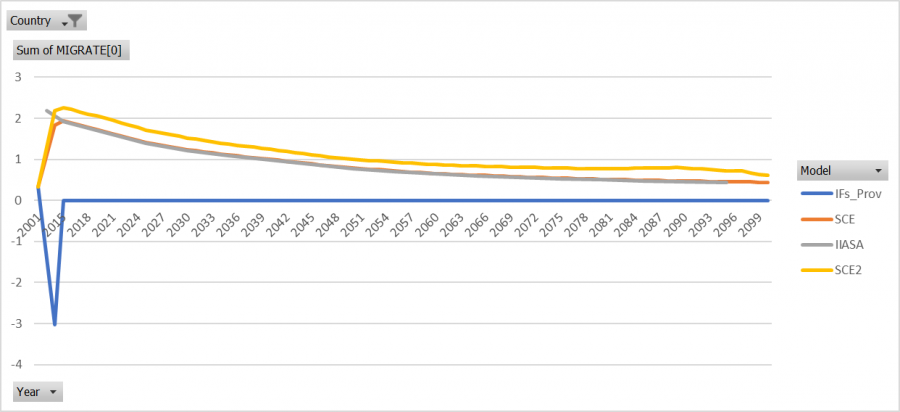
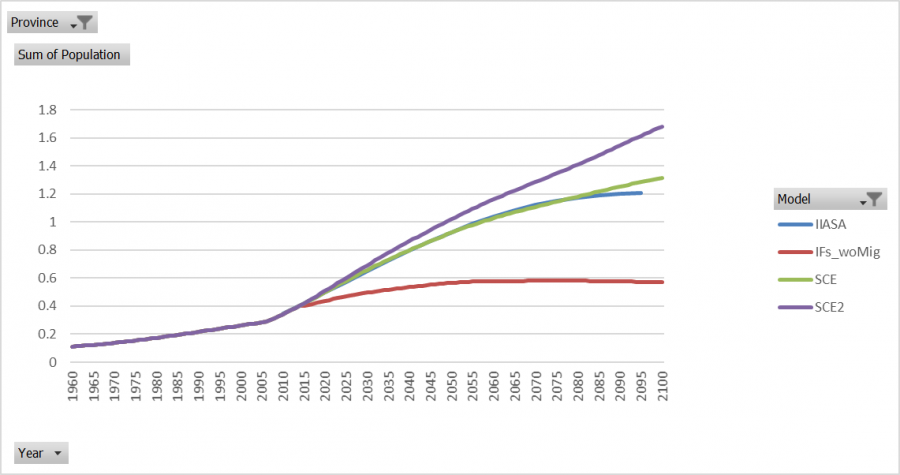
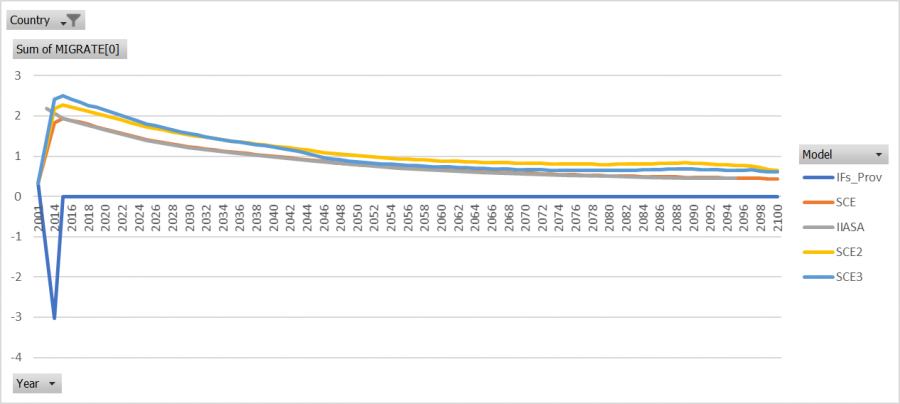
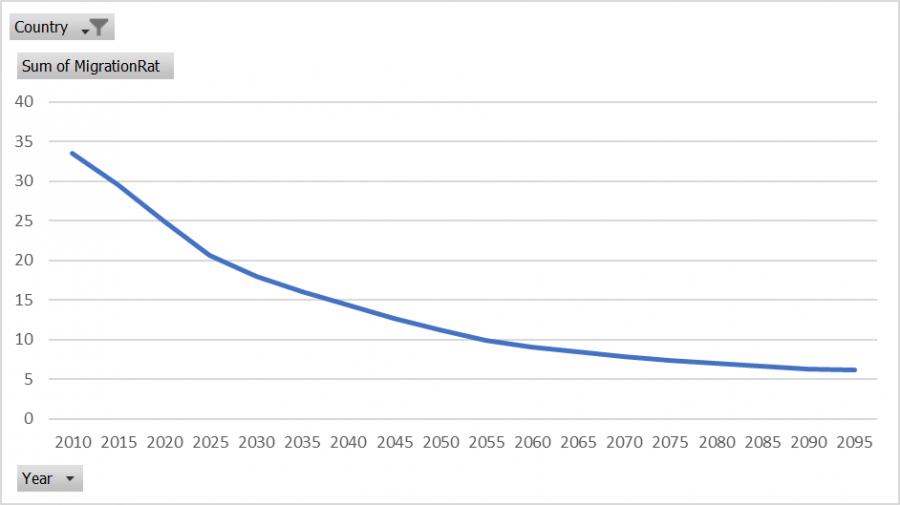
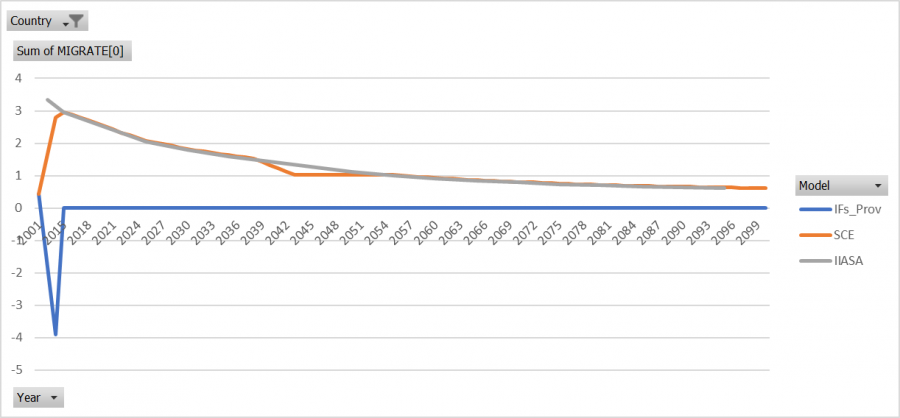
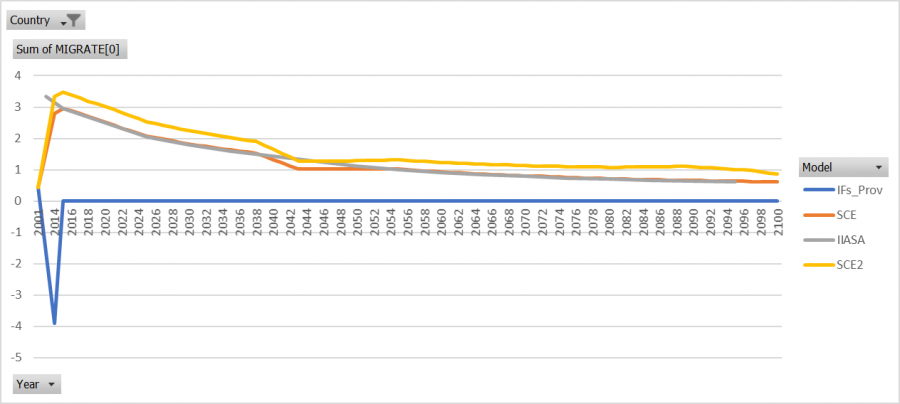
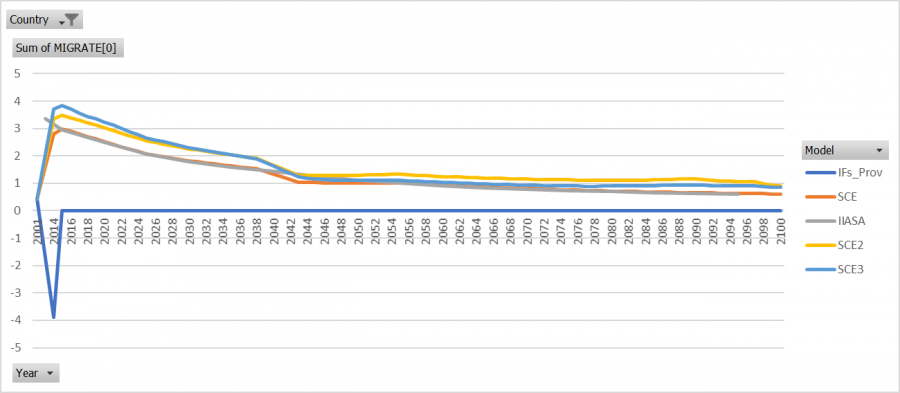
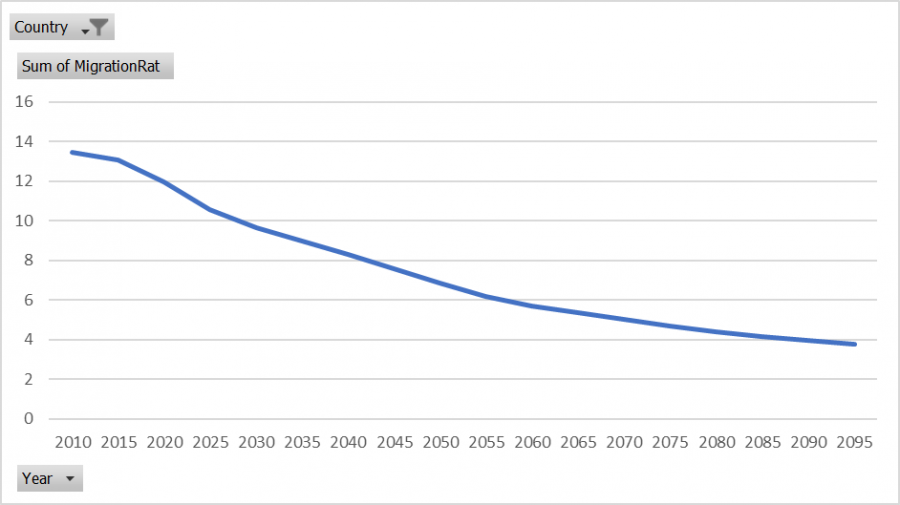
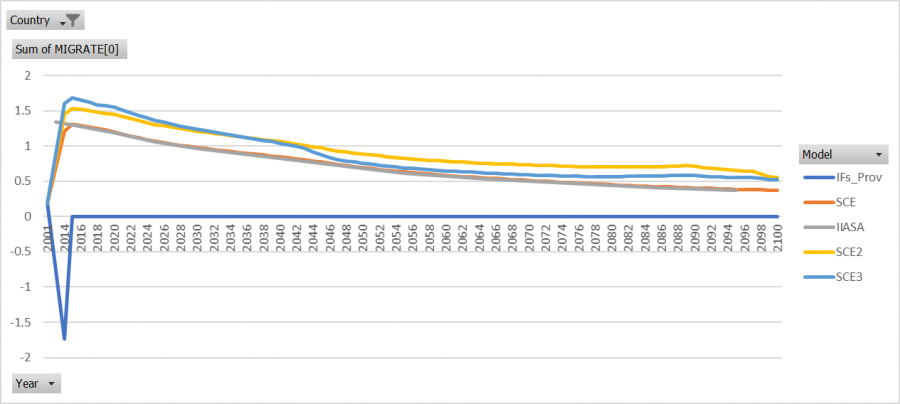
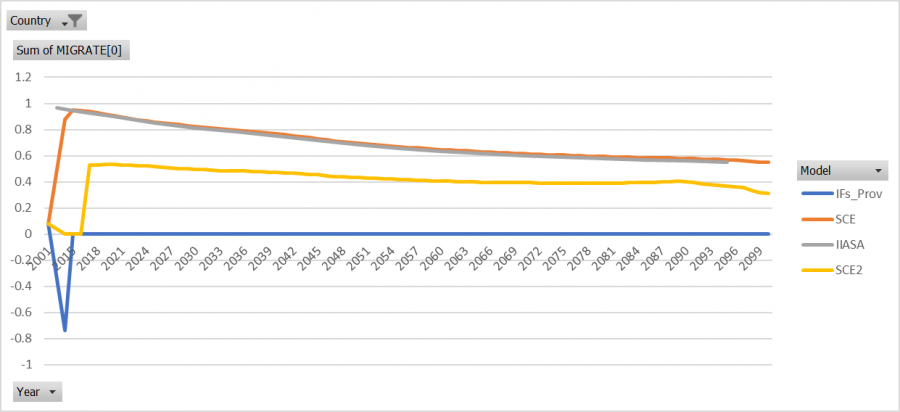
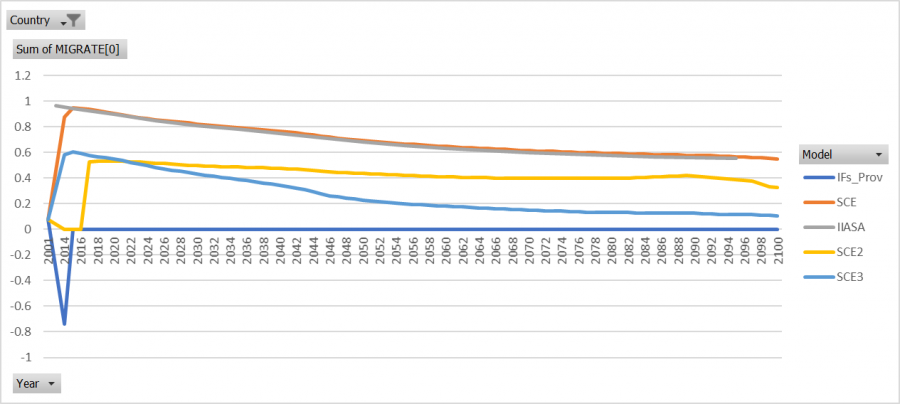
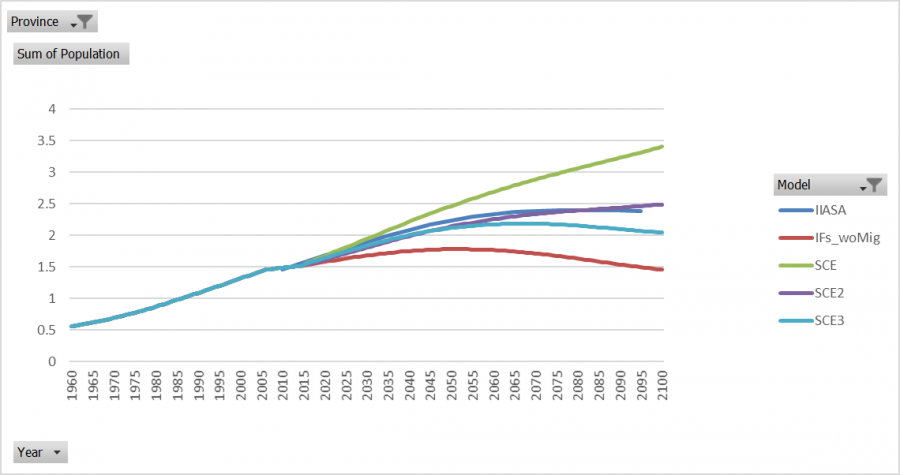
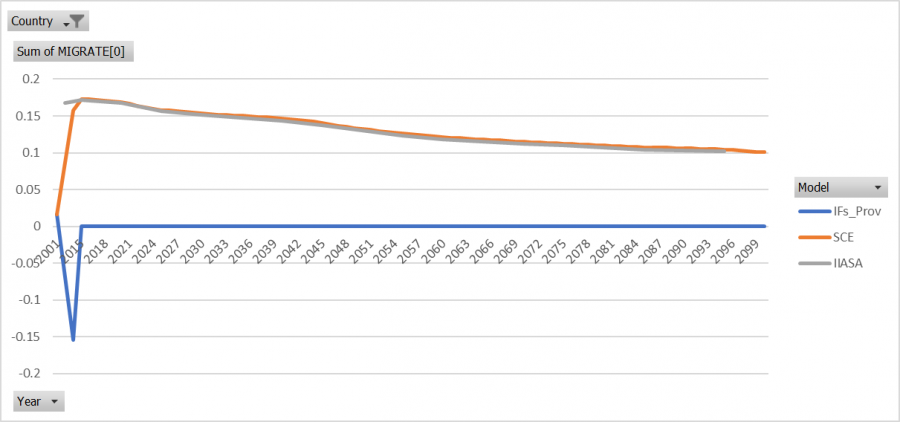
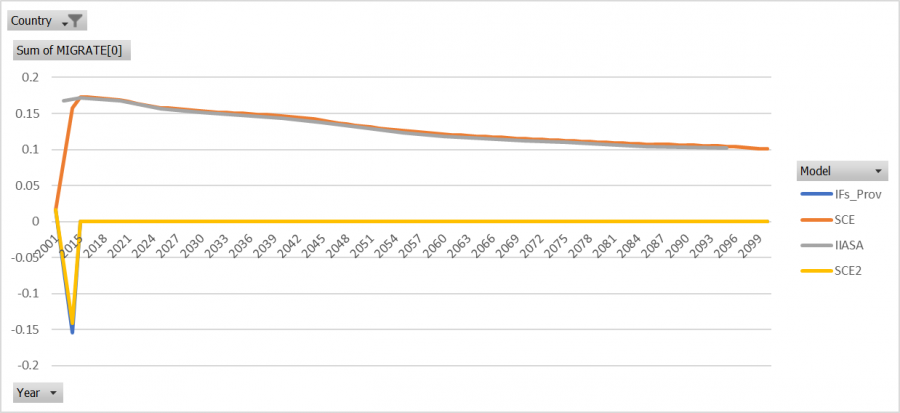
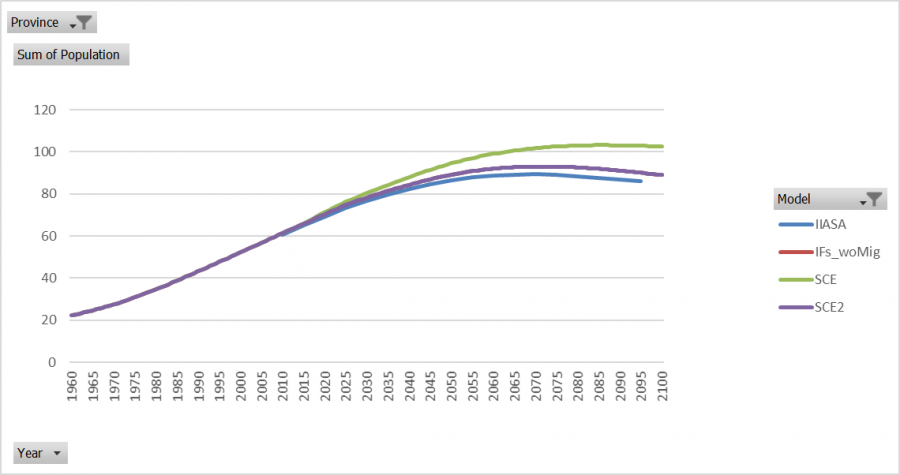
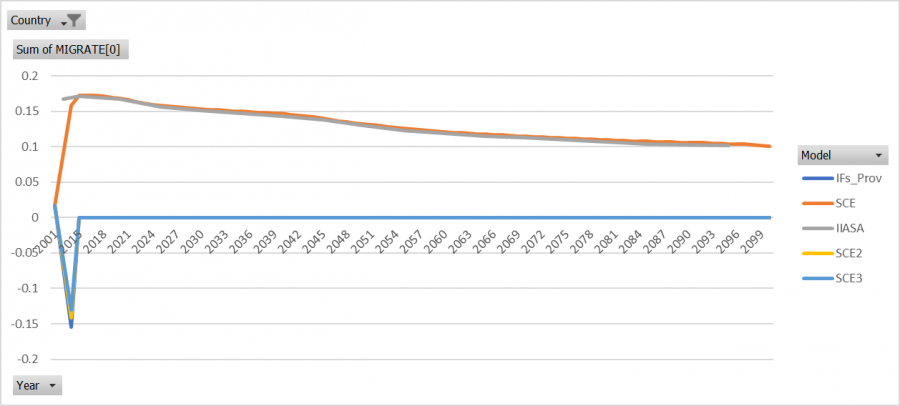
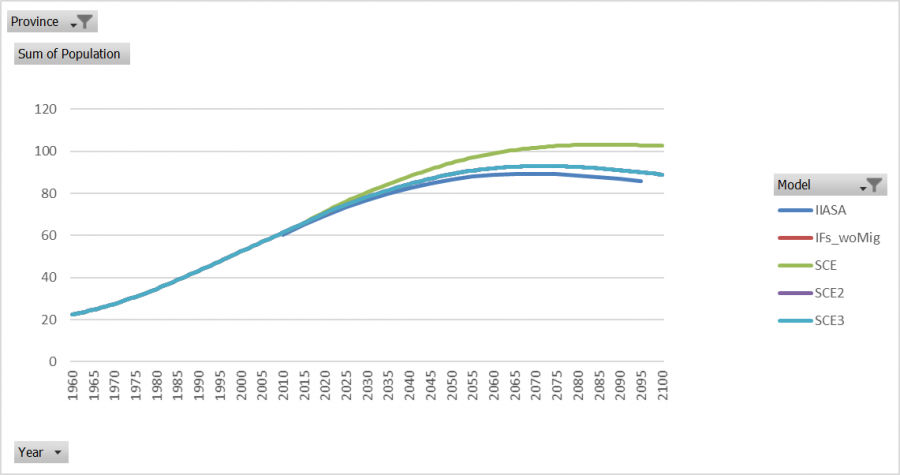
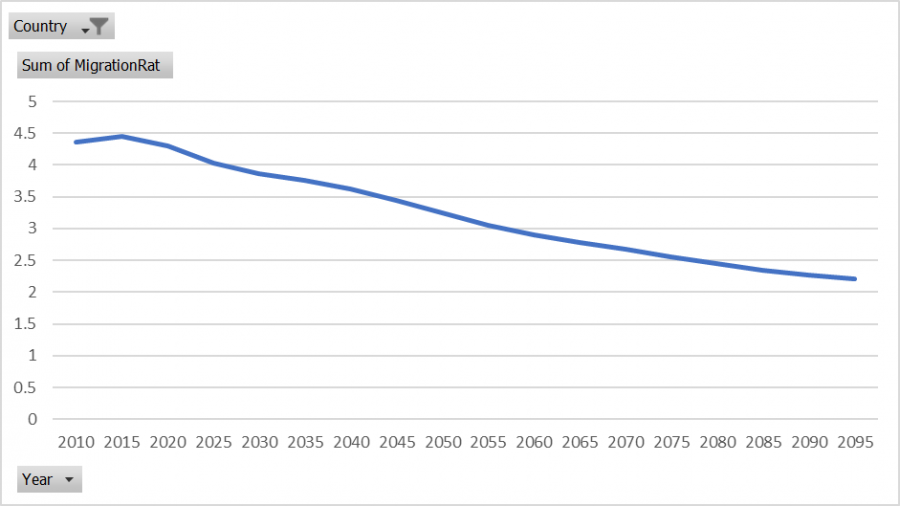
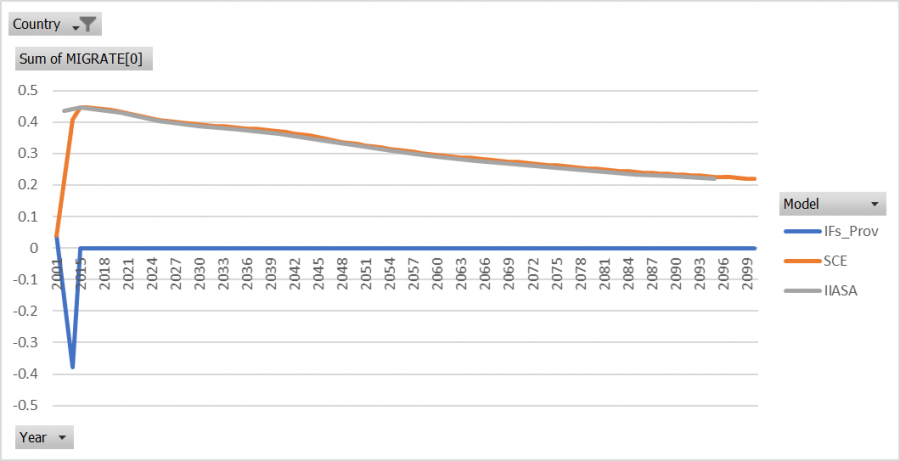
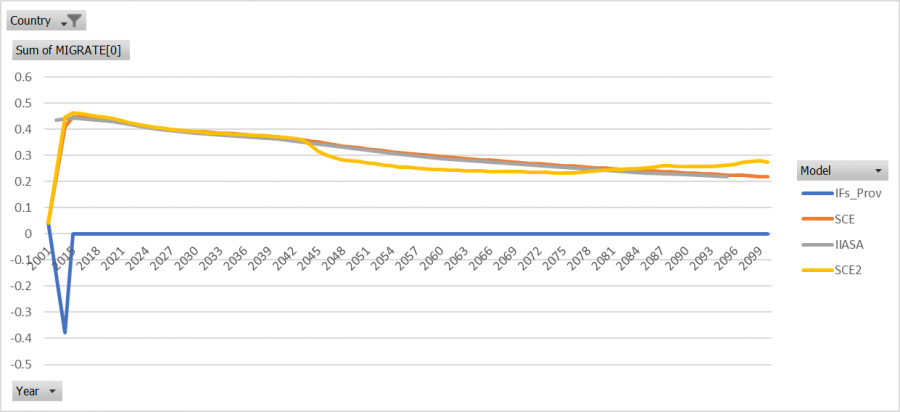
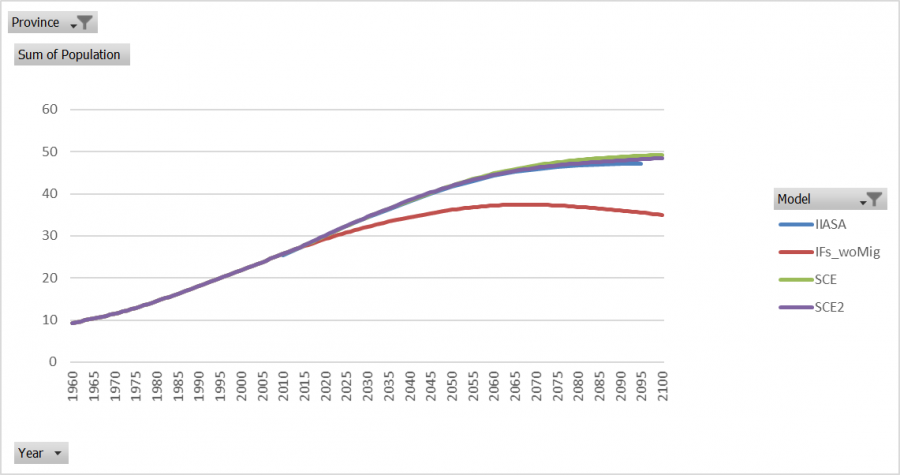
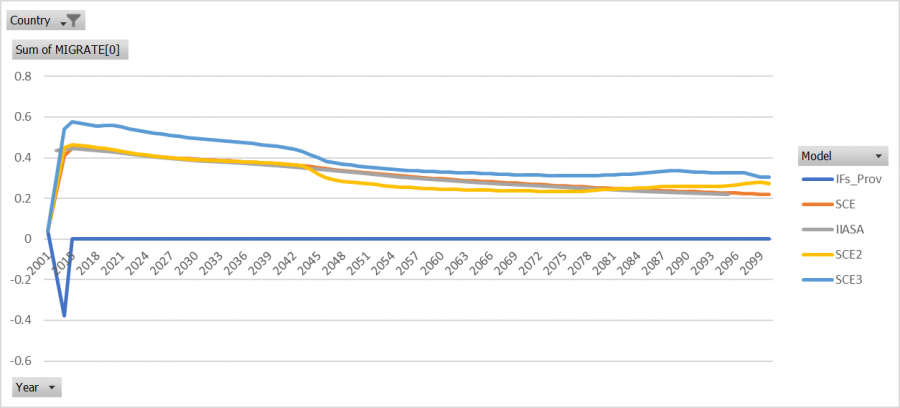
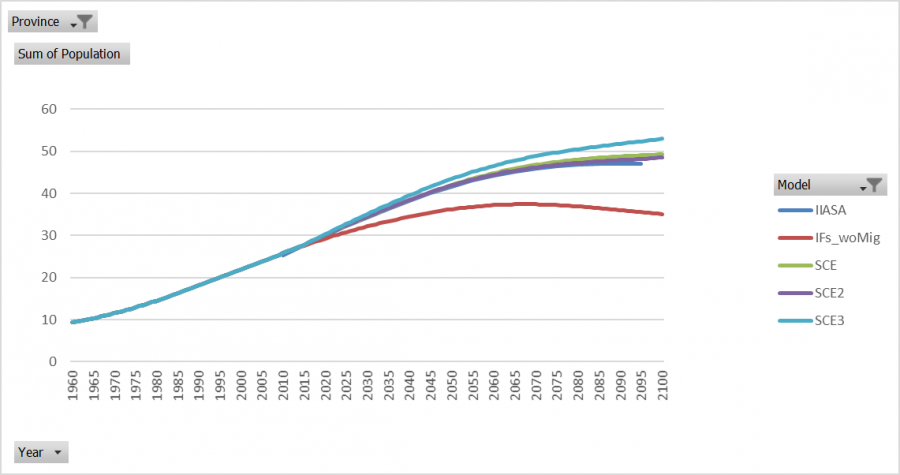
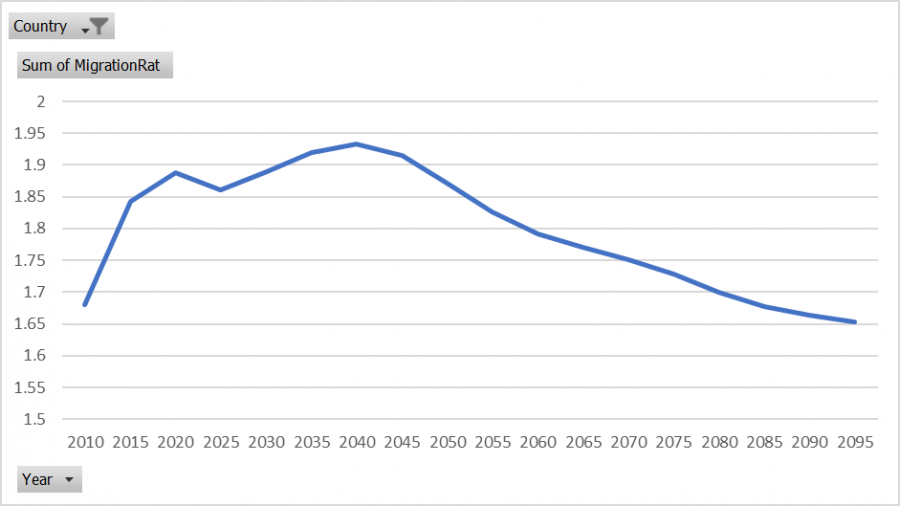
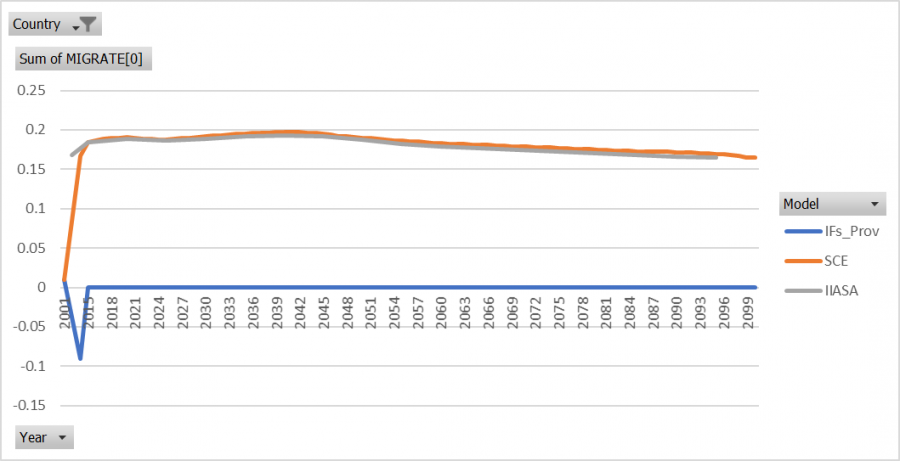
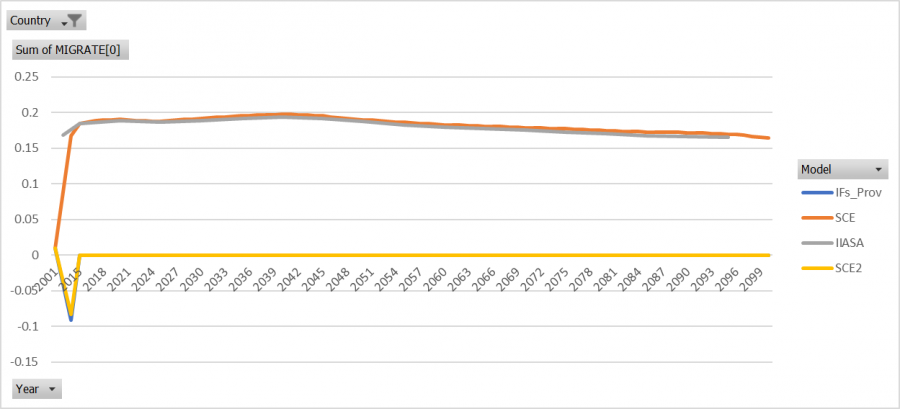
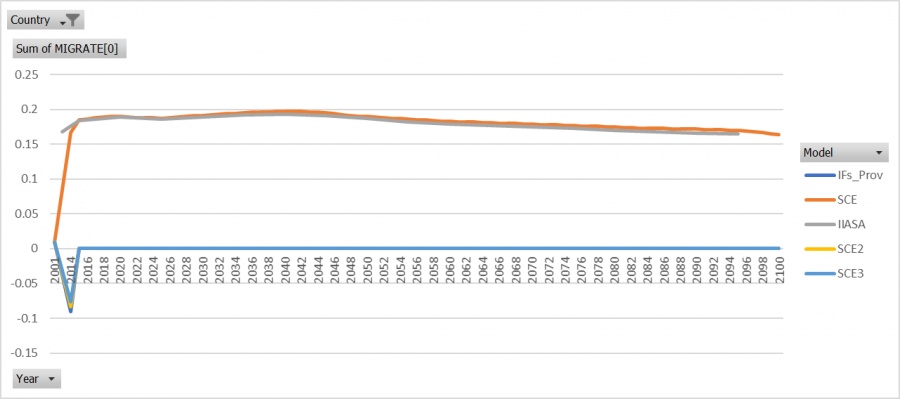
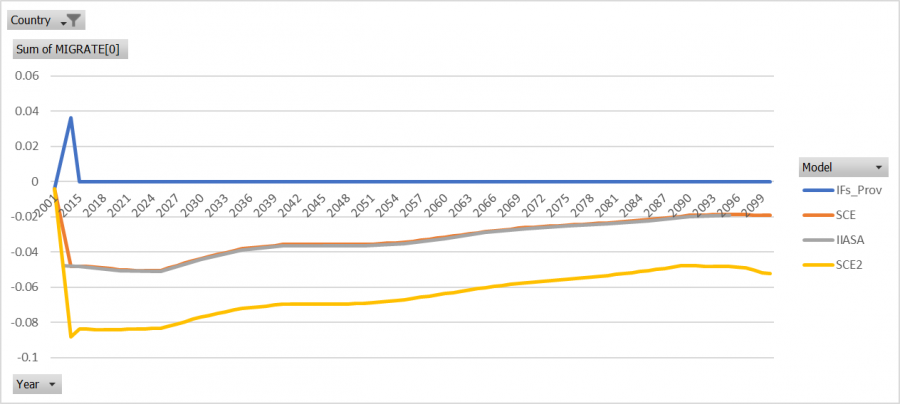
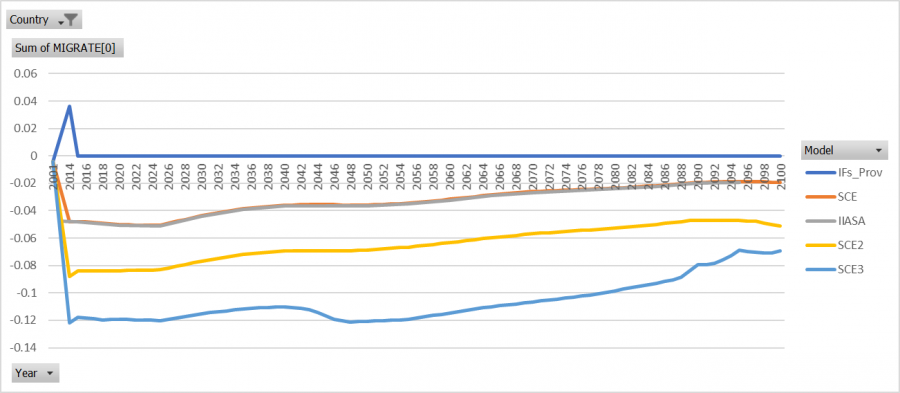
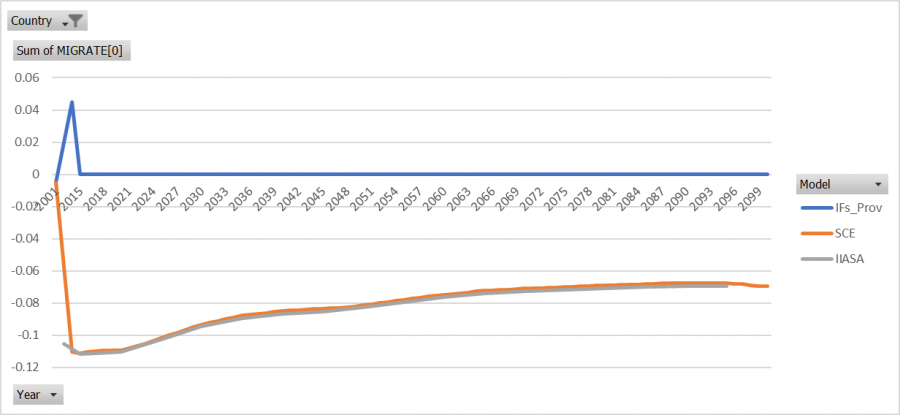
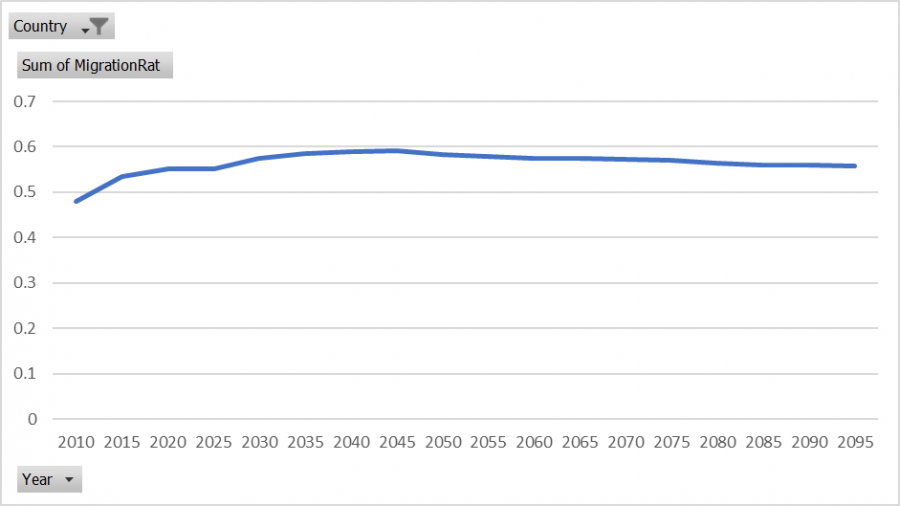
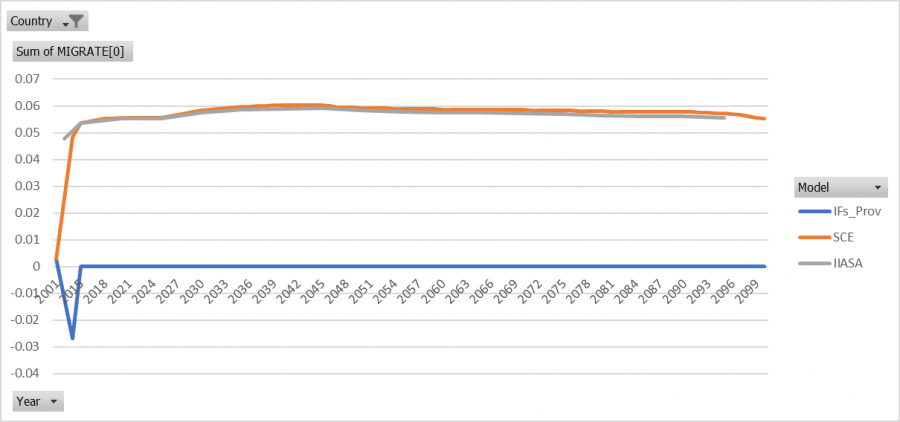
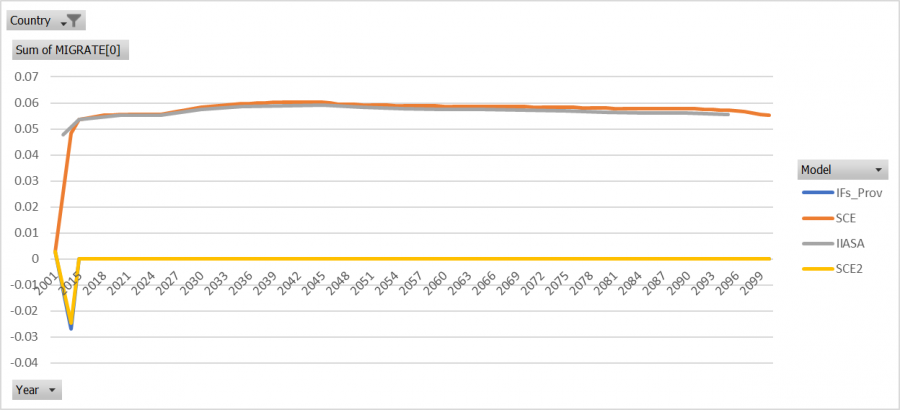
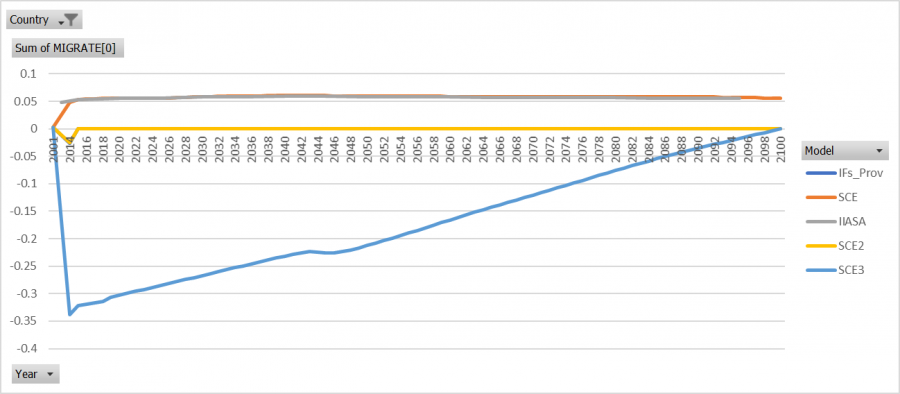
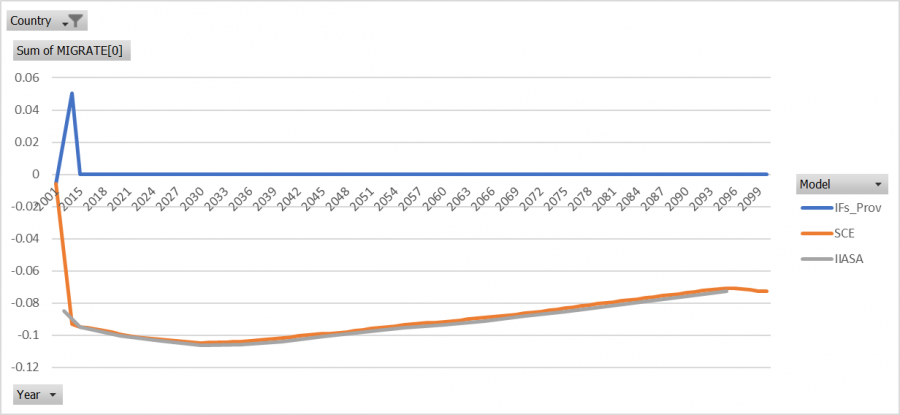
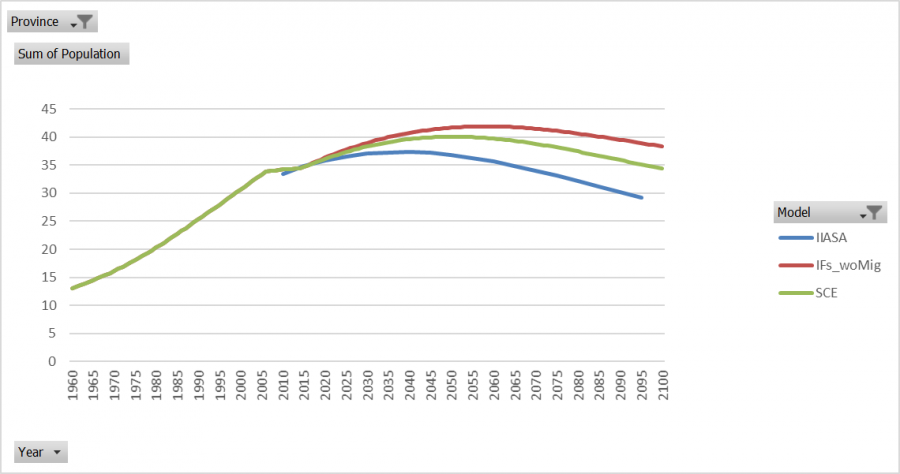
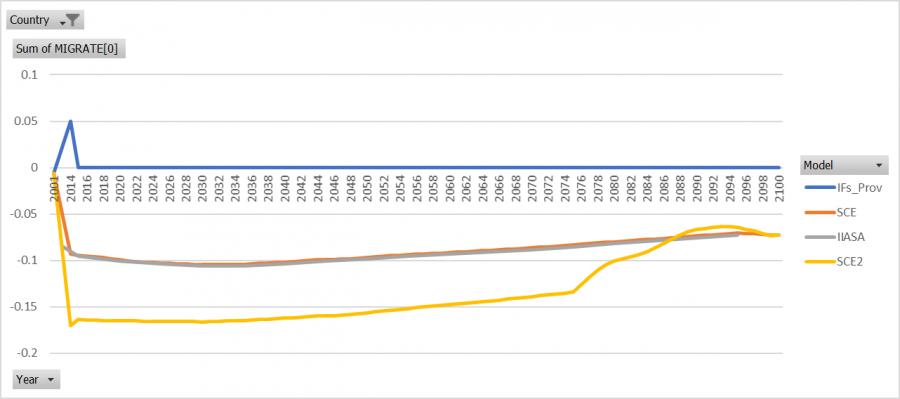
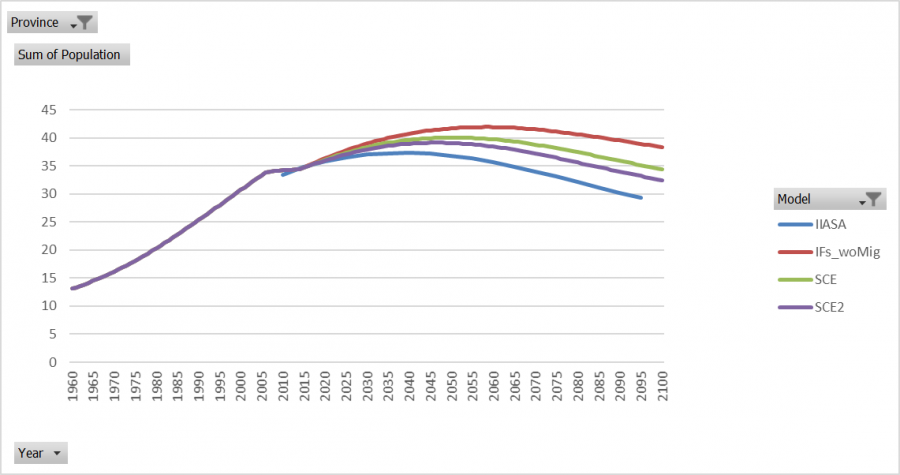
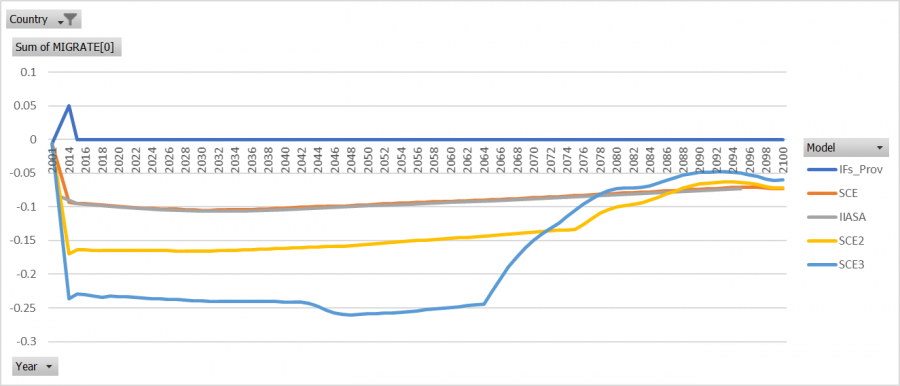
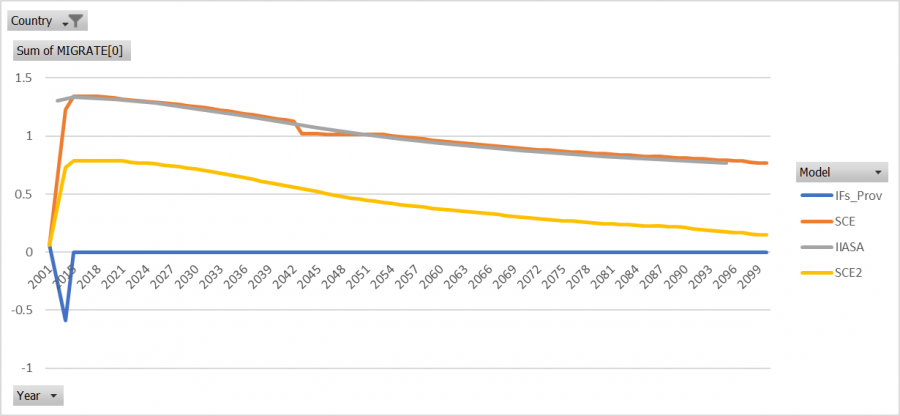
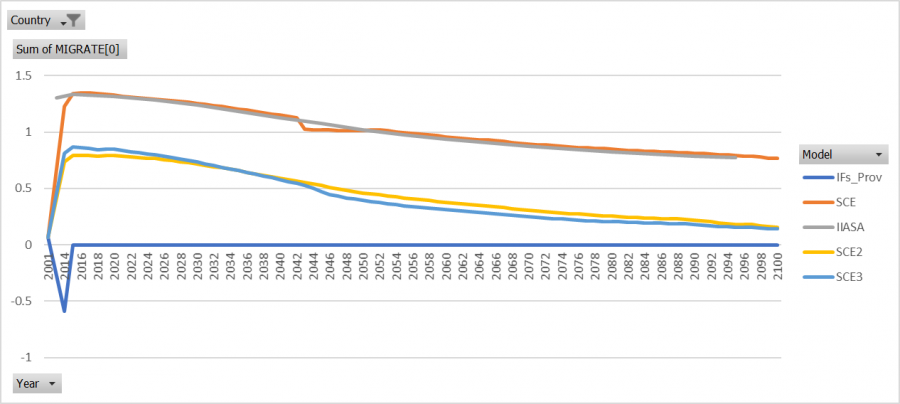
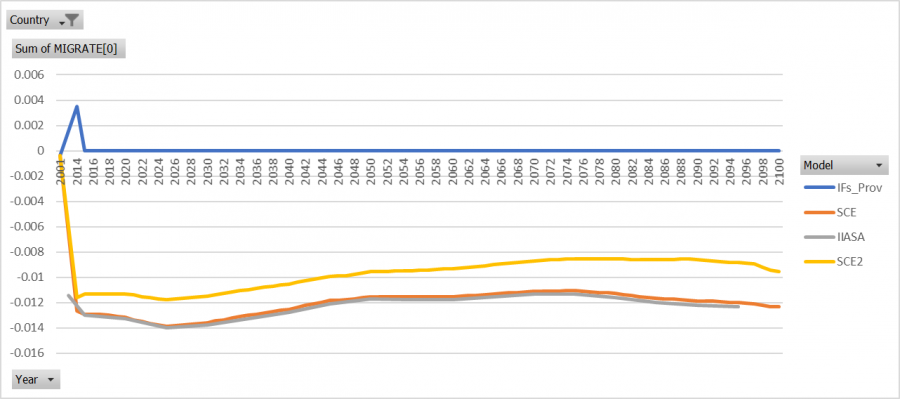
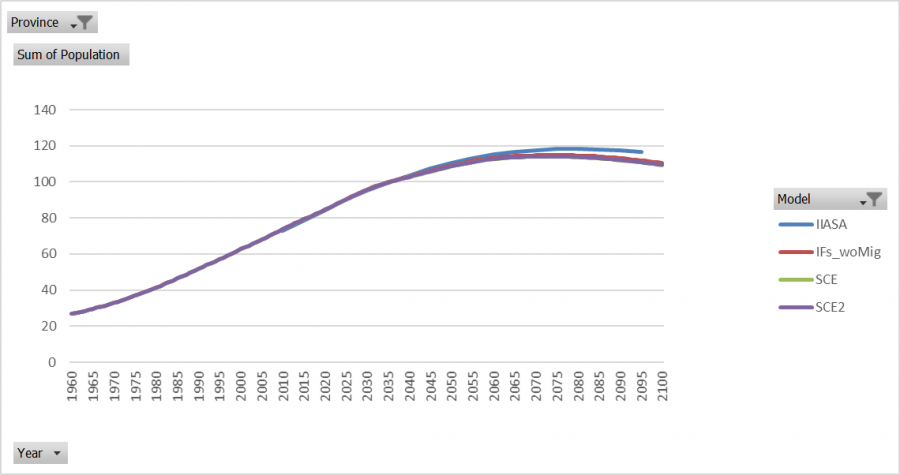
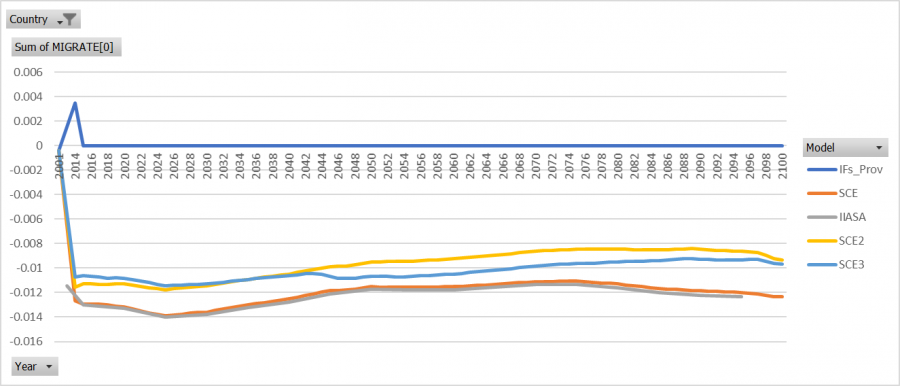
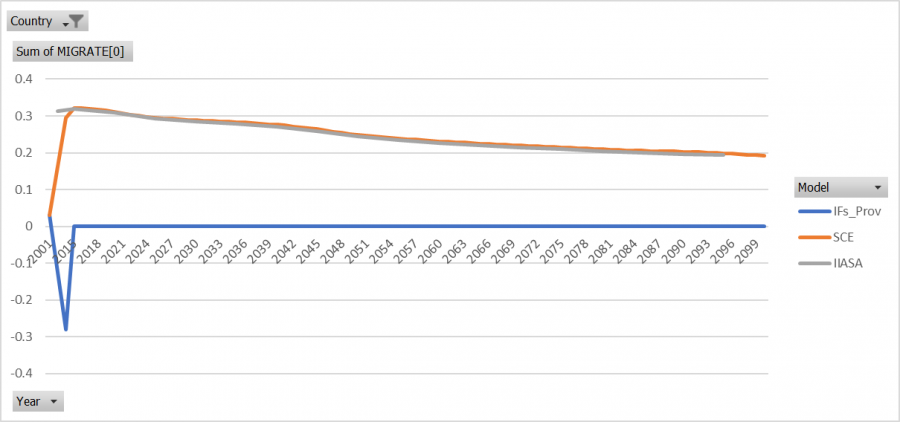
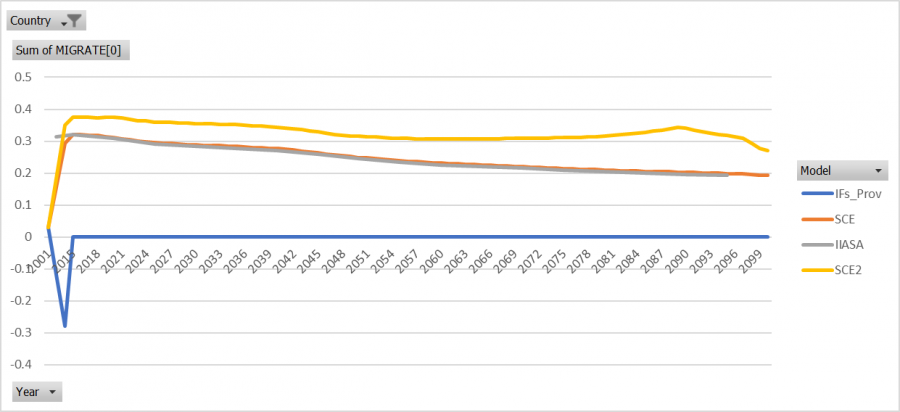
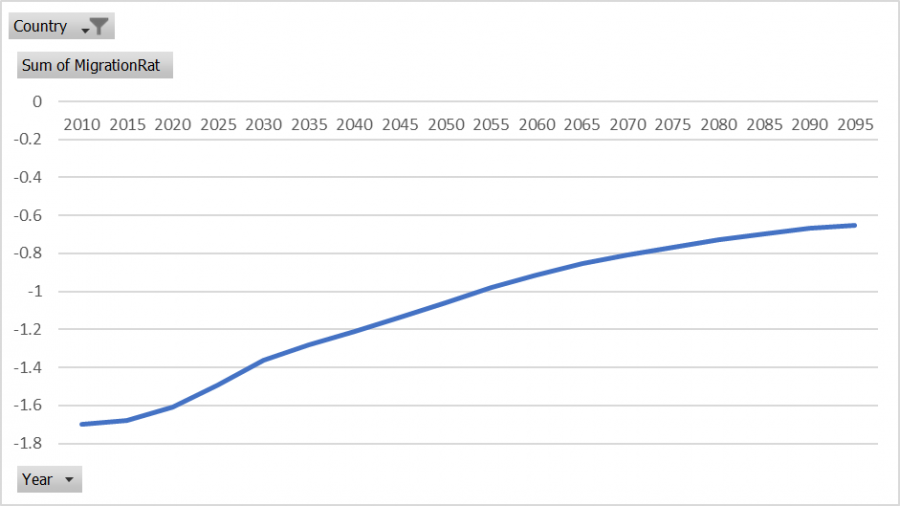
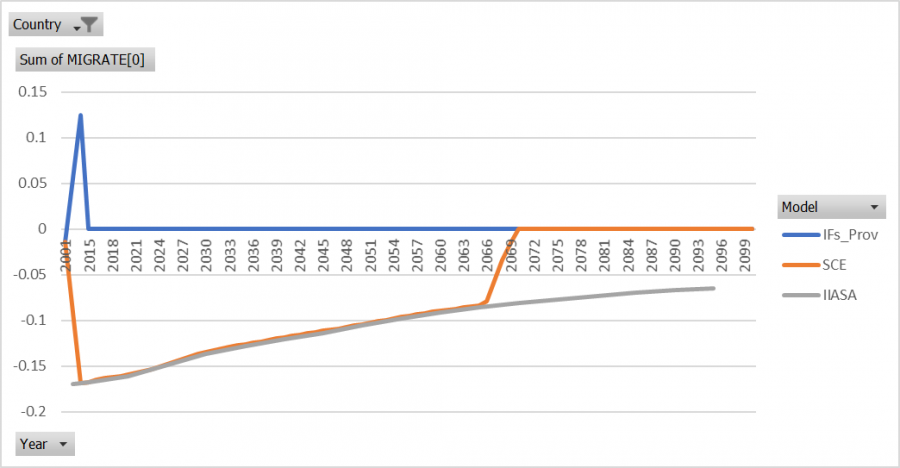
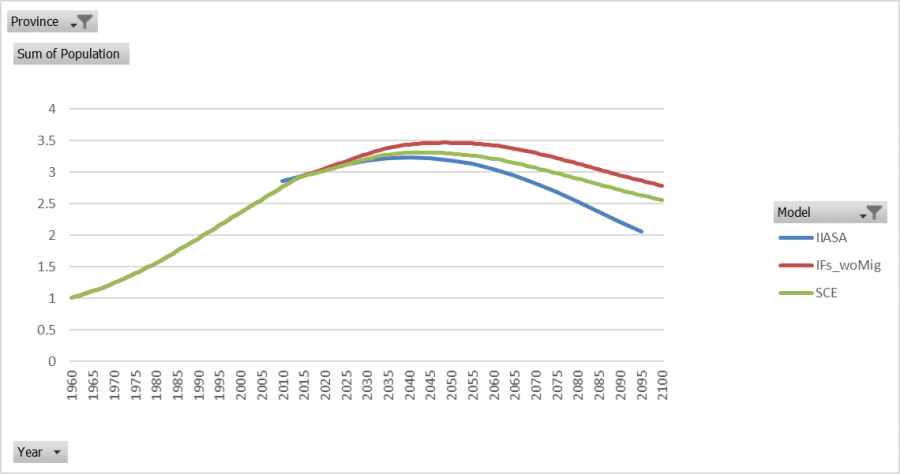
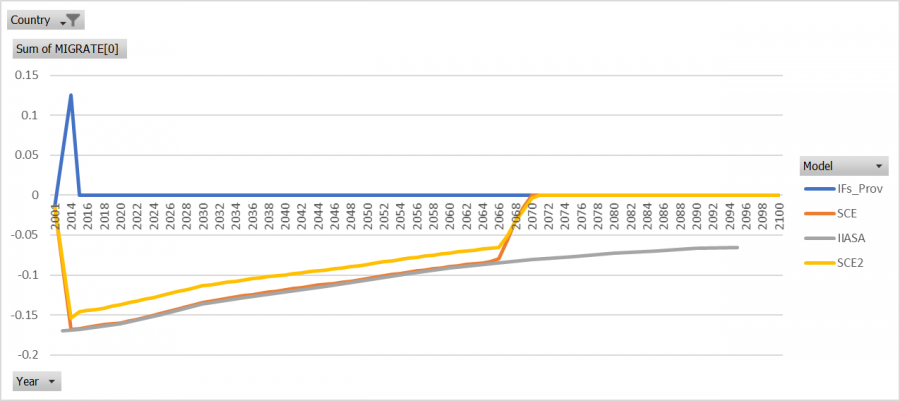
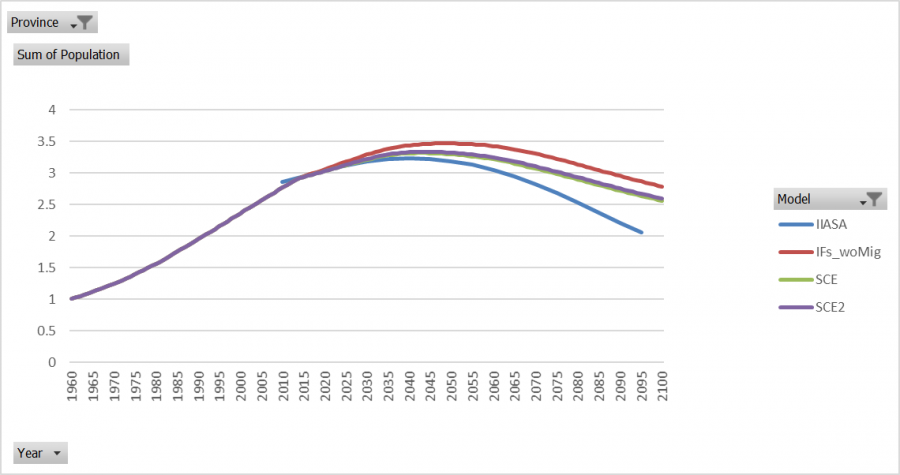
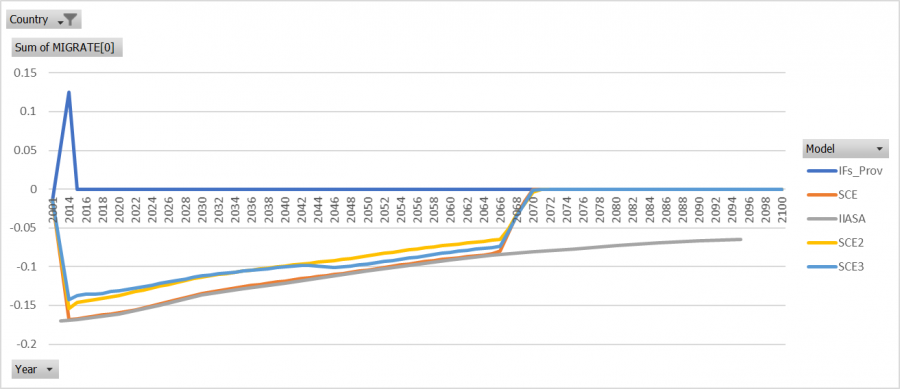
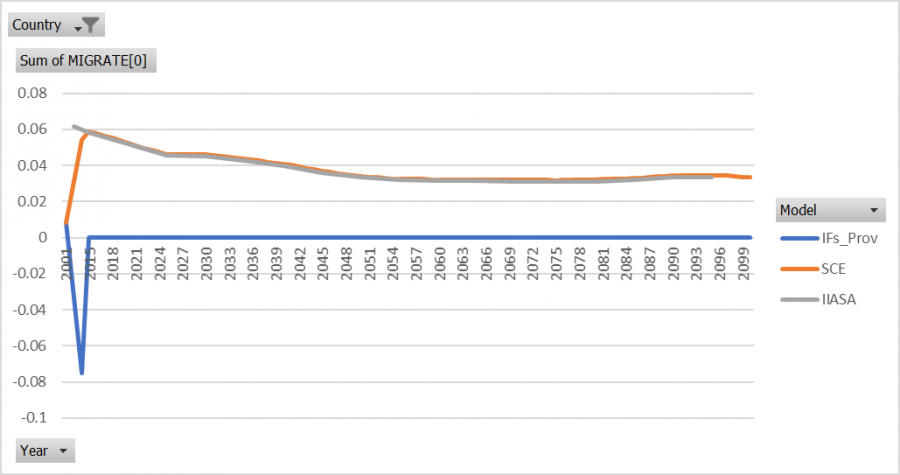
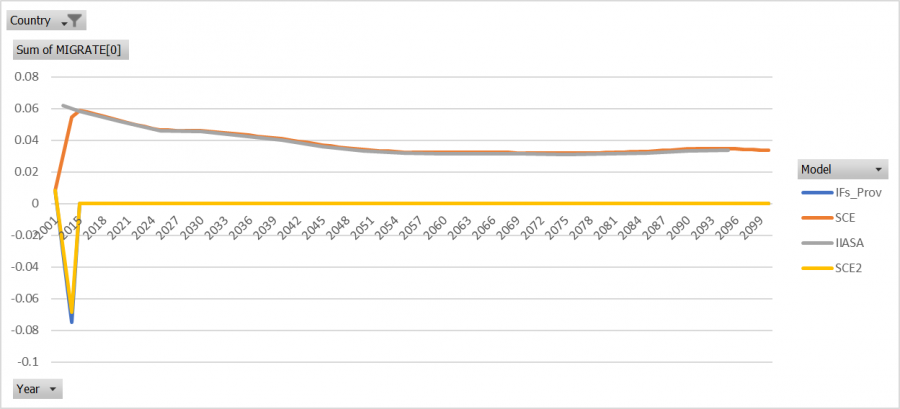
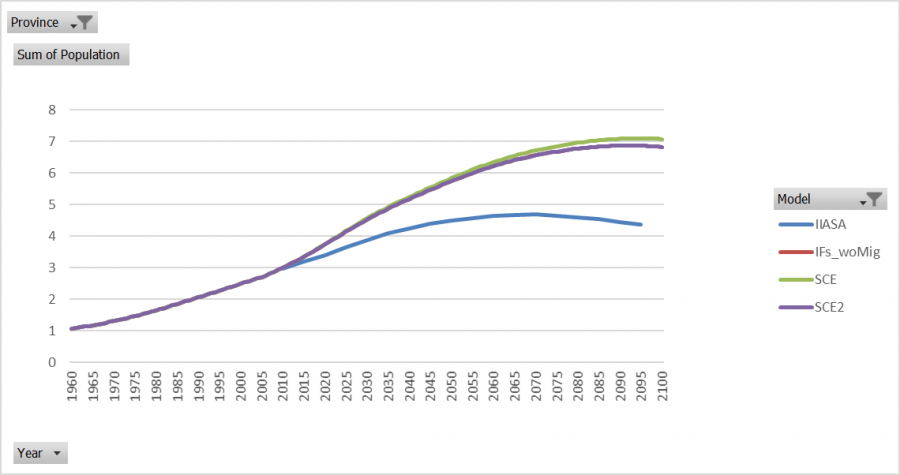
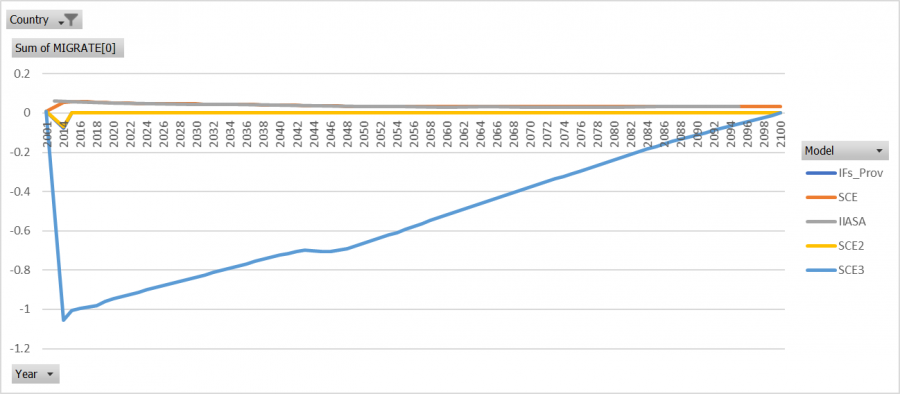
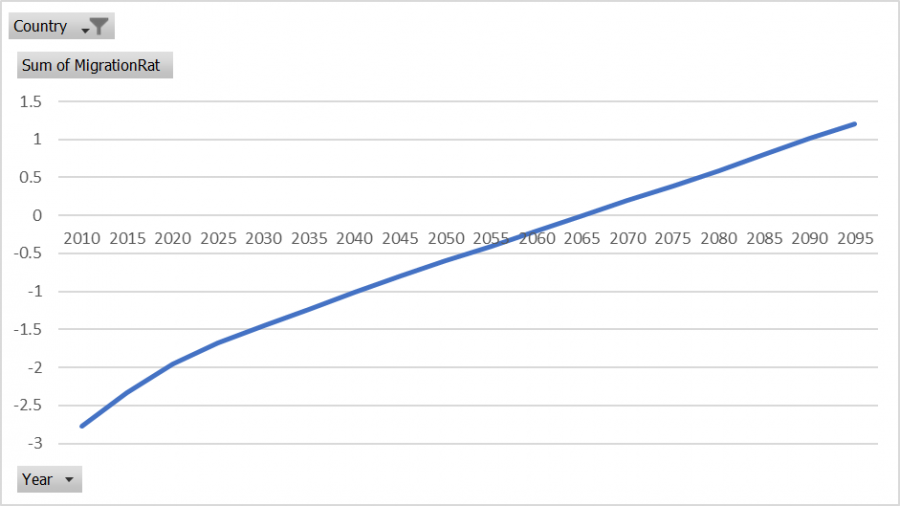
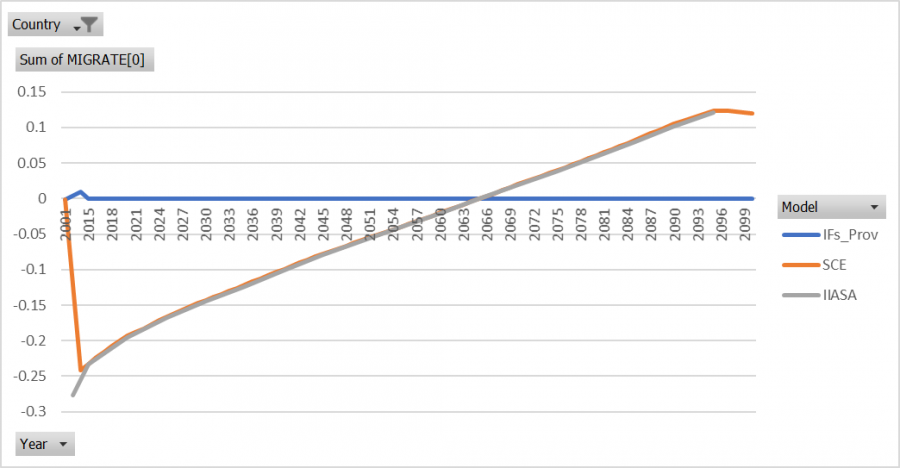
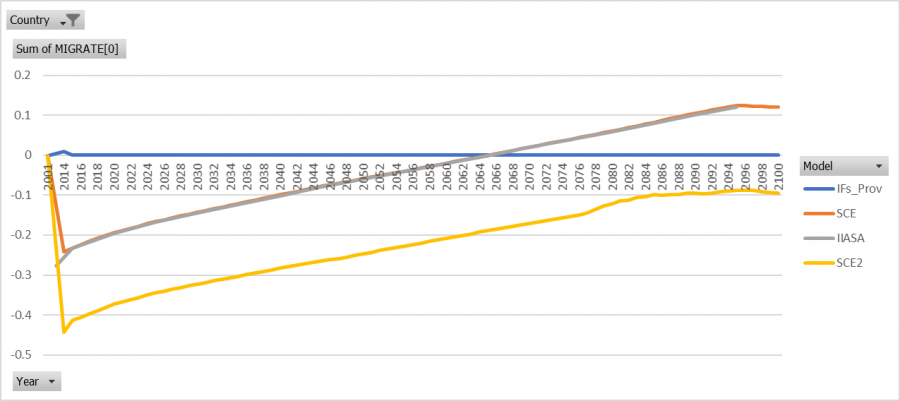
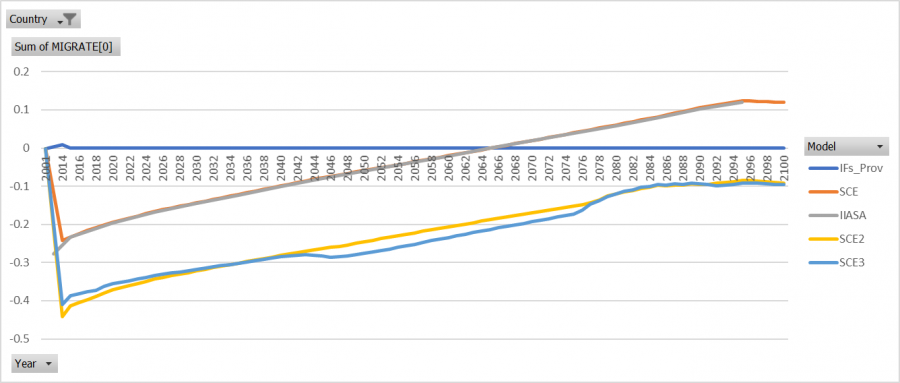
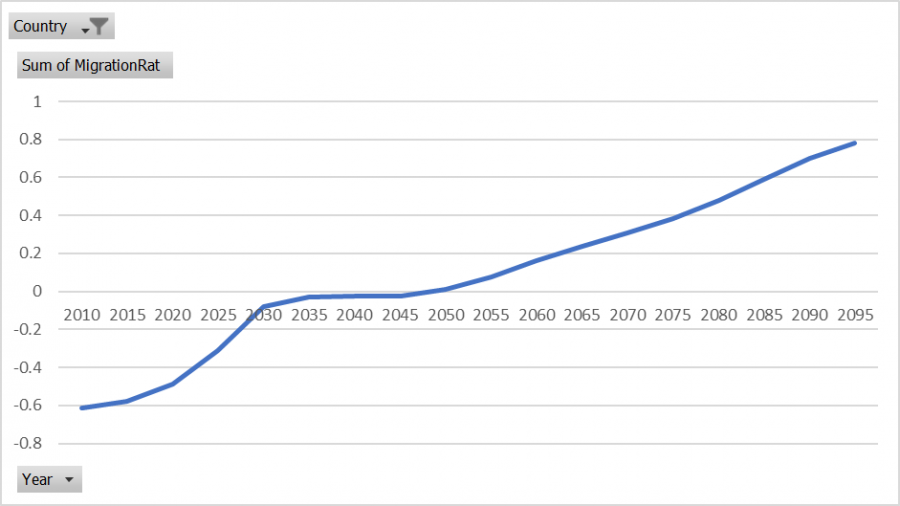
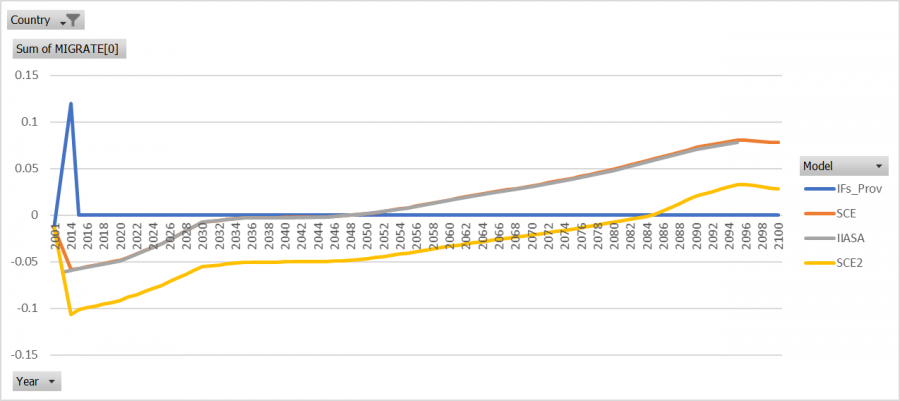
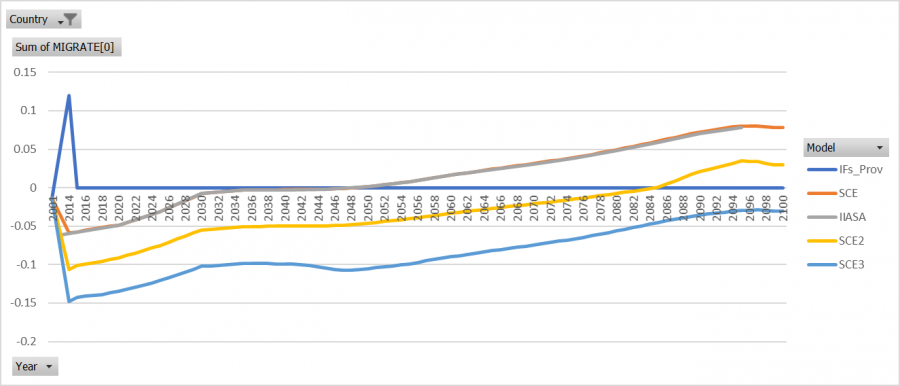
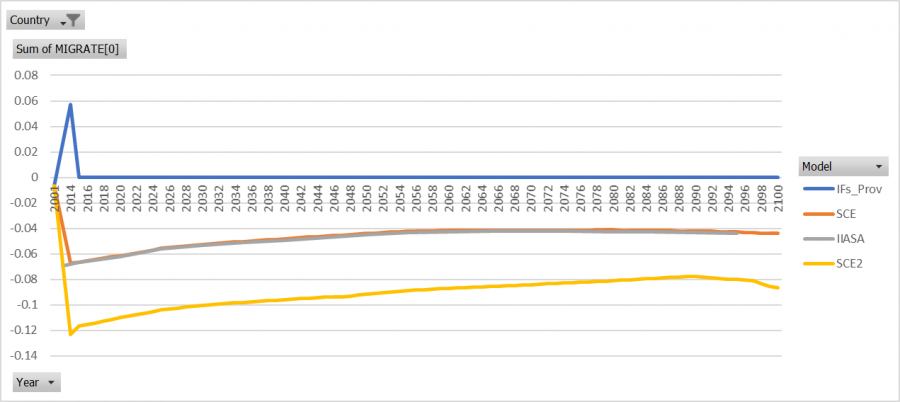
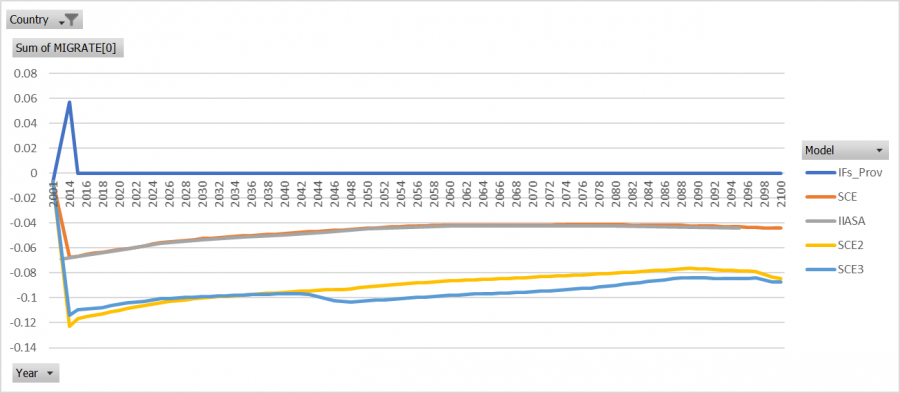
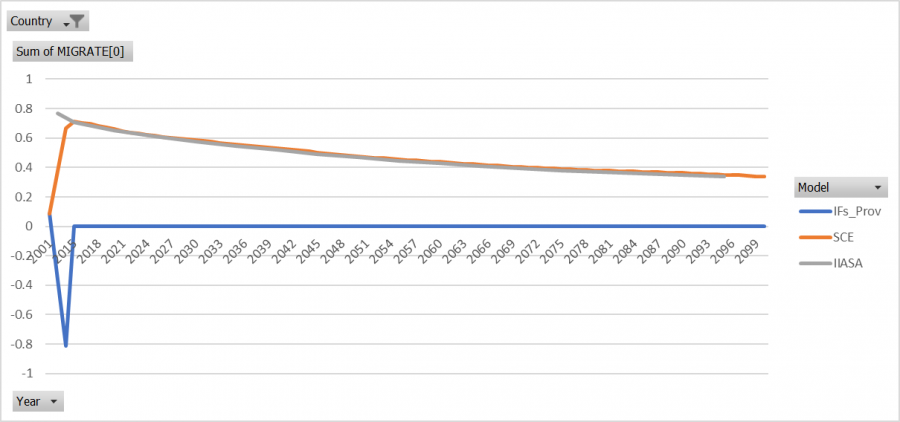
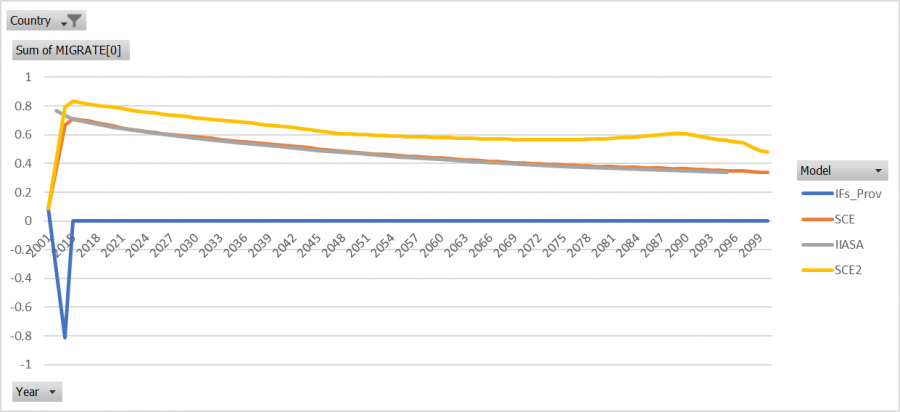
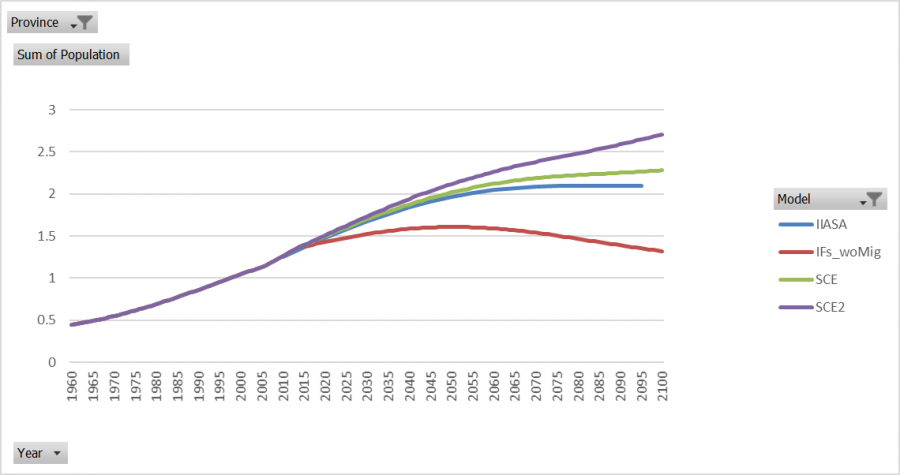
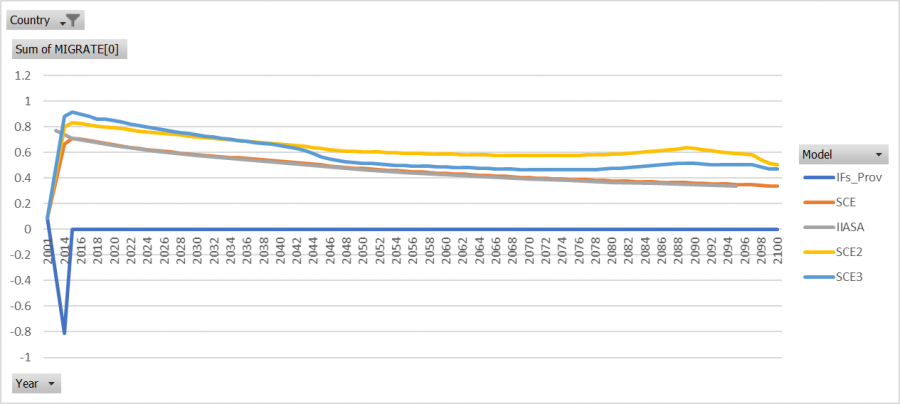
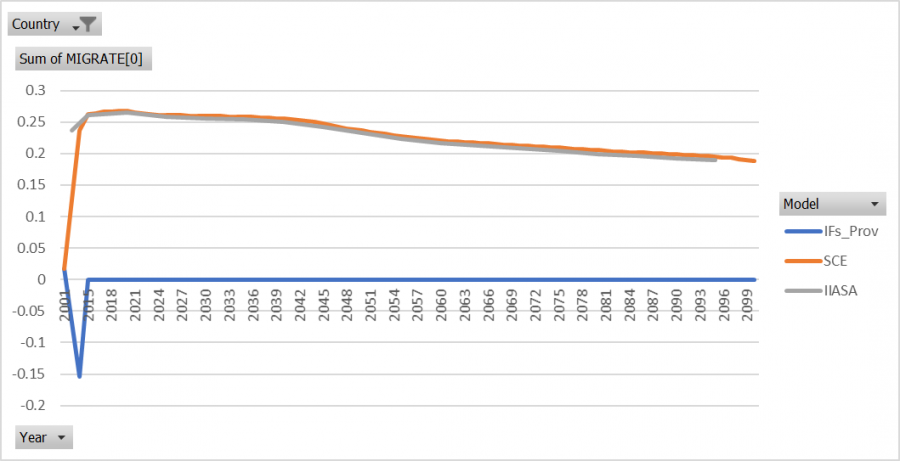
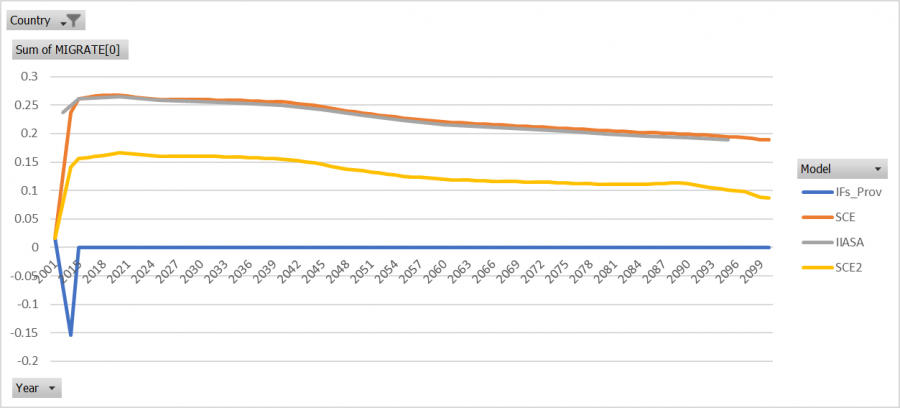
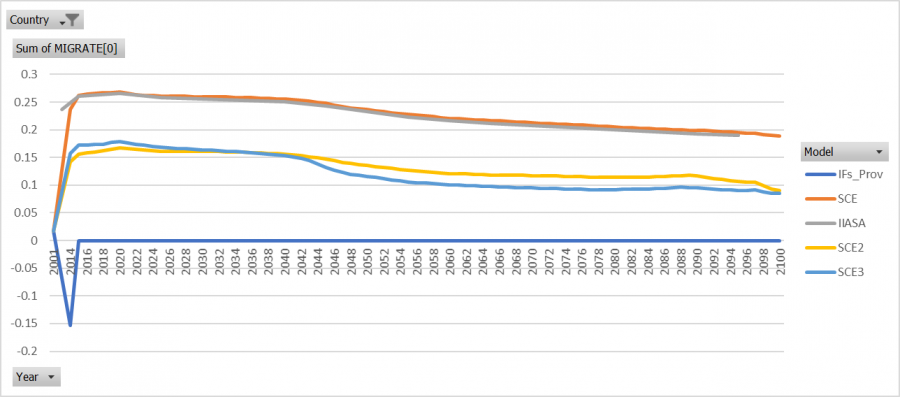
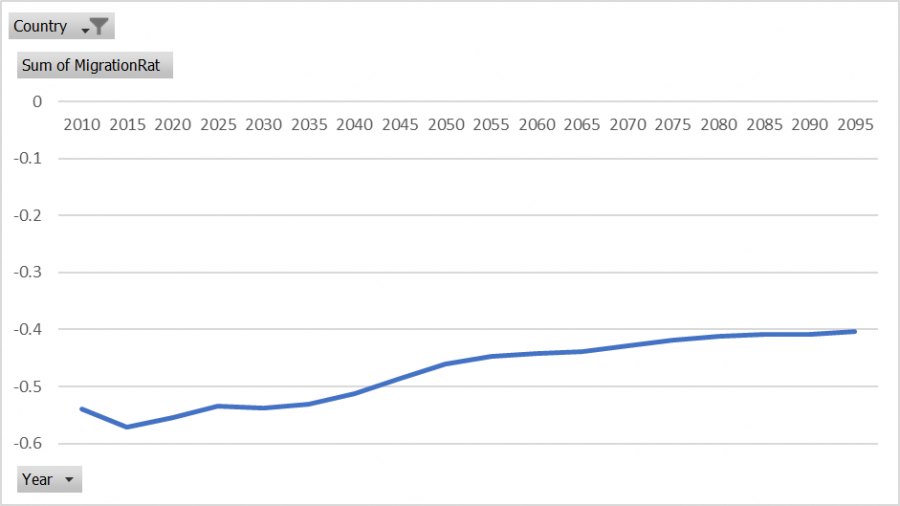
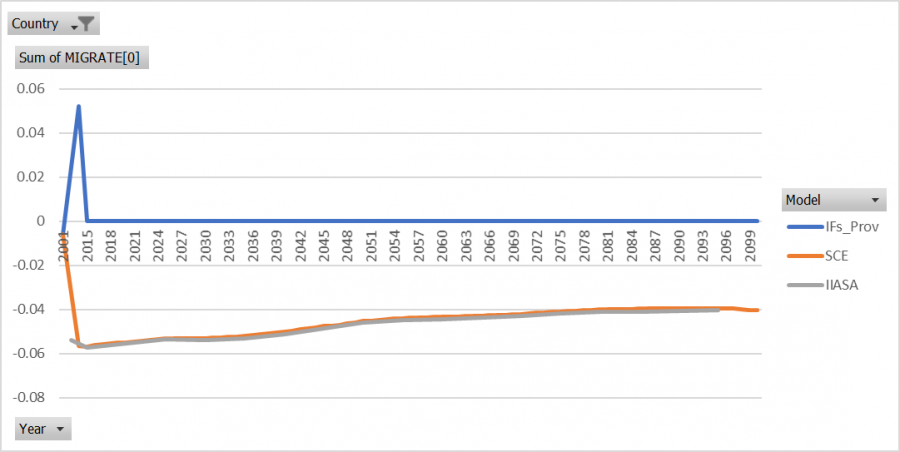
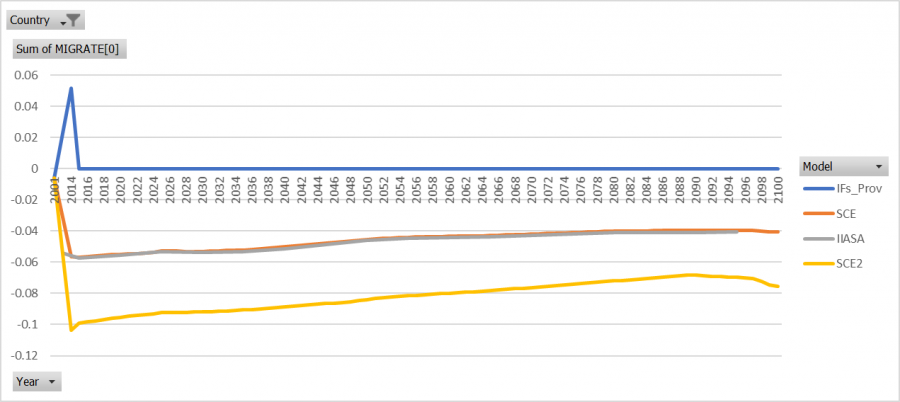
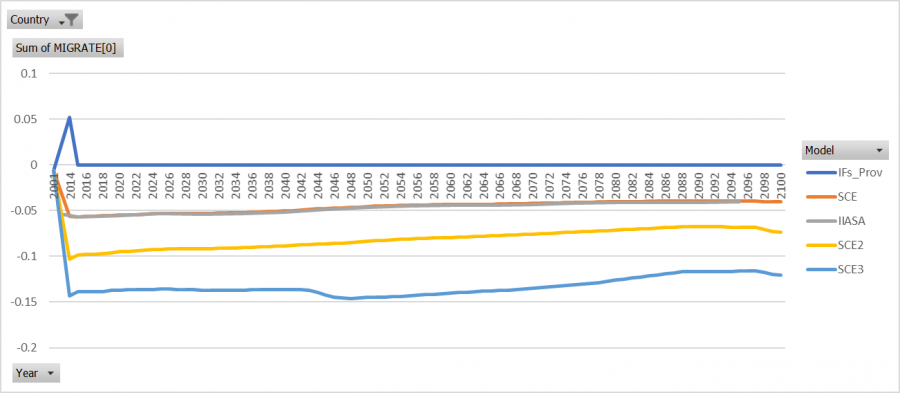
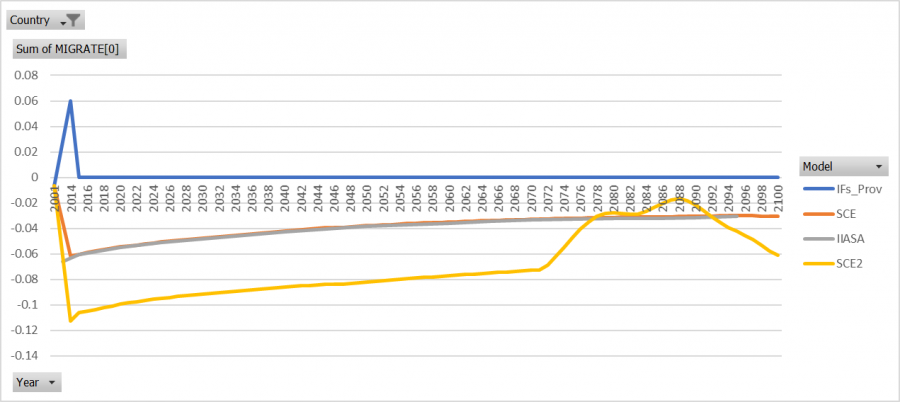
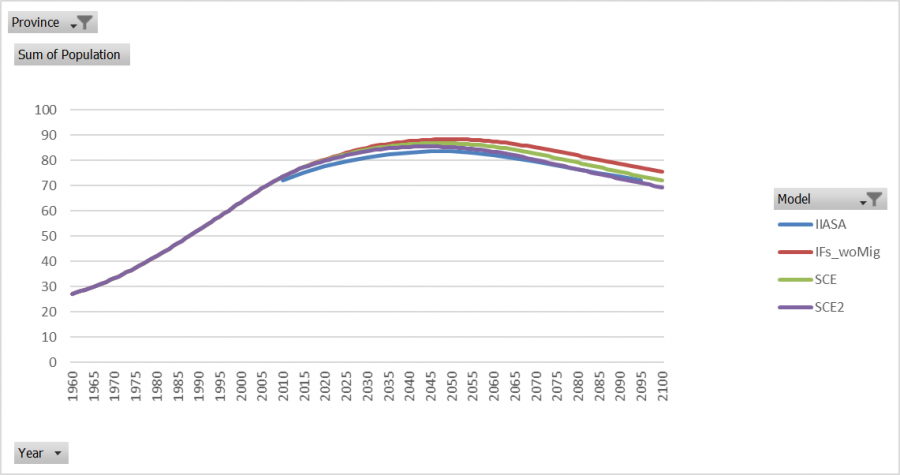
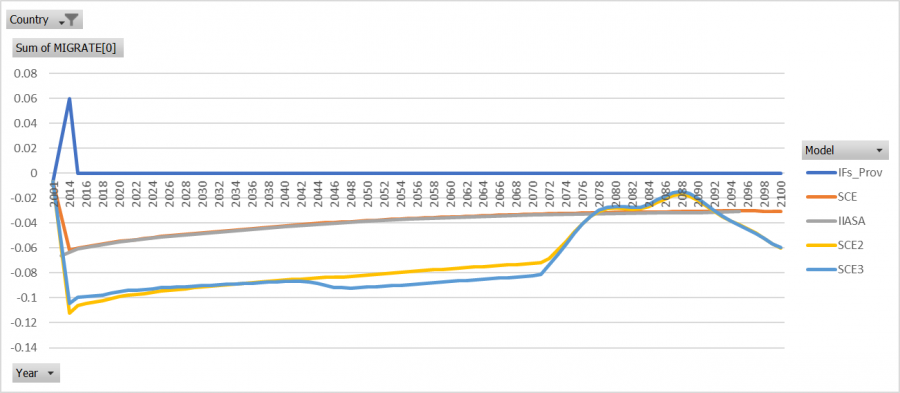
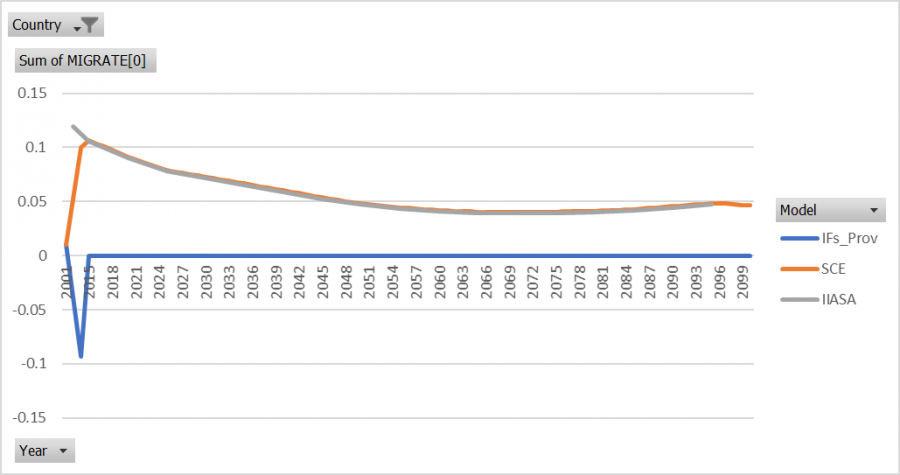
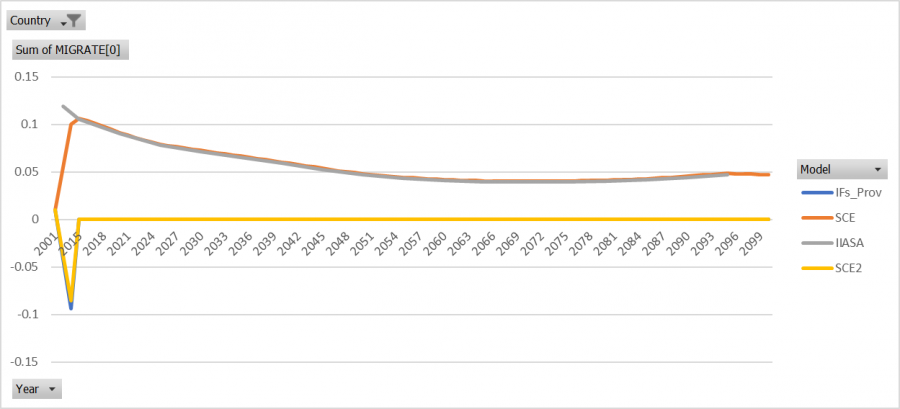
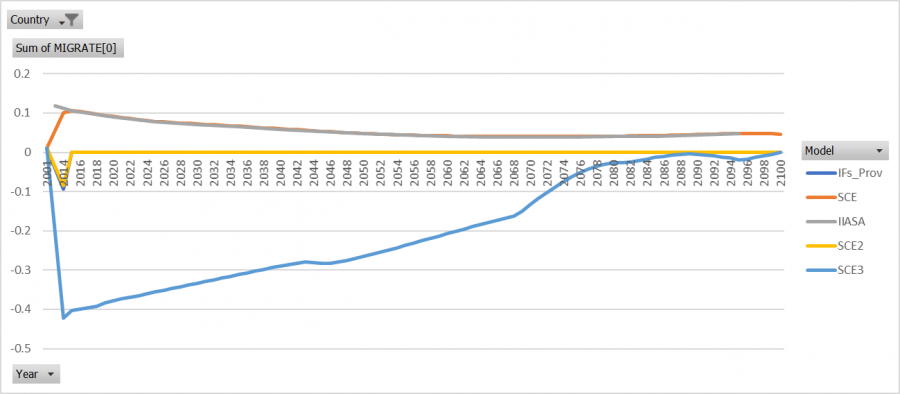
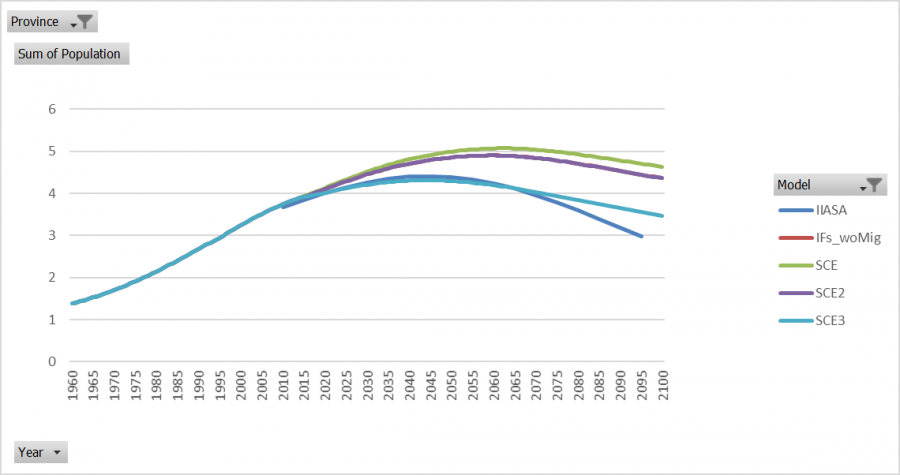
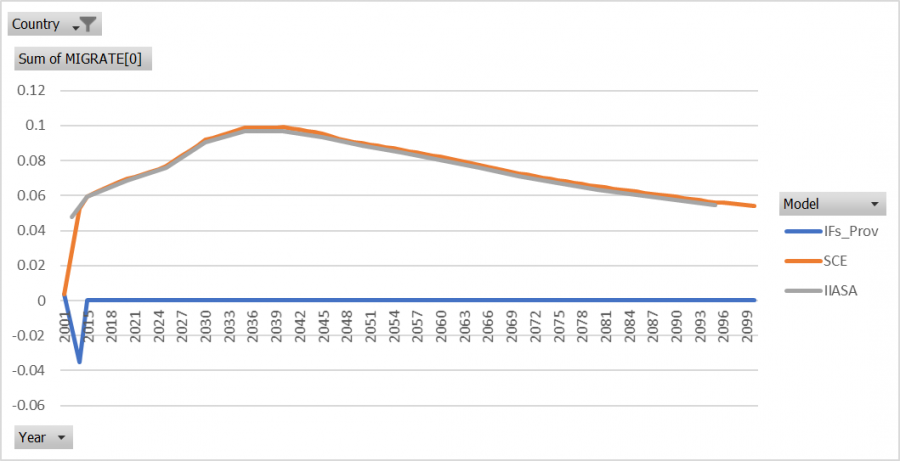
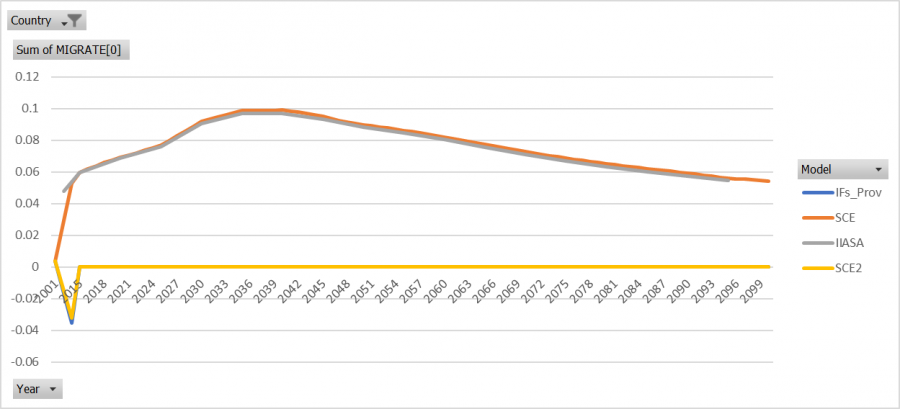
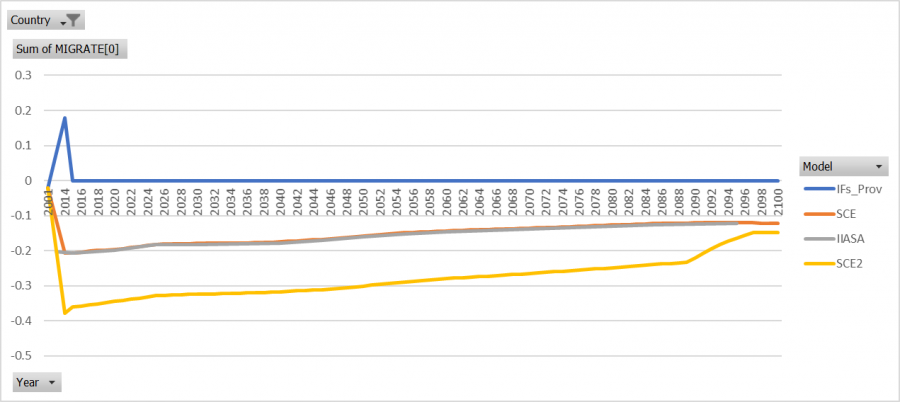
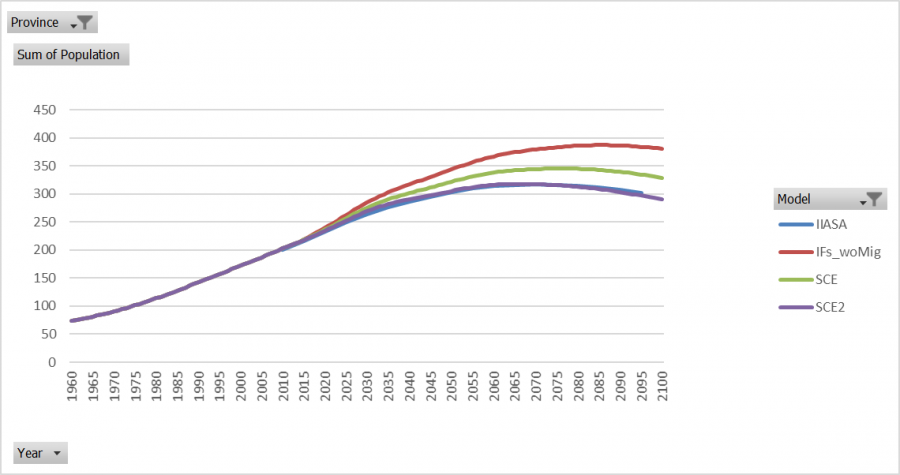
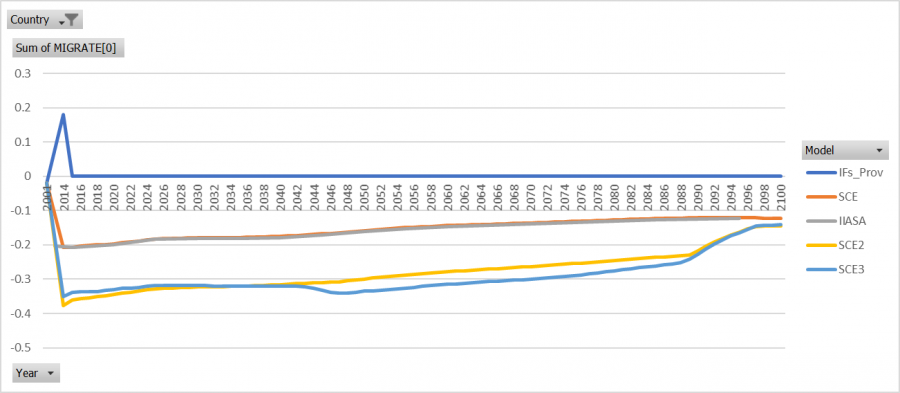
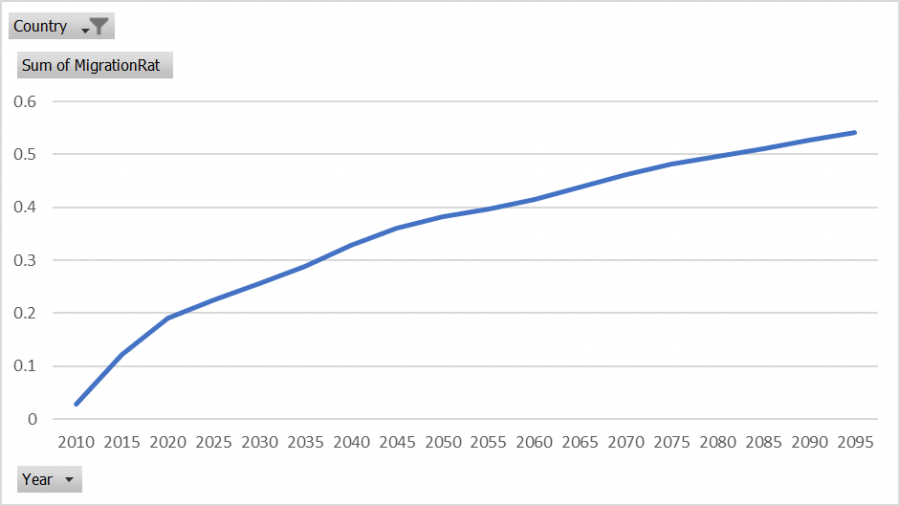
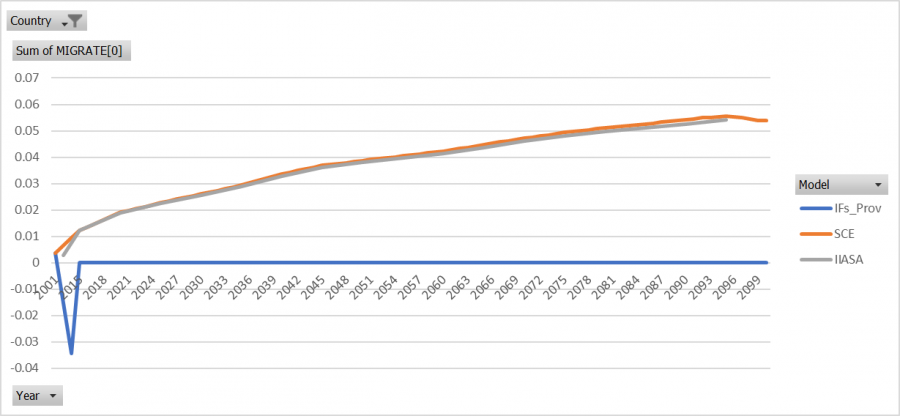
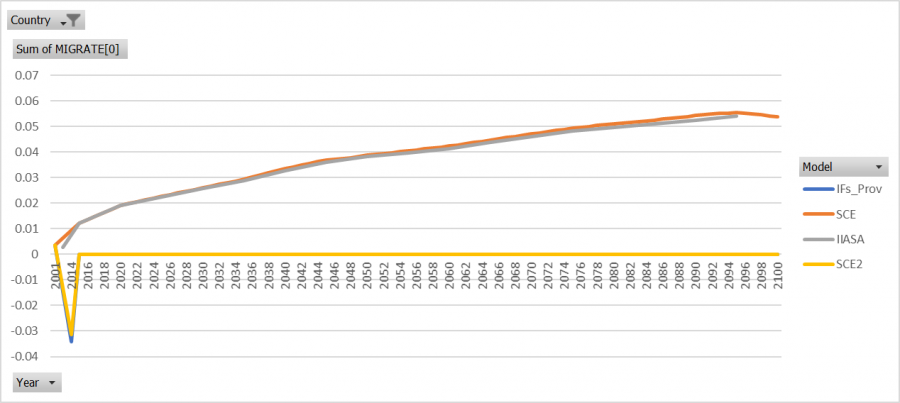
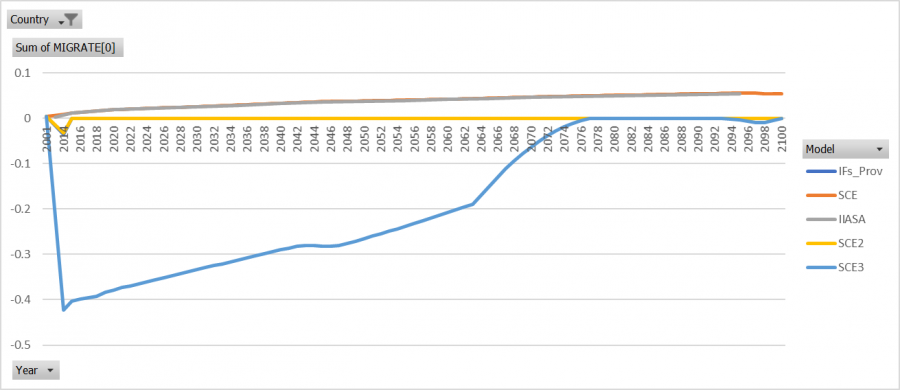
This comparison is followed by graphs that document population model calibration. First migration rates and then population for each state after scenarios using the ''migrater'' parameter in IFs. There are two scenarios for the subnational population in India. The first scenario has migration rates for all provinces that are directly from IIASA. The second scenario is an adjustment of the first scenario where each province's migration rates from IIASA are excluded, included, doubled, or halved. These decisions for this scenario are based upon how the population forecasts looked after the first migration scenario. | This comparison is followed by graphs that document population model calibration. First migration rates and then population for each state after scenarios using the ''migrater'' parameter in IFs. There are two scenarios for the subnational population in India. The first scenario has migration rates for all provinces that are directly from IIASA. The second scenario is an adjustment of the first scenario where each province's migration rates from IIASA are excluded, included, doubled, or halved. These decisions for this scenario are based upon how the population forecasts looked after the first migration scenario. The third scenario is a slightly adjusted version of the second scenario that was run with the final China migration scenario. | ||
Two states are missing from this analysis, Andhra Pradesh and Telangana. These states were not included because IIASA's forecasts only have Andhra Pradesh, which includes Telangana. Whereas, the IFs model has Andhra Pradesh and Telangana separated. | Two states are missing from this analysis, Andhra Pradesh and Telangana. These states were not included because IIASA's forecasts only have Andhra Pradesh, which includes Telangana. Whereas, the IFs model has Andhra Pradesh and Telangana separated. | ||
=== India === | |||
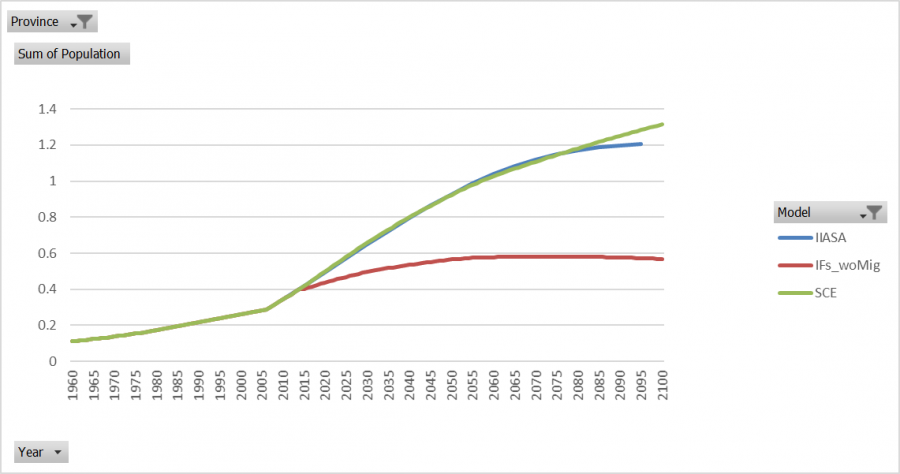
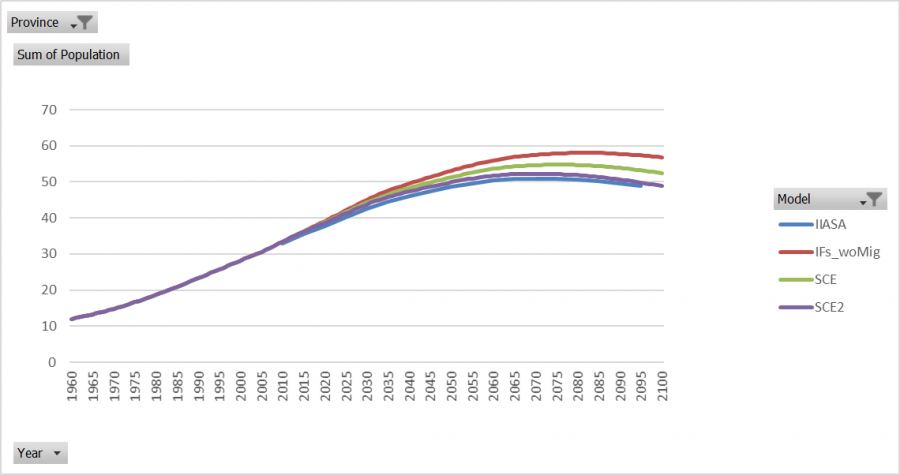
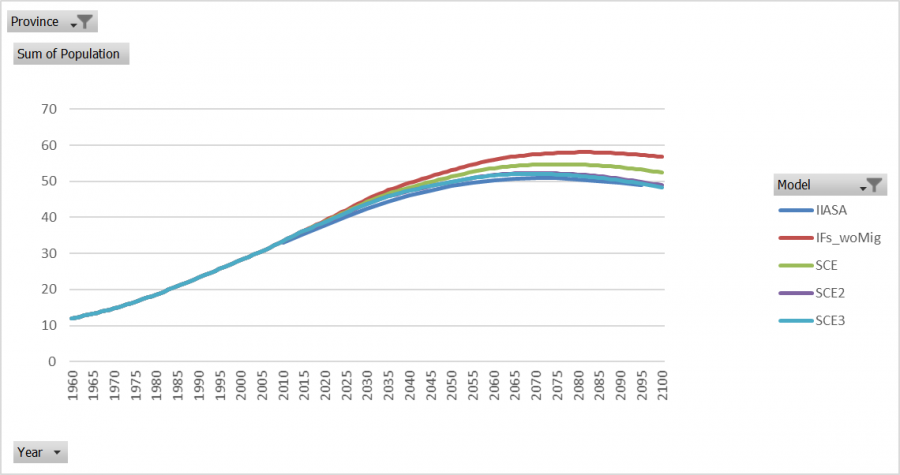
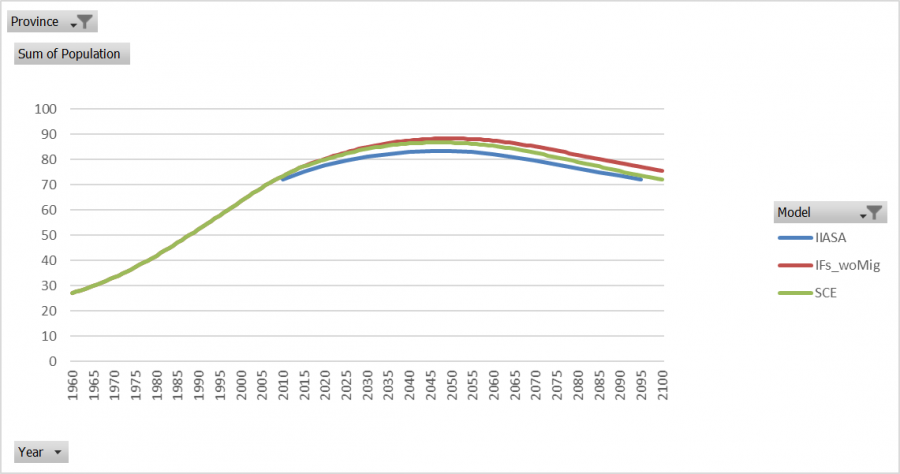
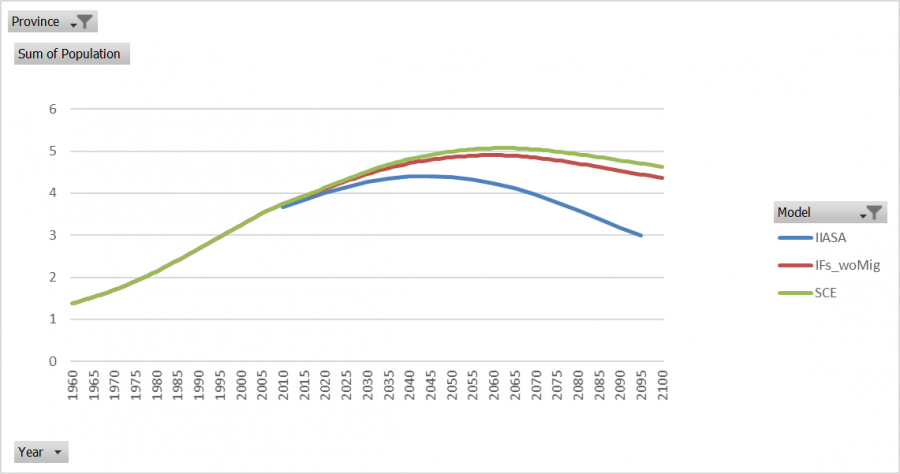
==== Population ==== | |||
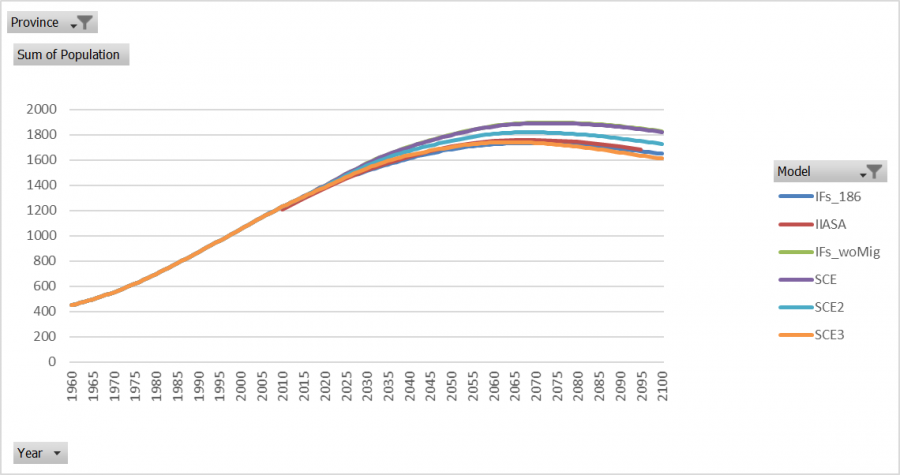
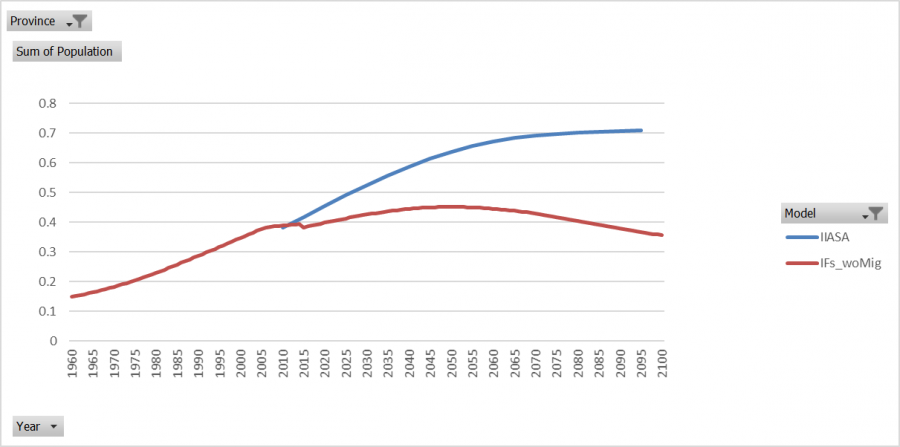
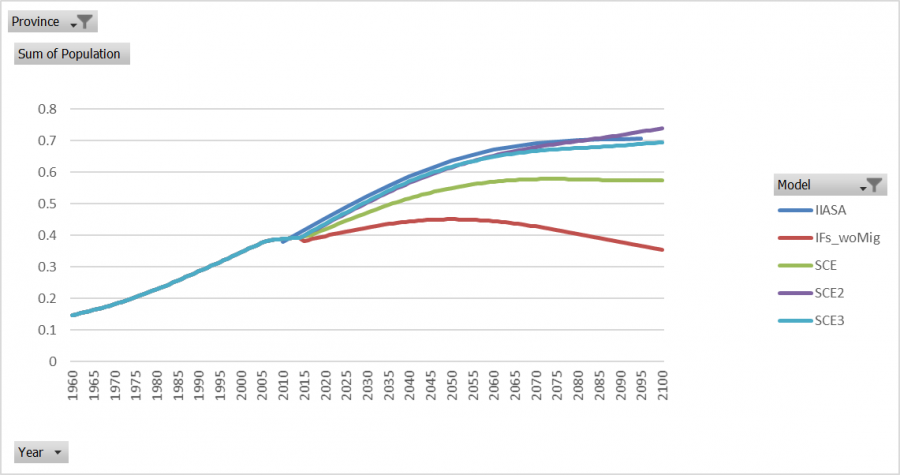
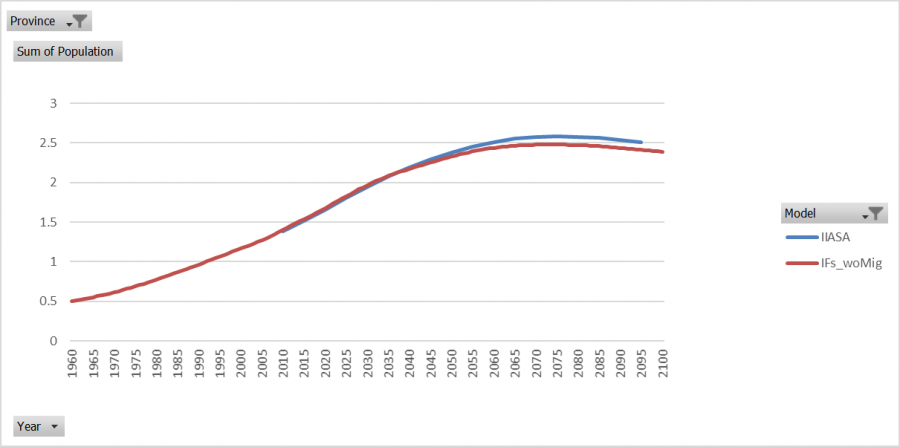
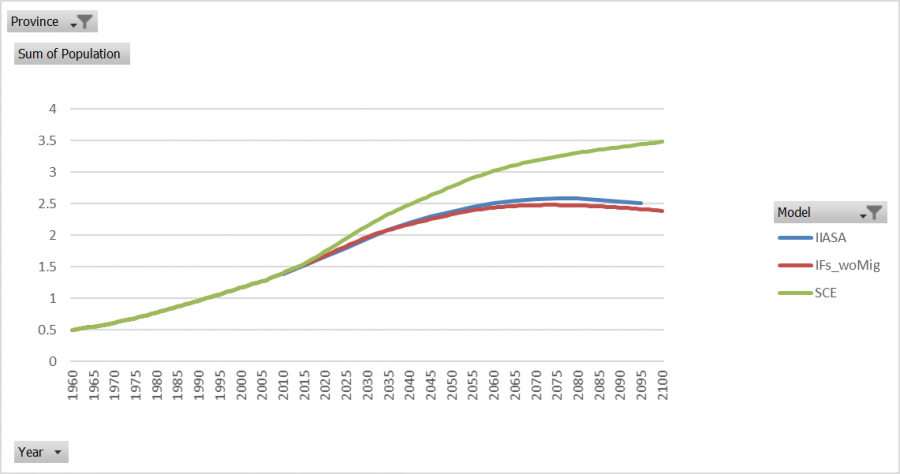
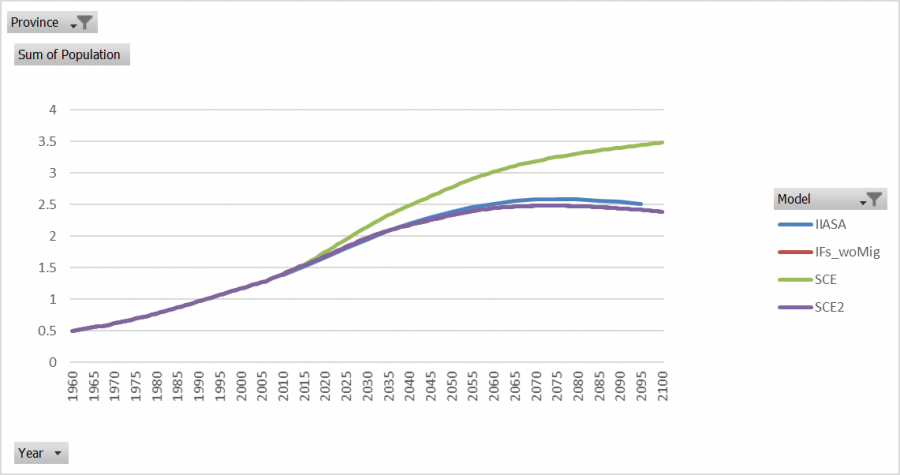
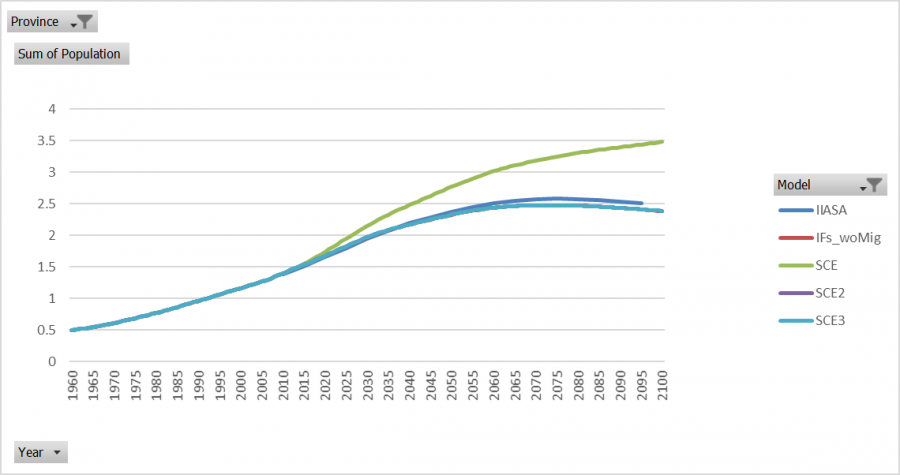
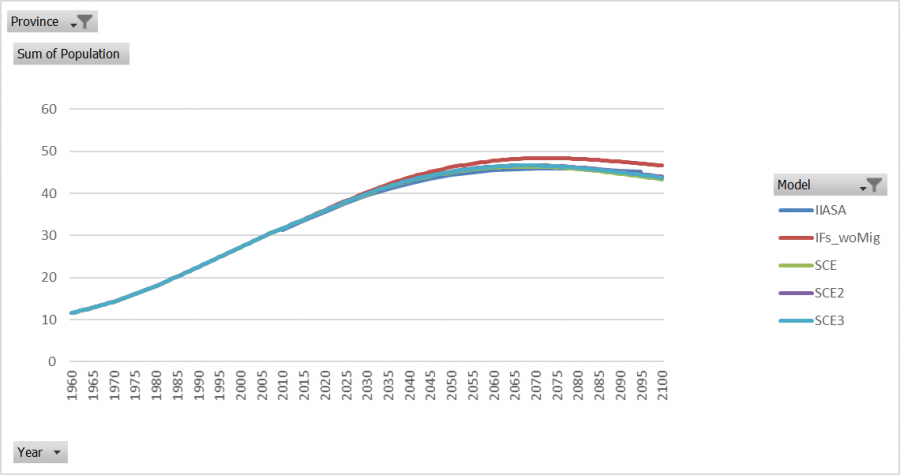
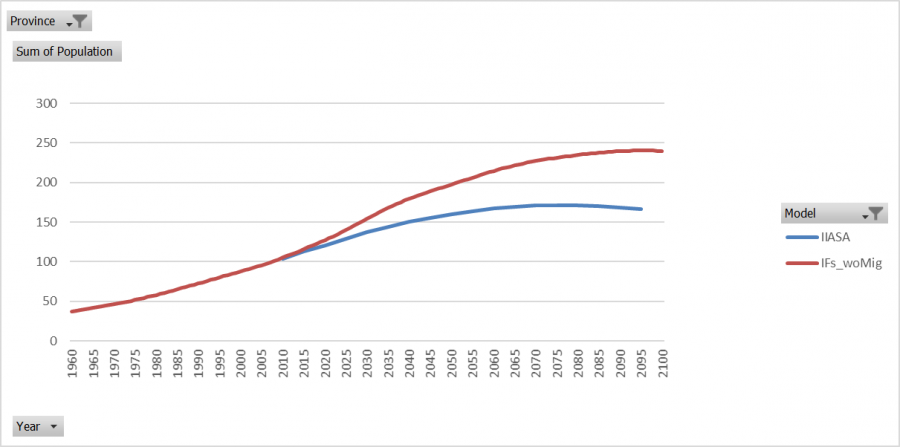
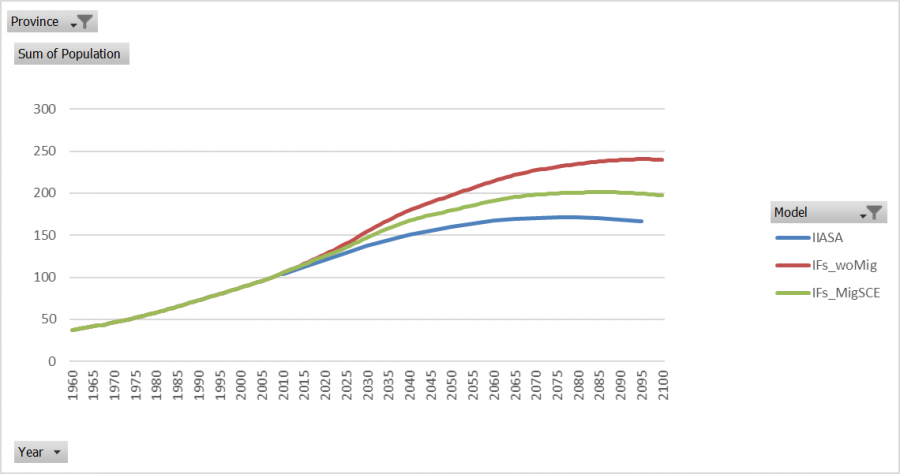
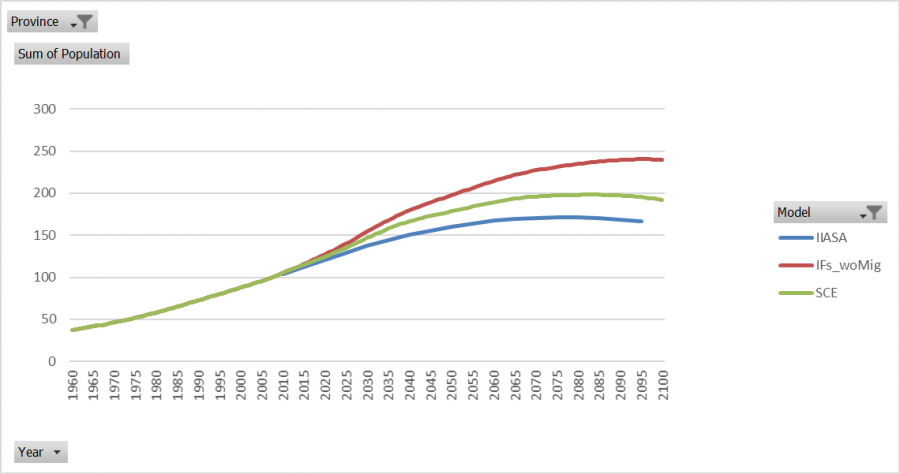
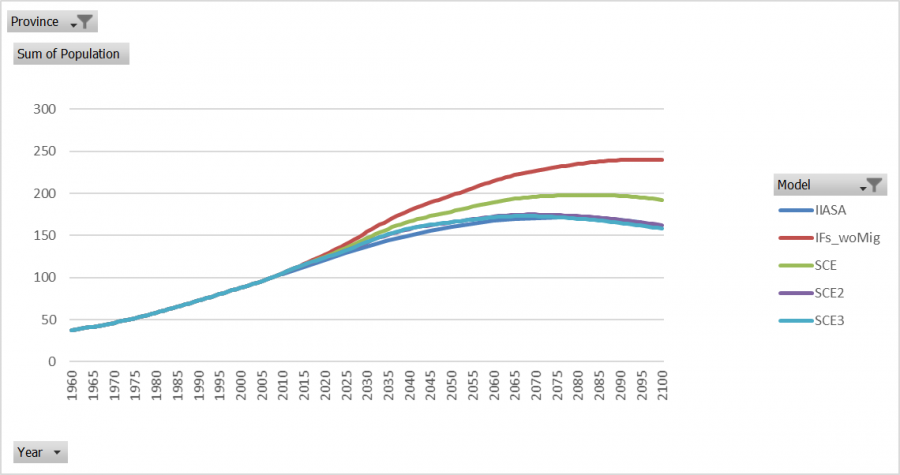
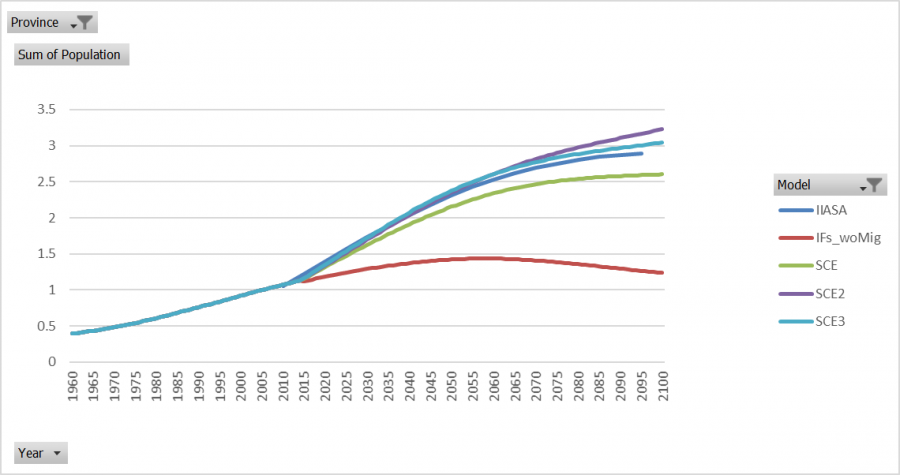
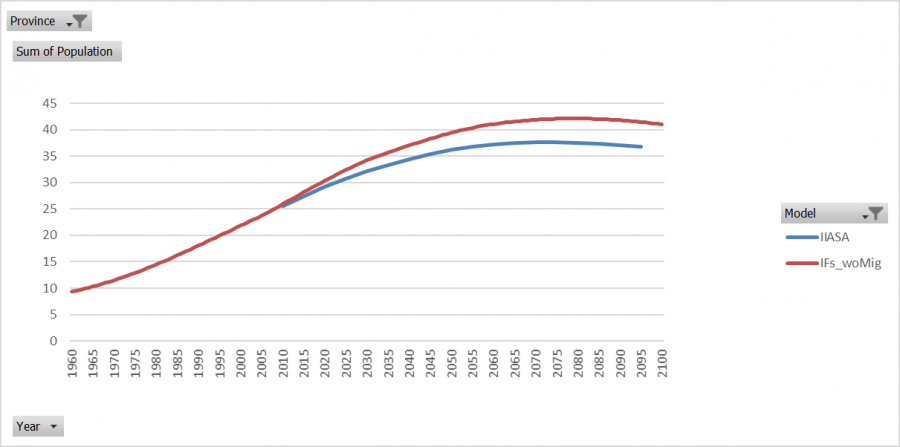
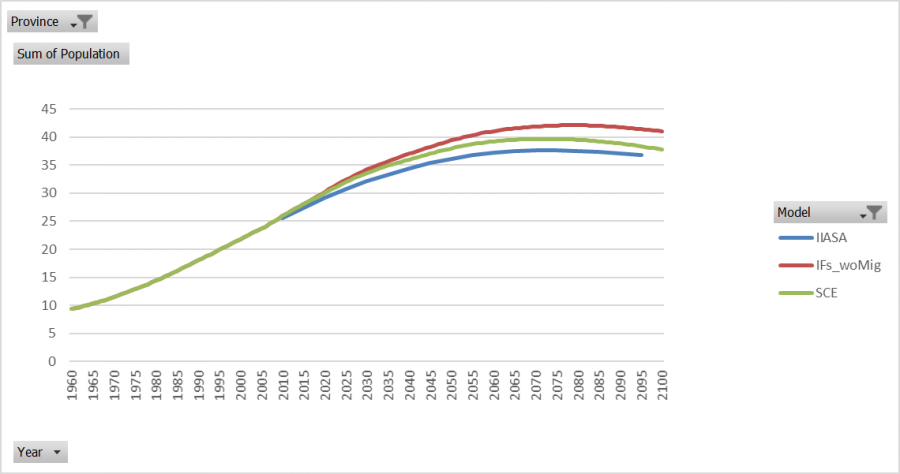
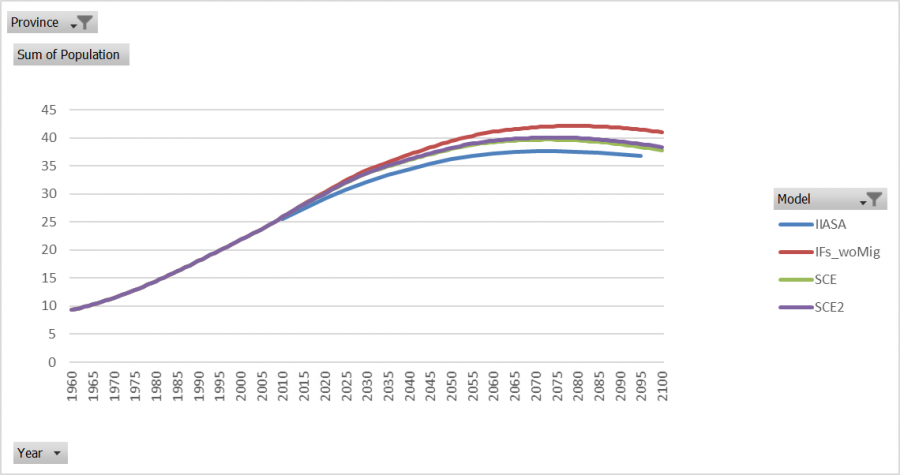
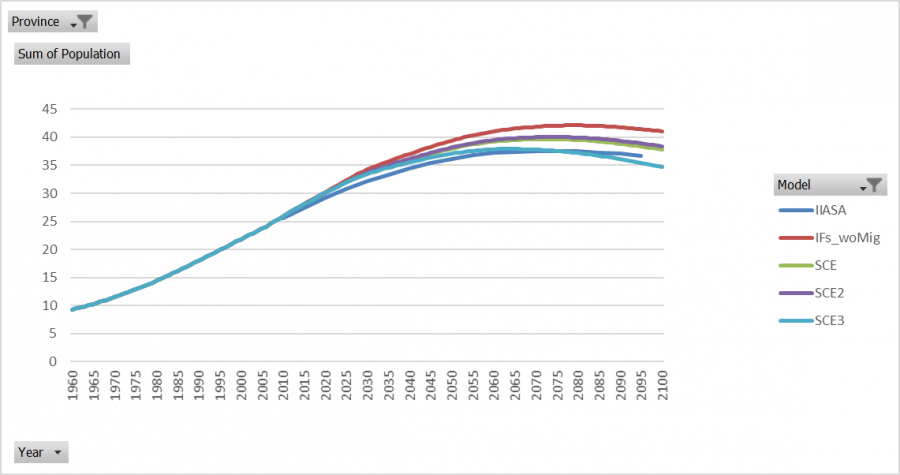
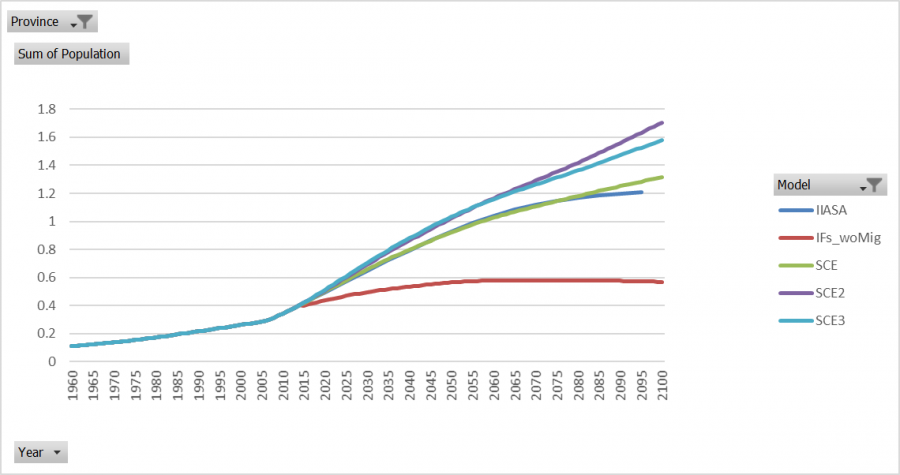
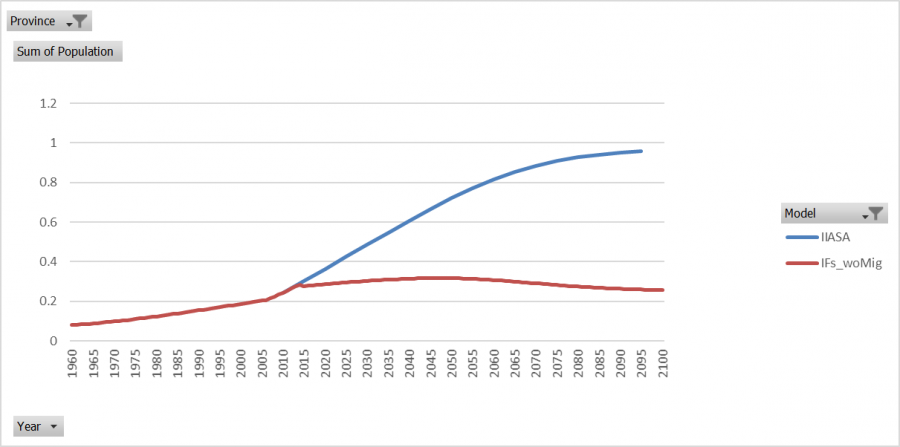
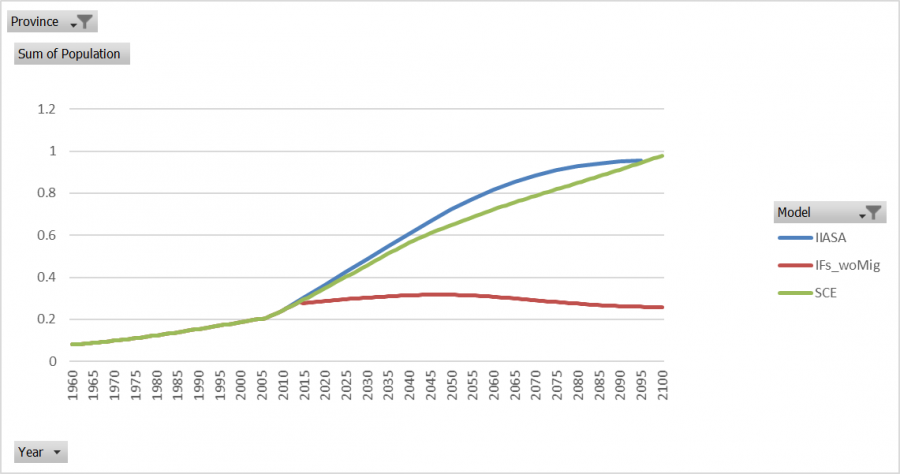
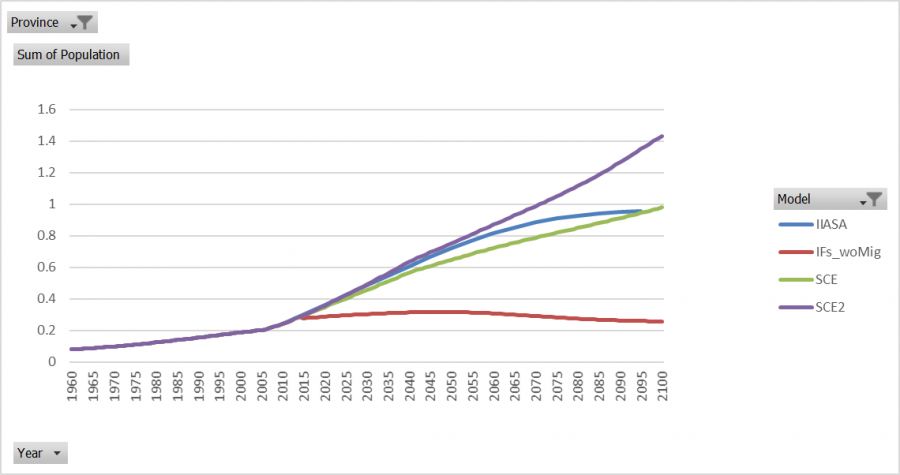
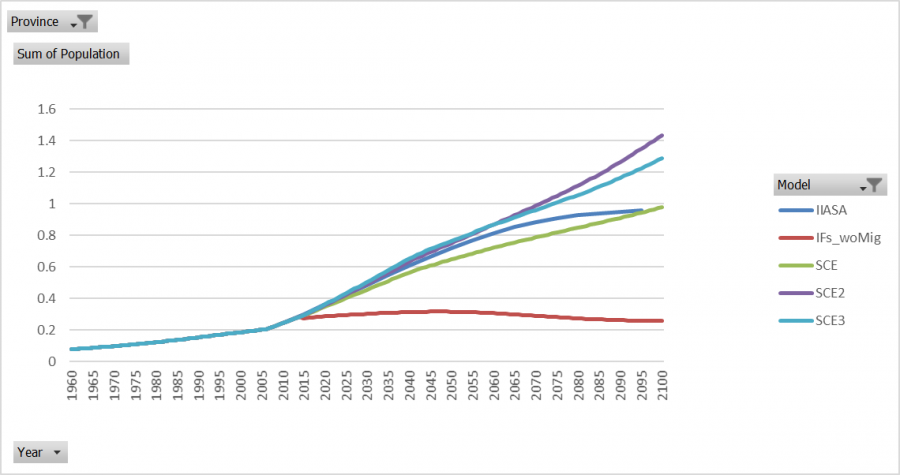
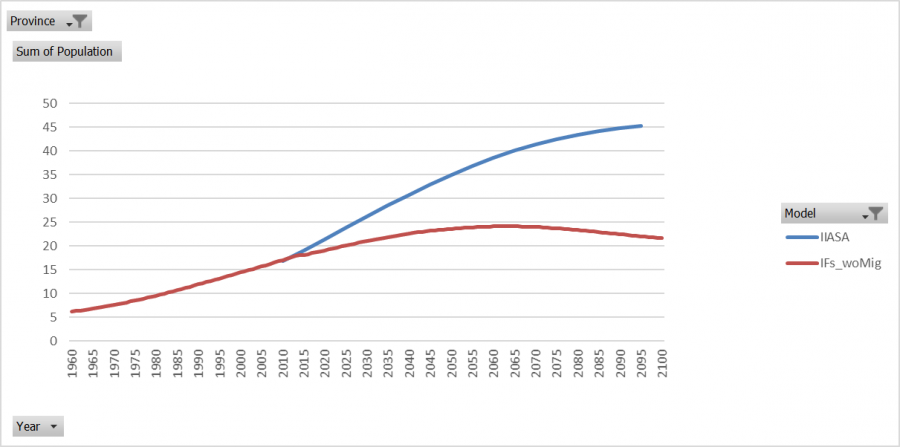
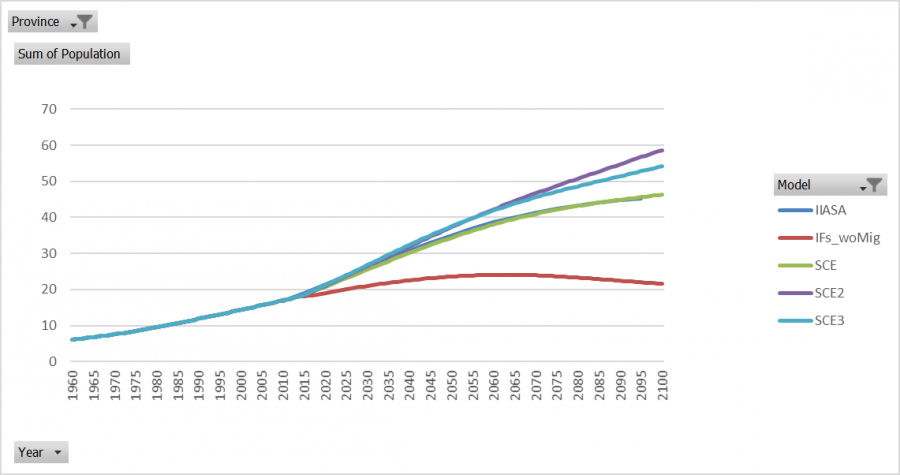
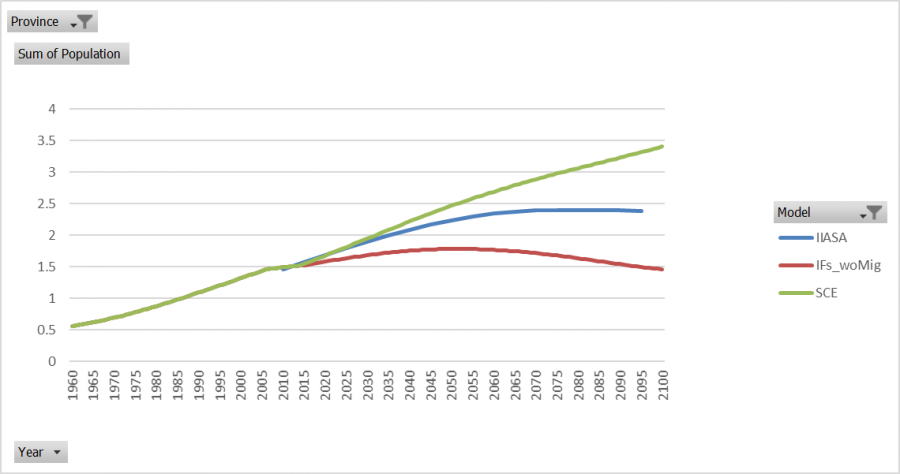
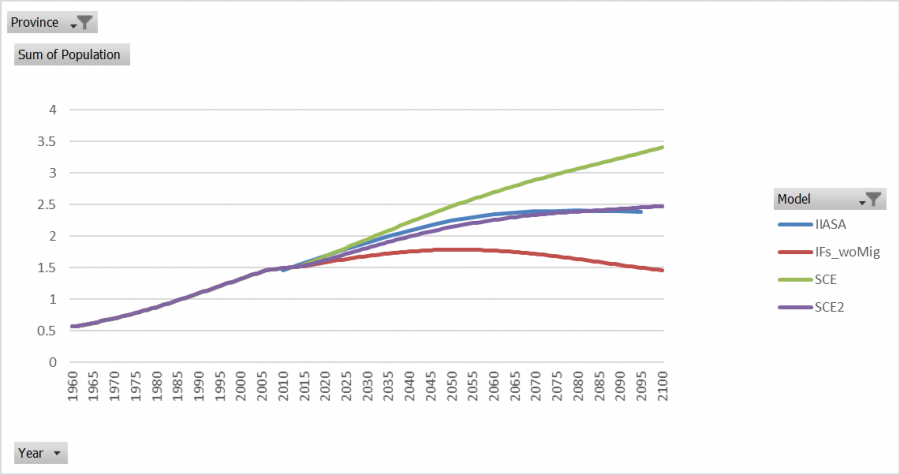
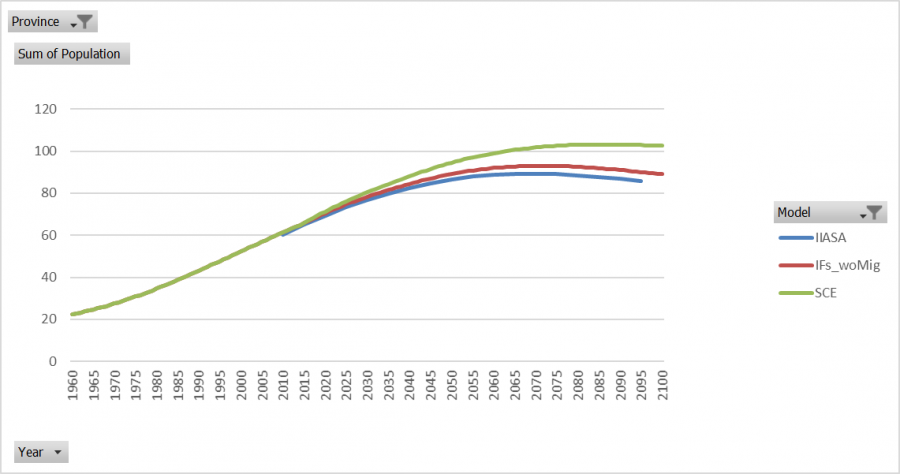
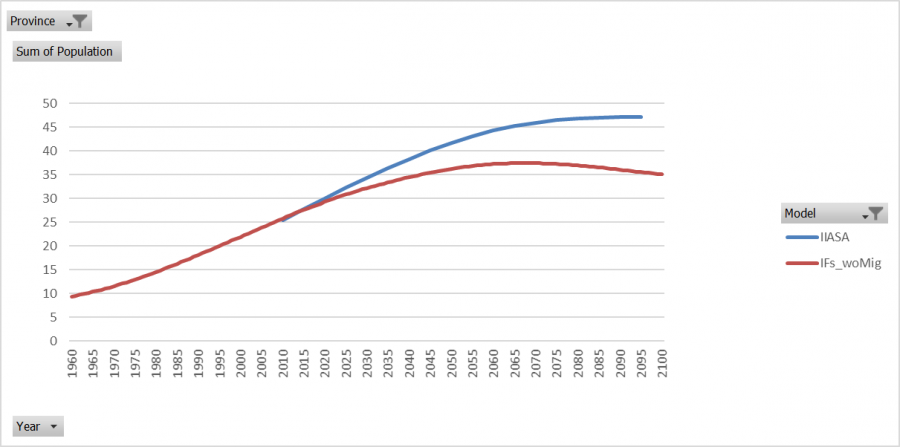
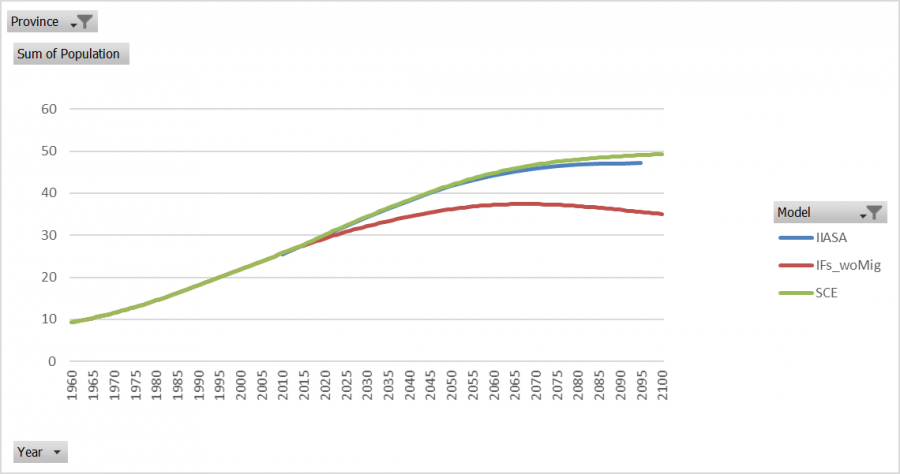
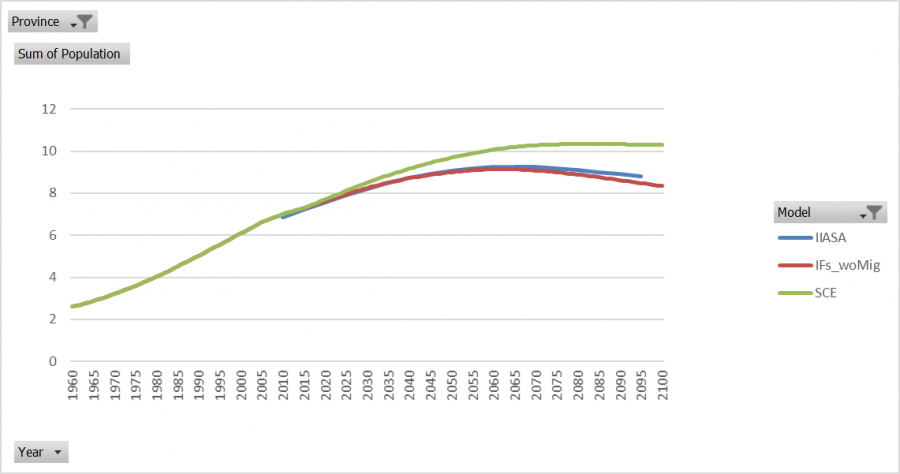
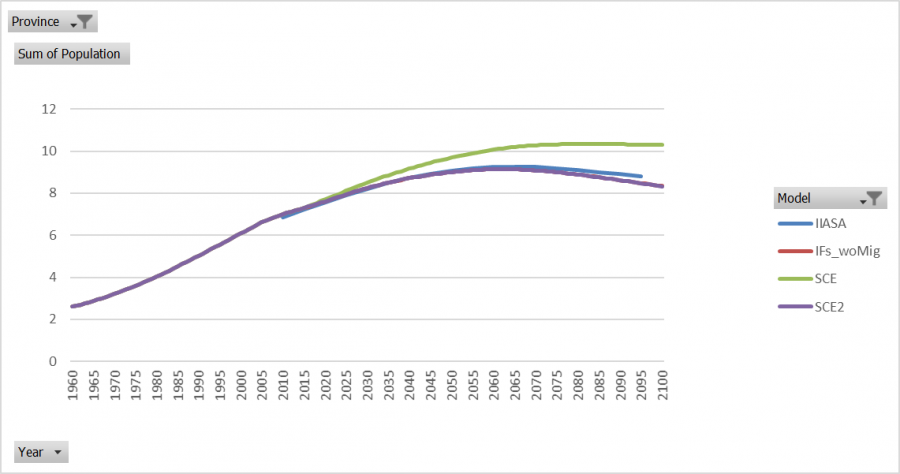
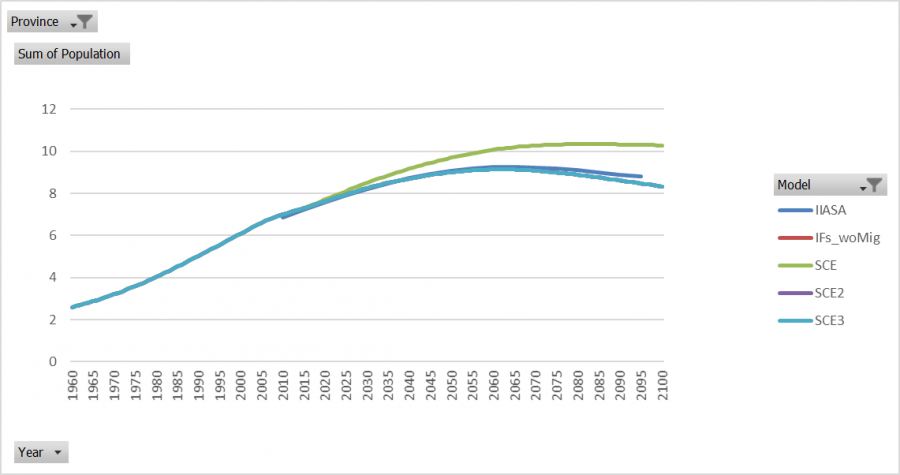
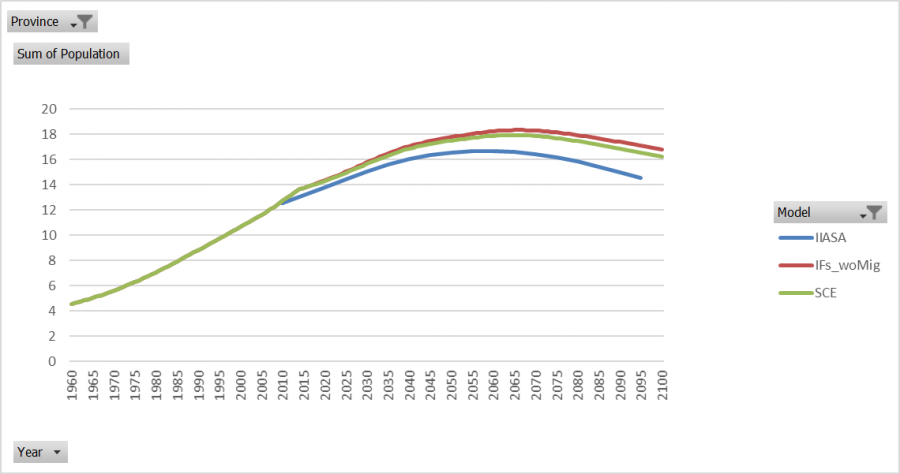
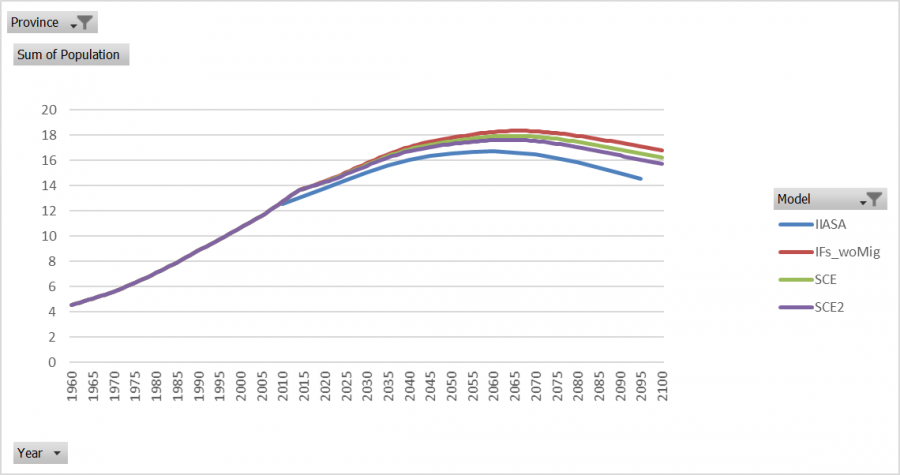
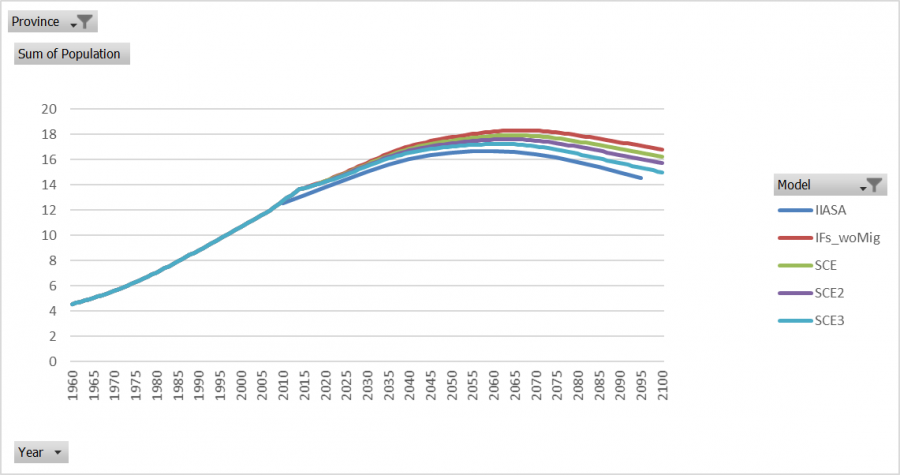
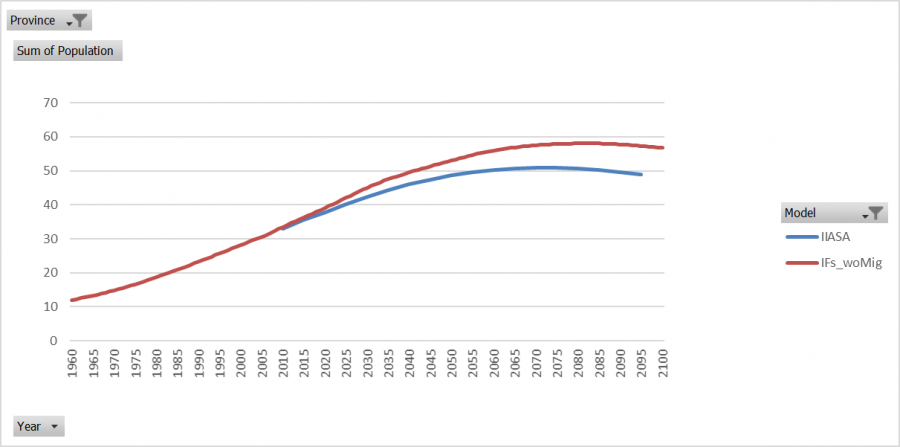
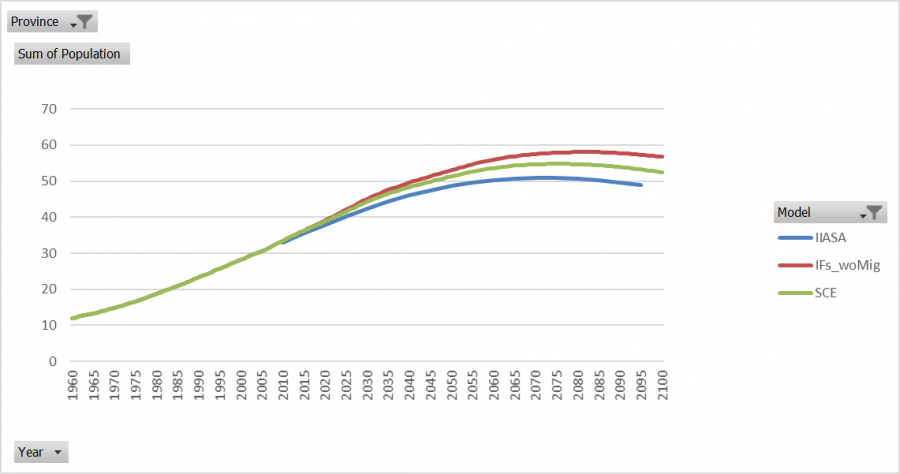
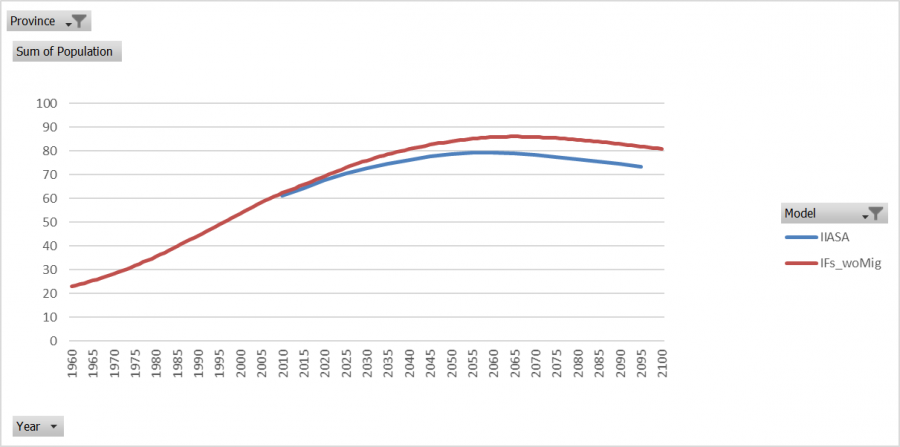
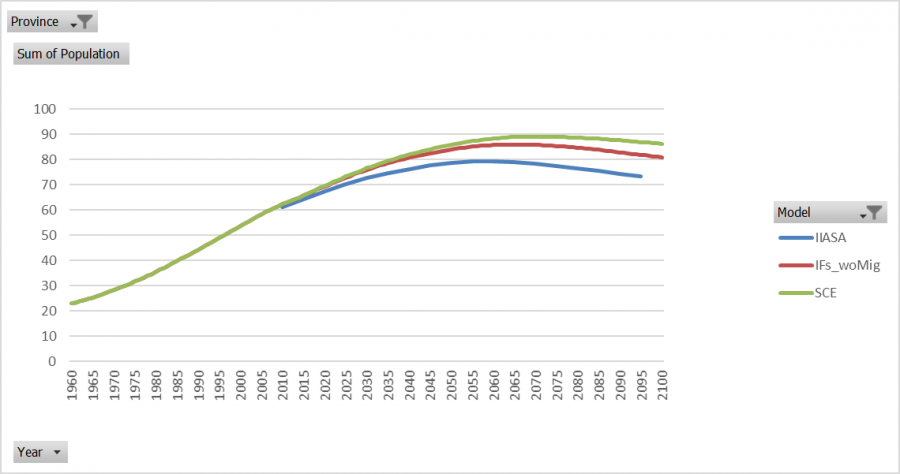
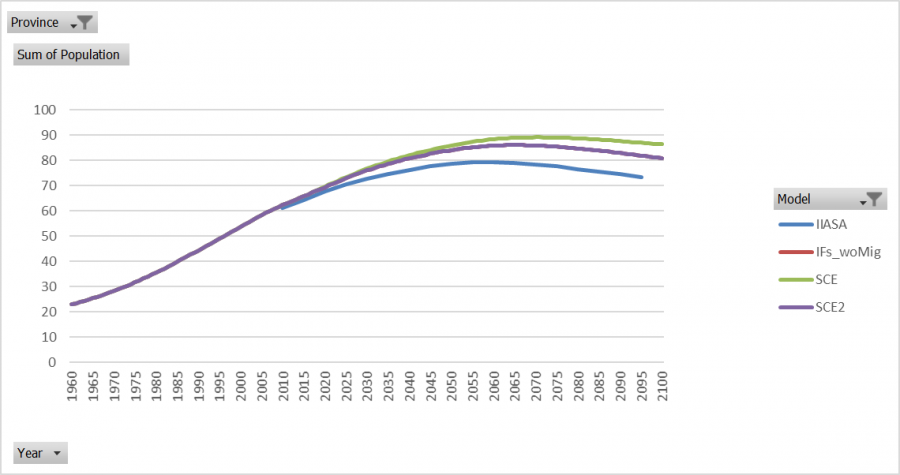
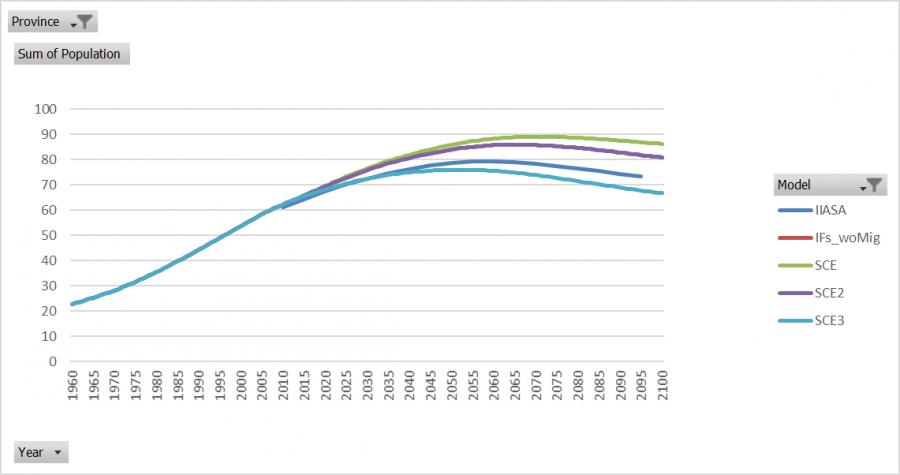
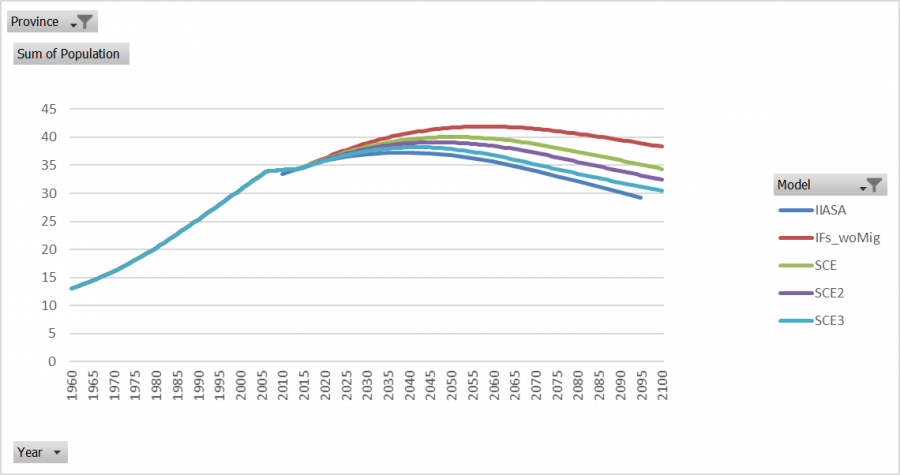
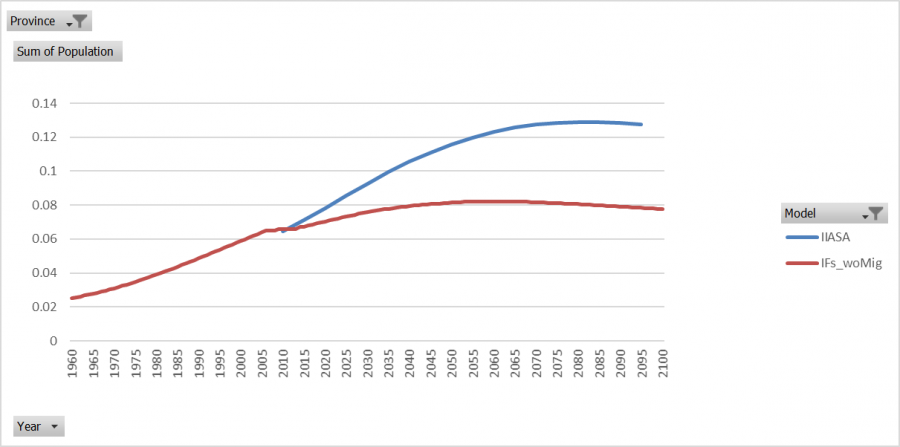
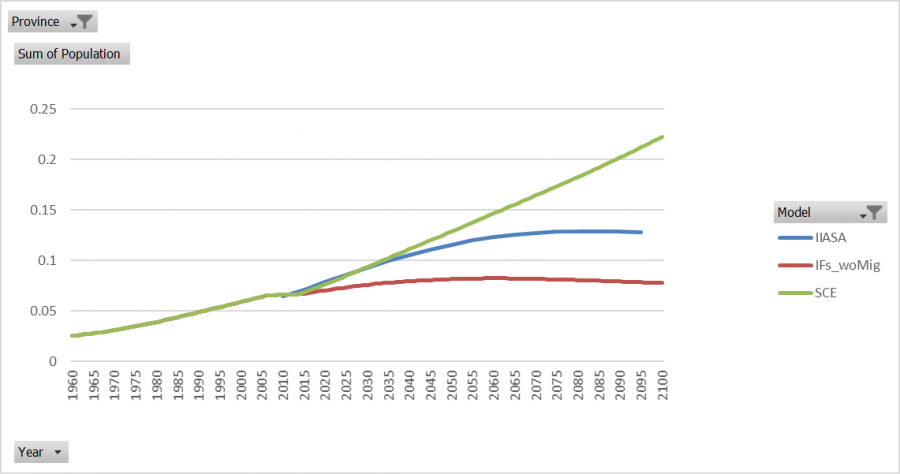
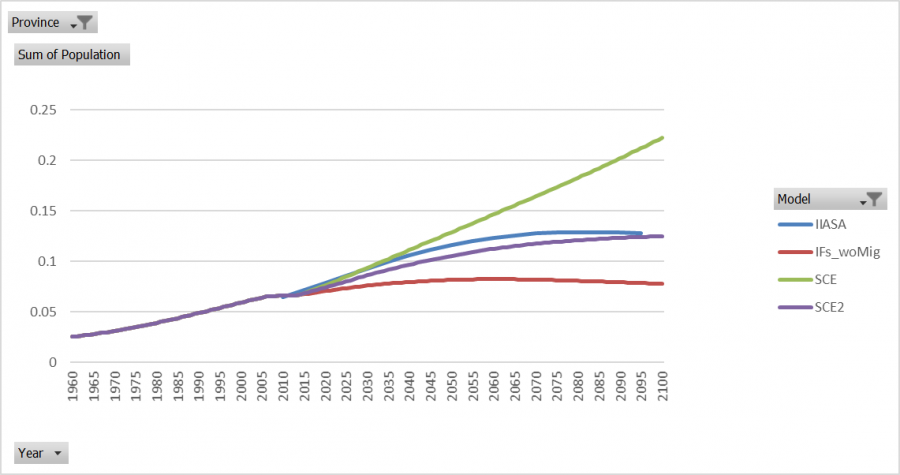
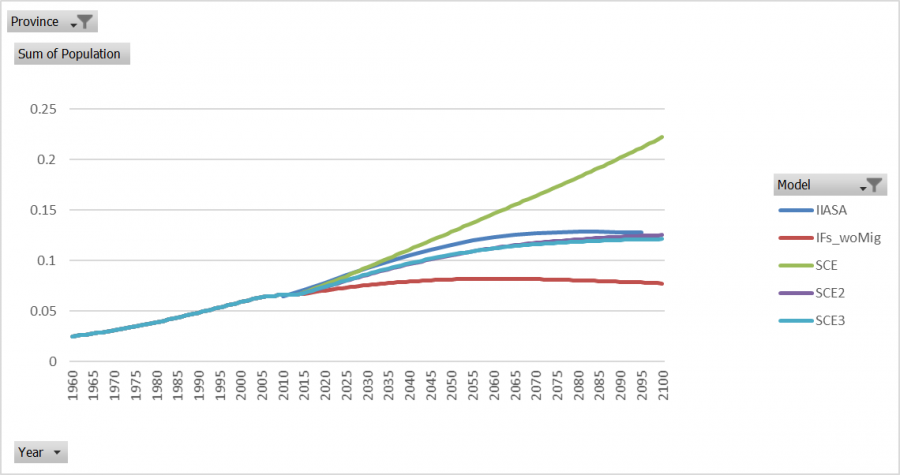
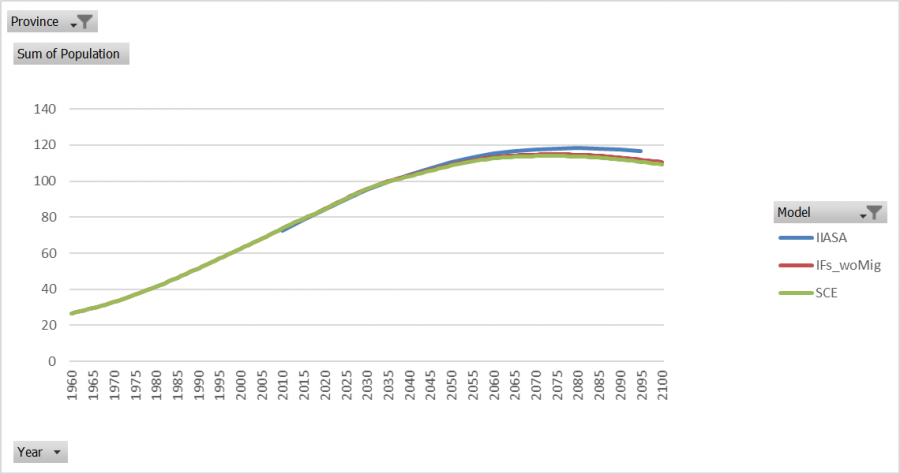
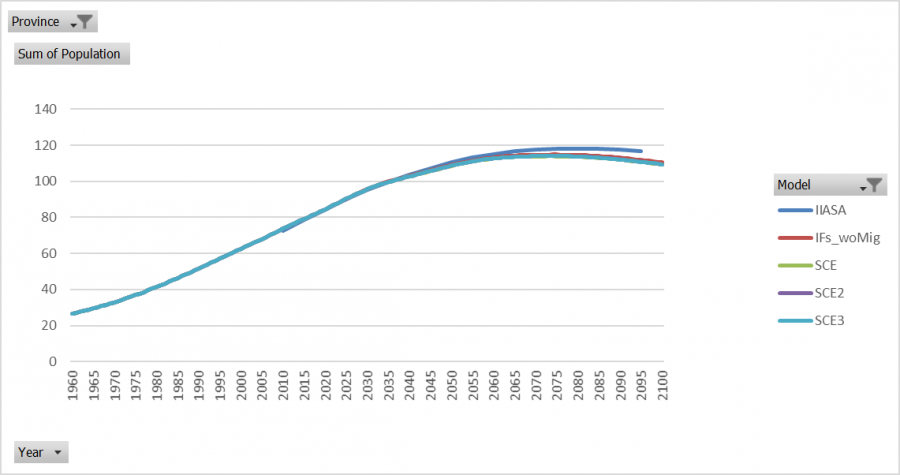
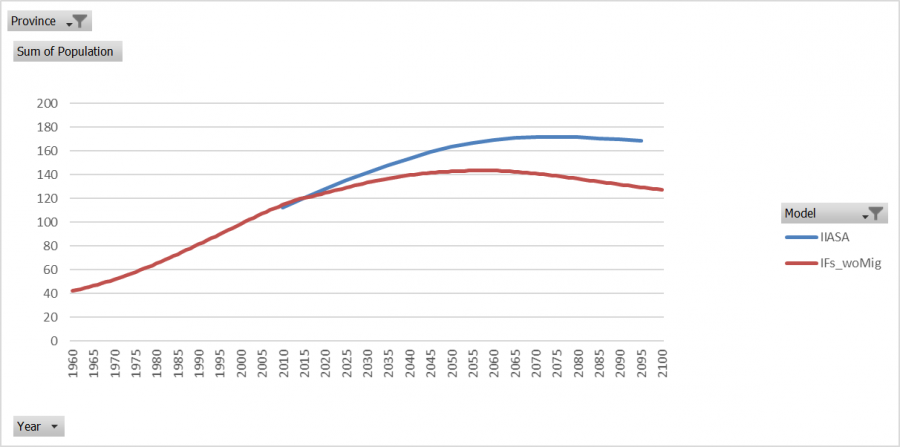
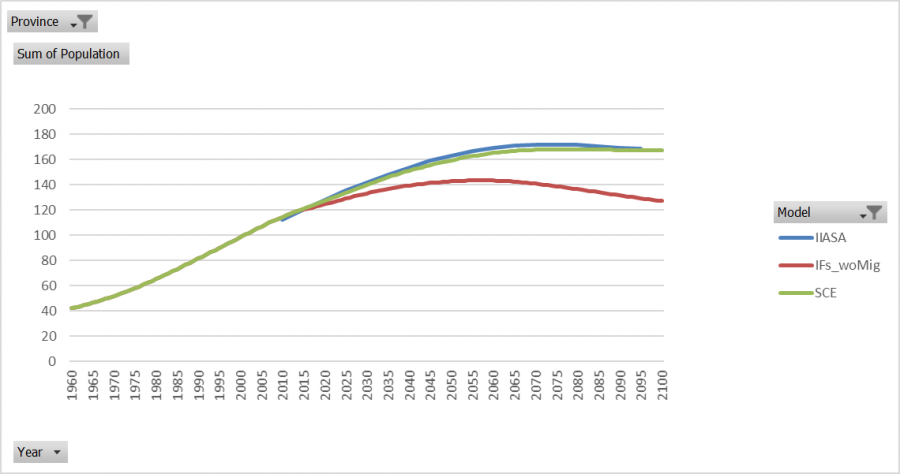
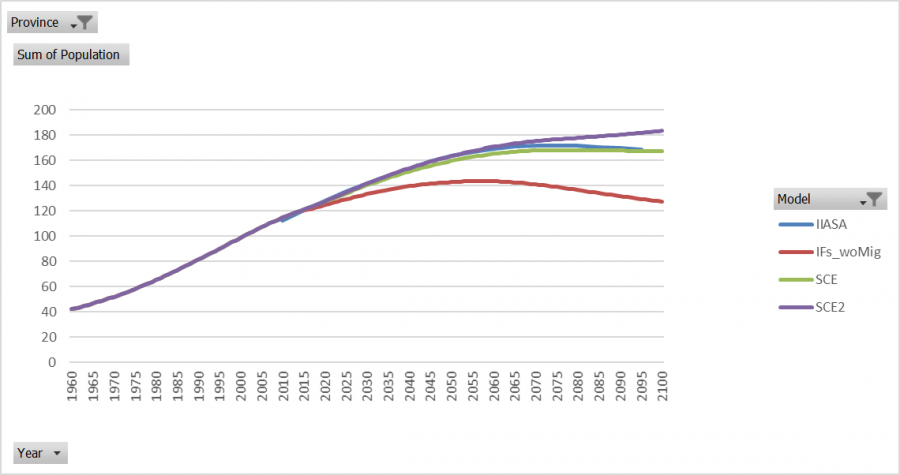
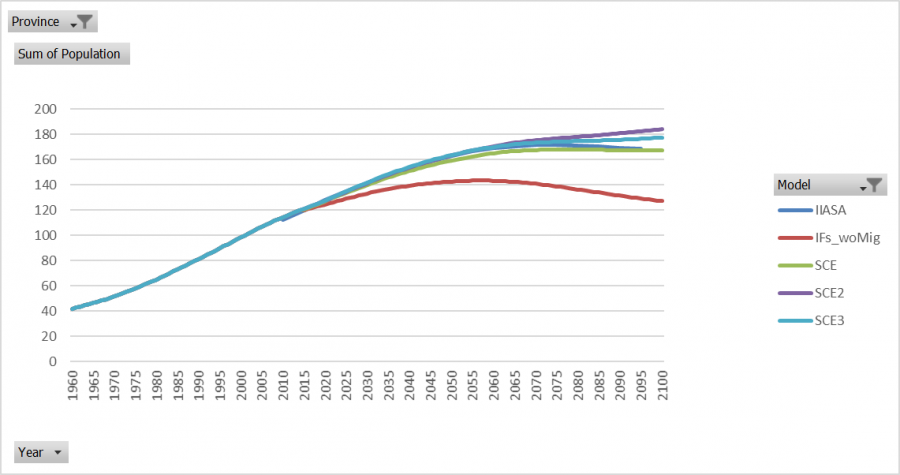
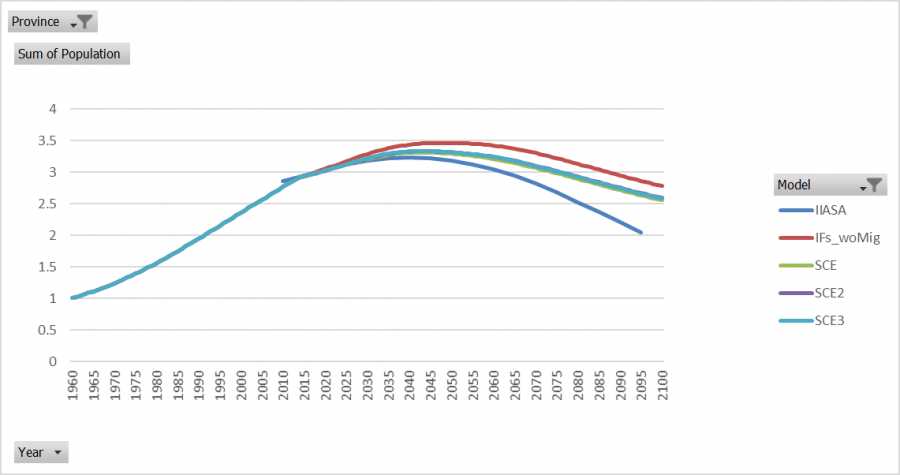
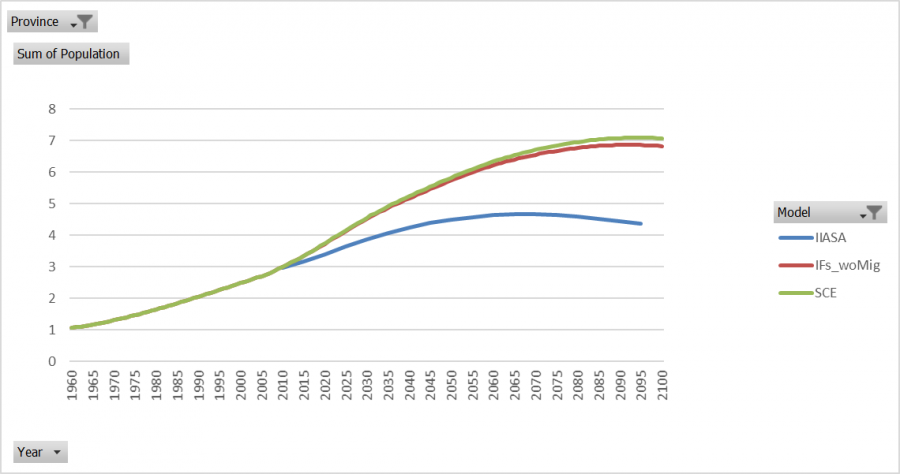
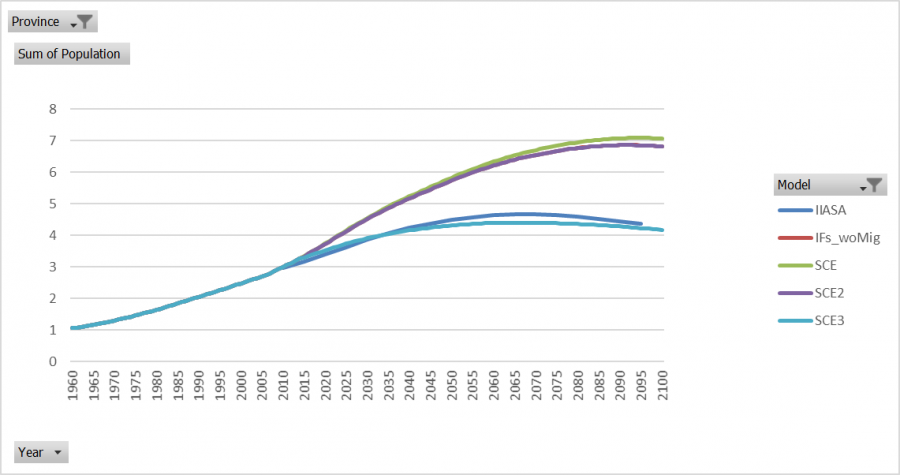
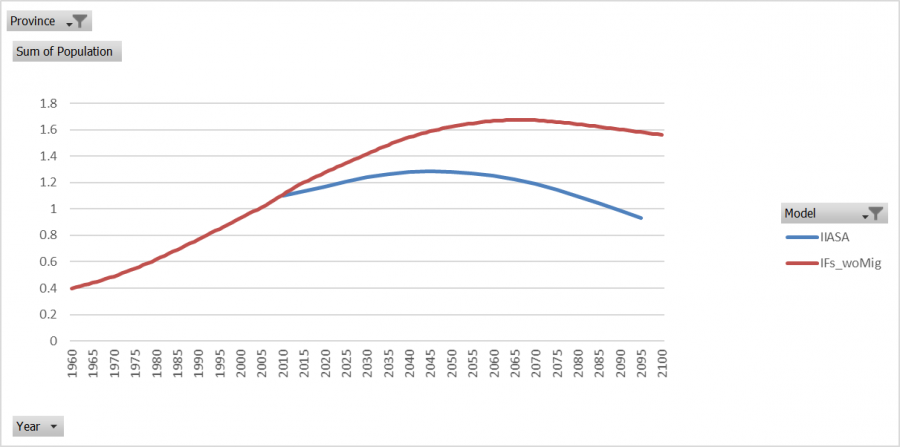
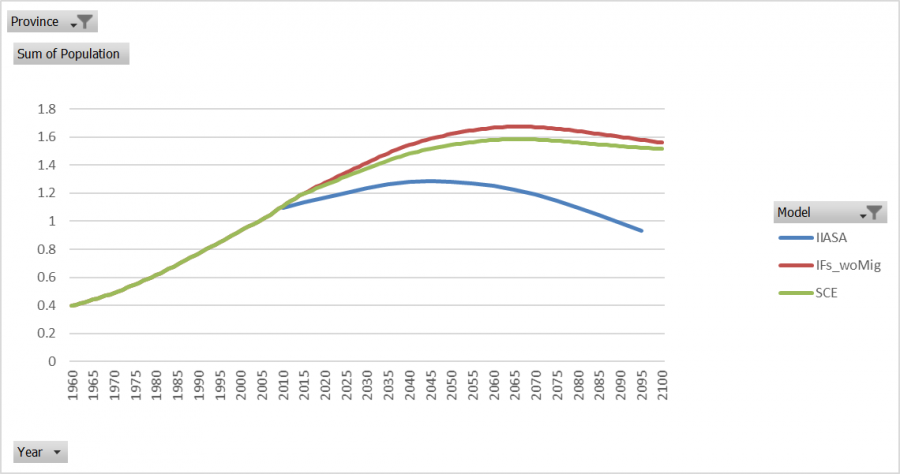
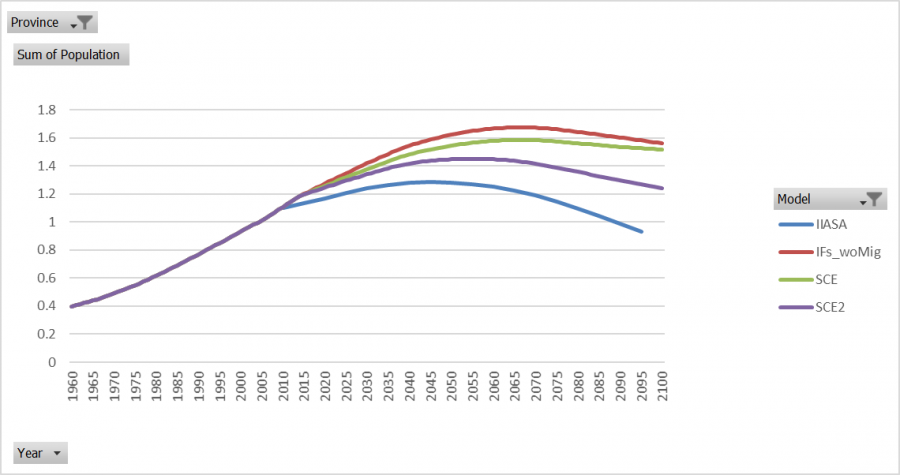
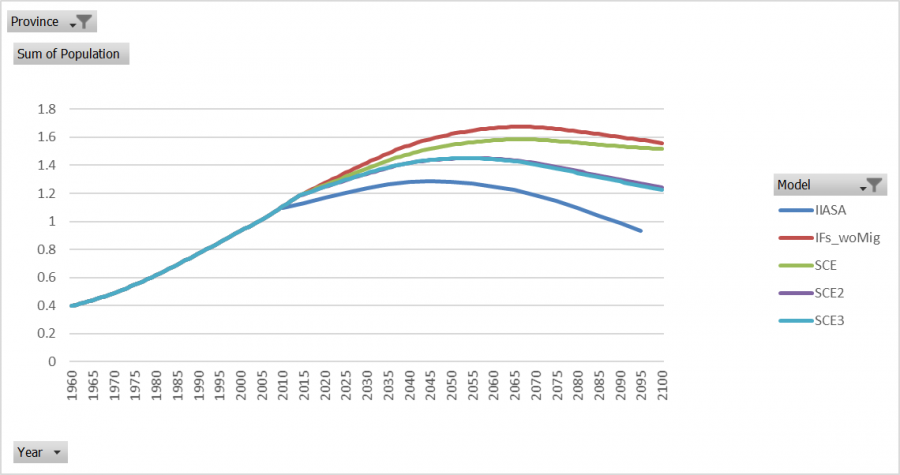
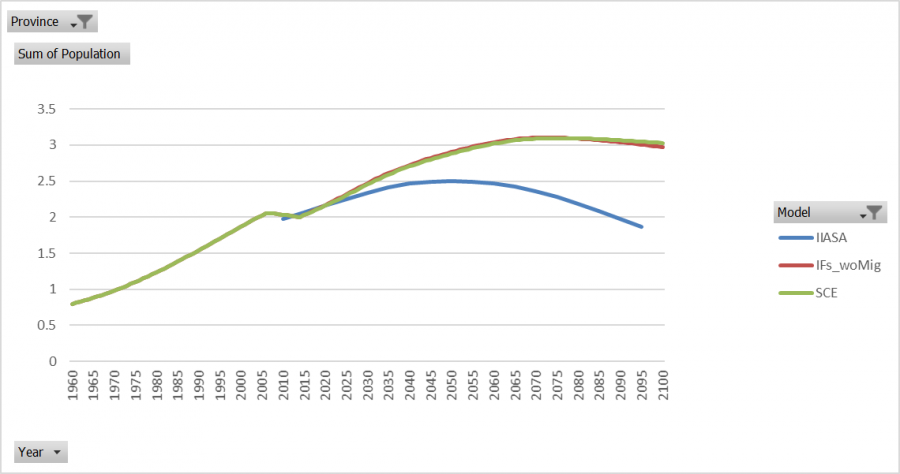
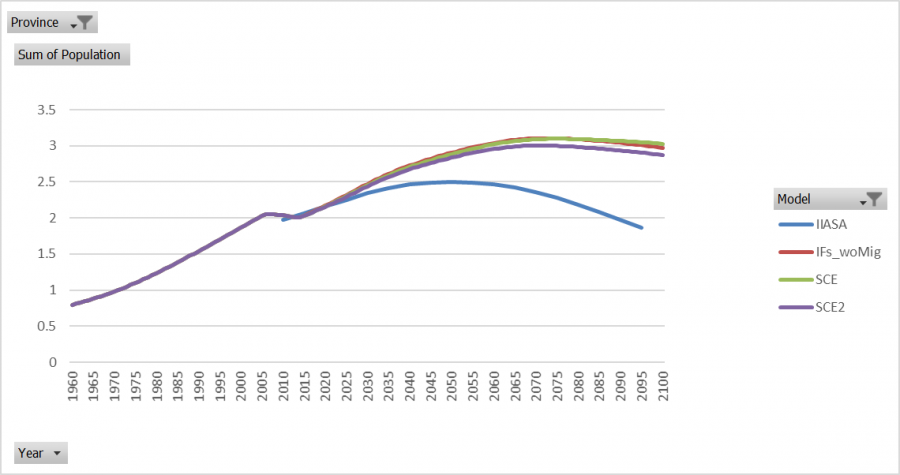
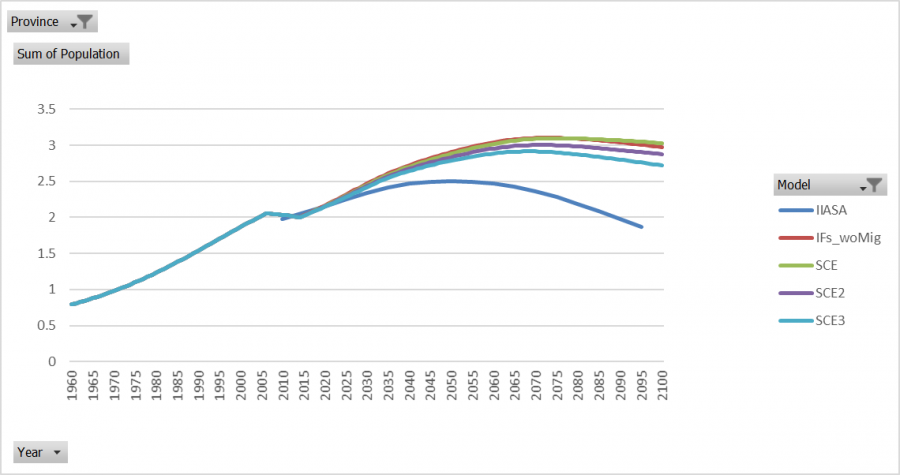
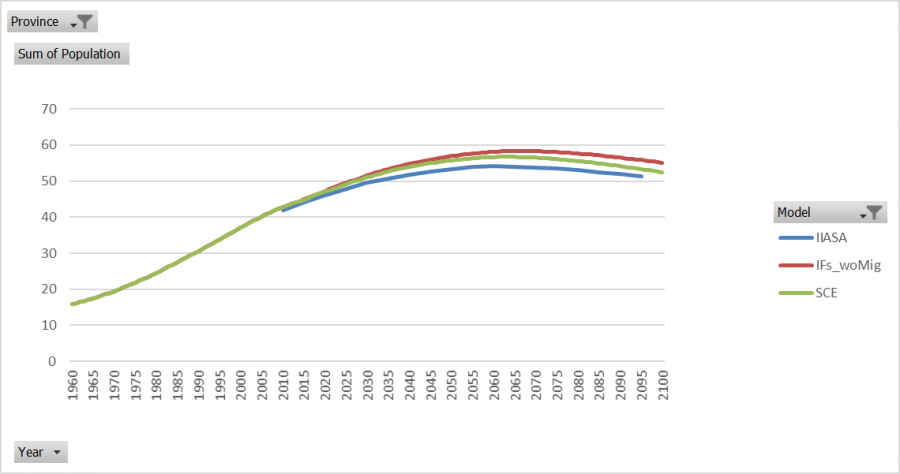
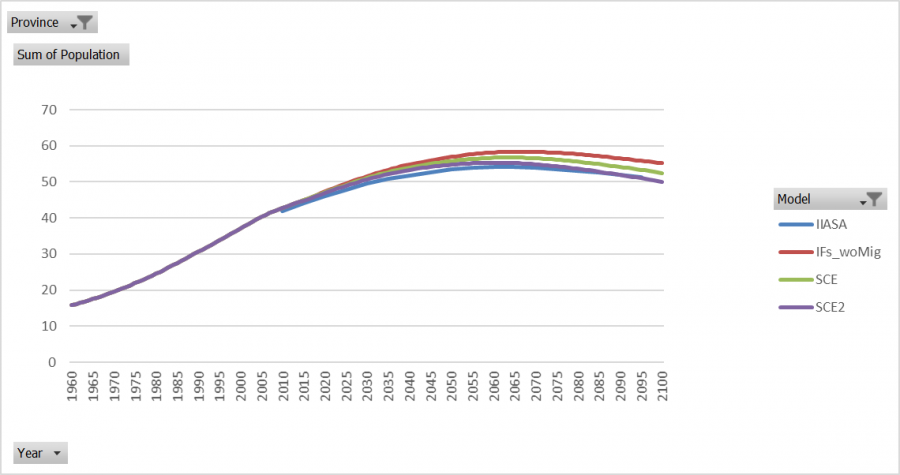
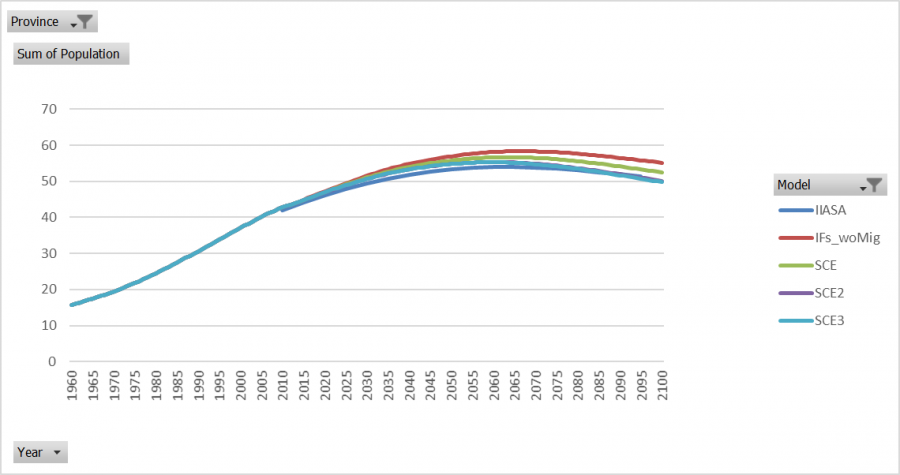
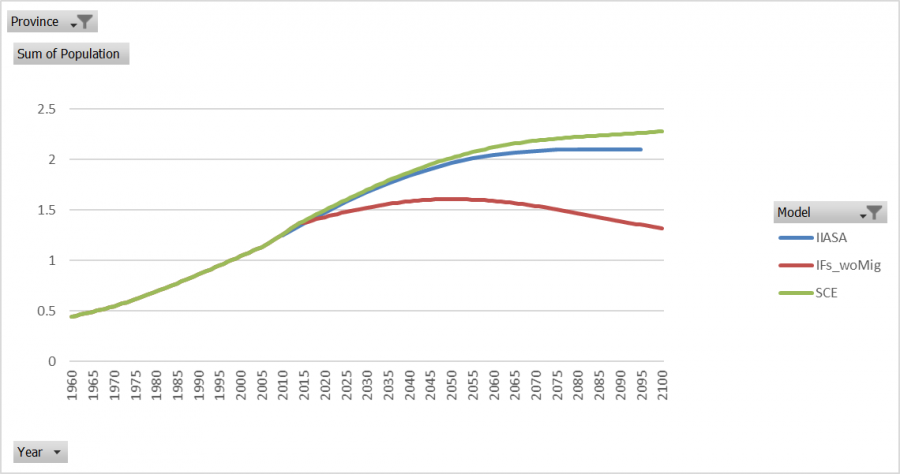
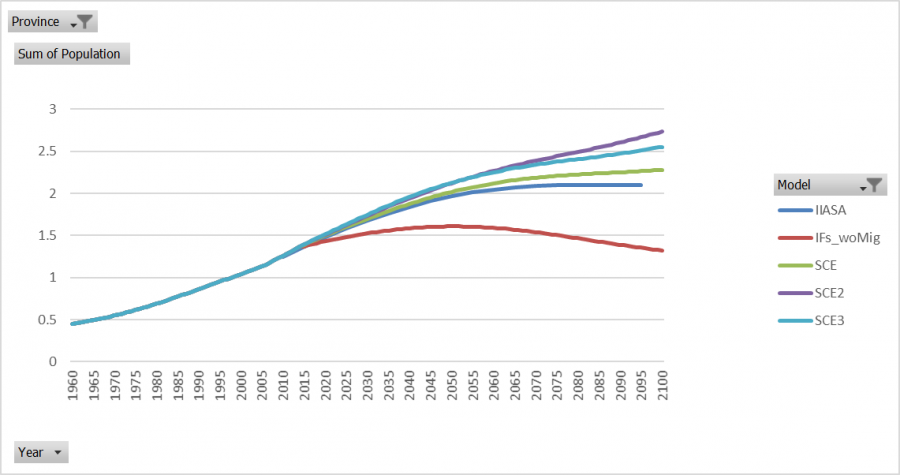
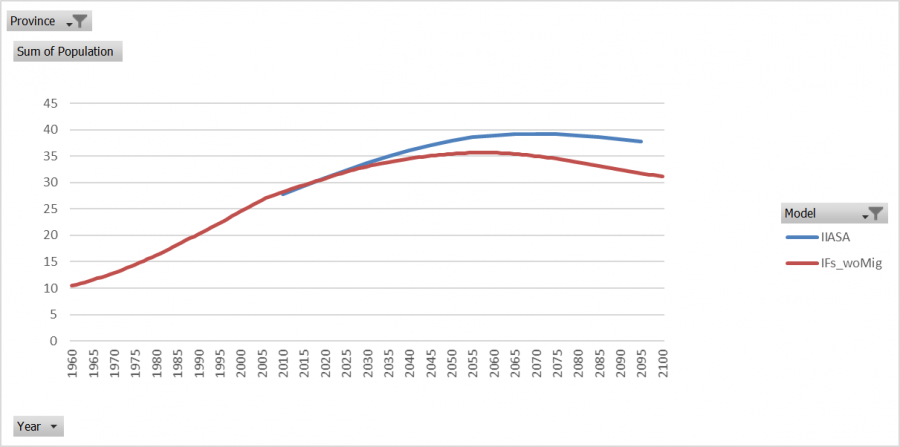
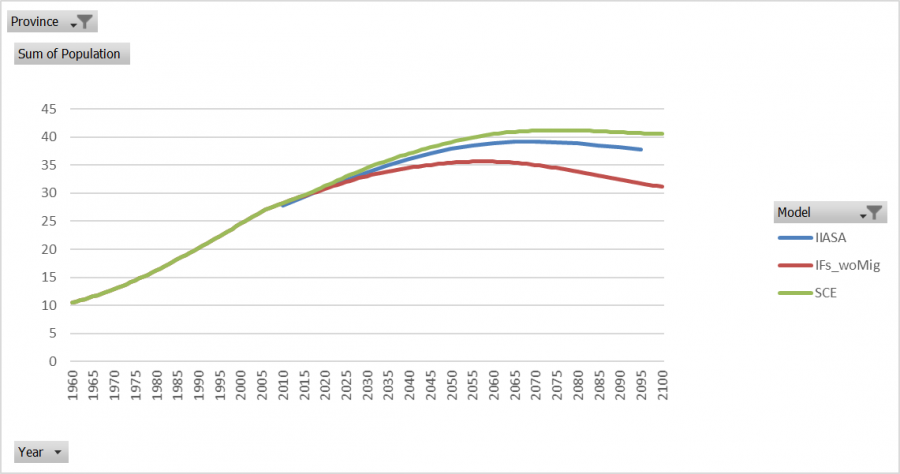
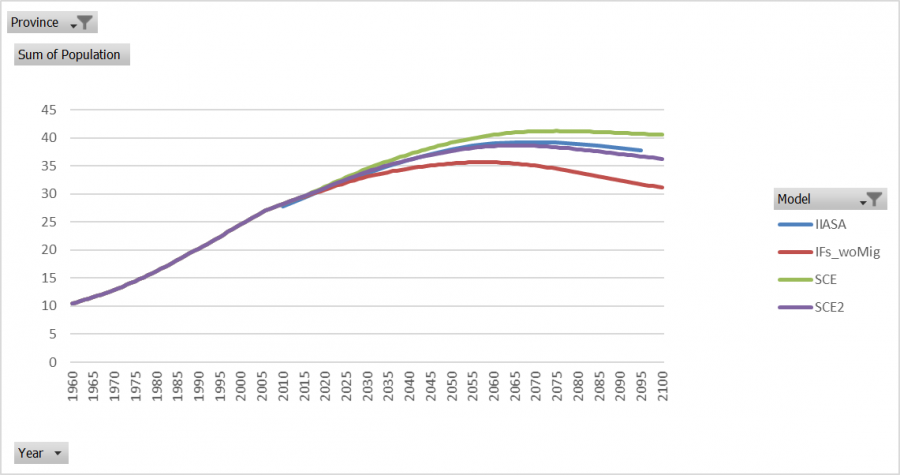
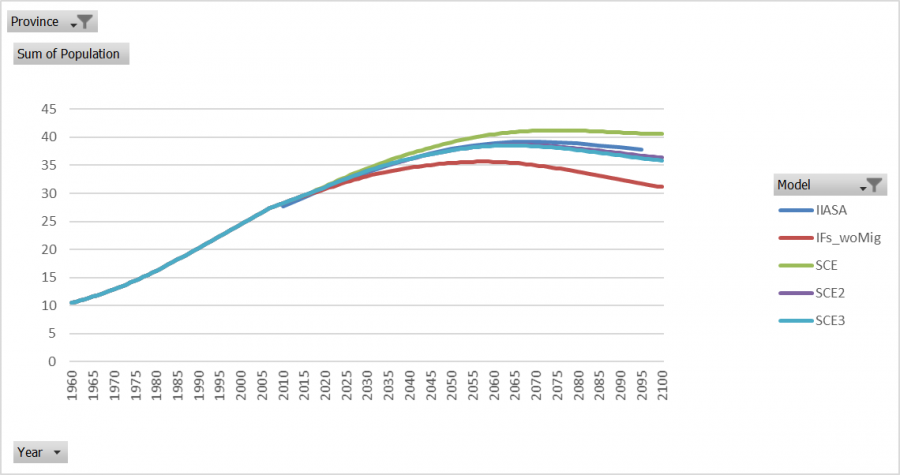
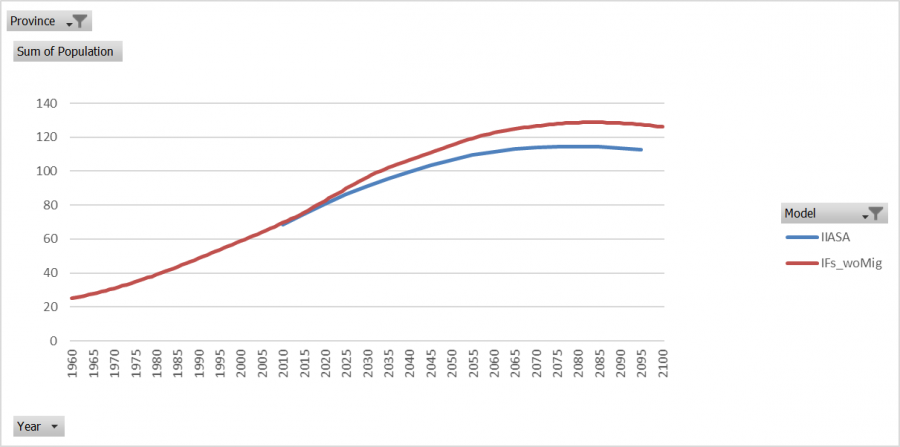
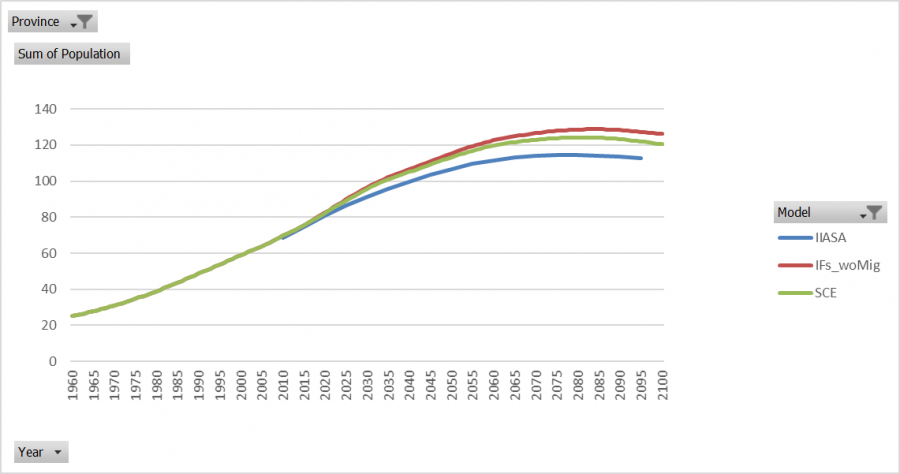
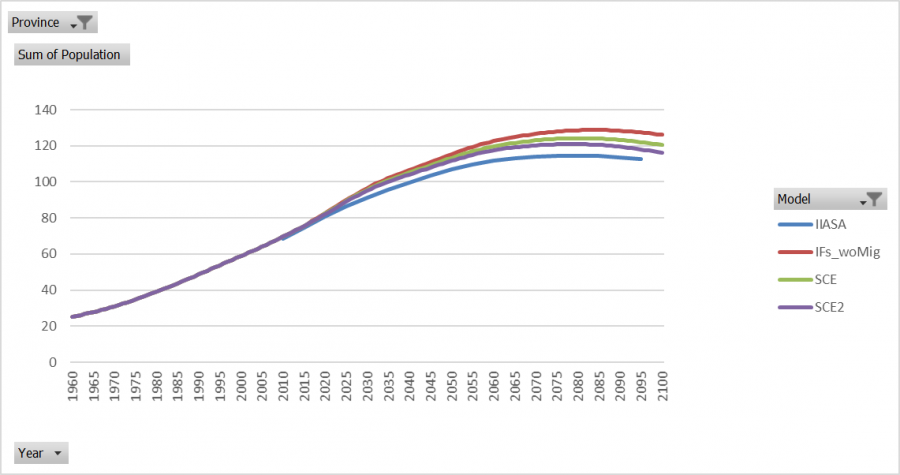
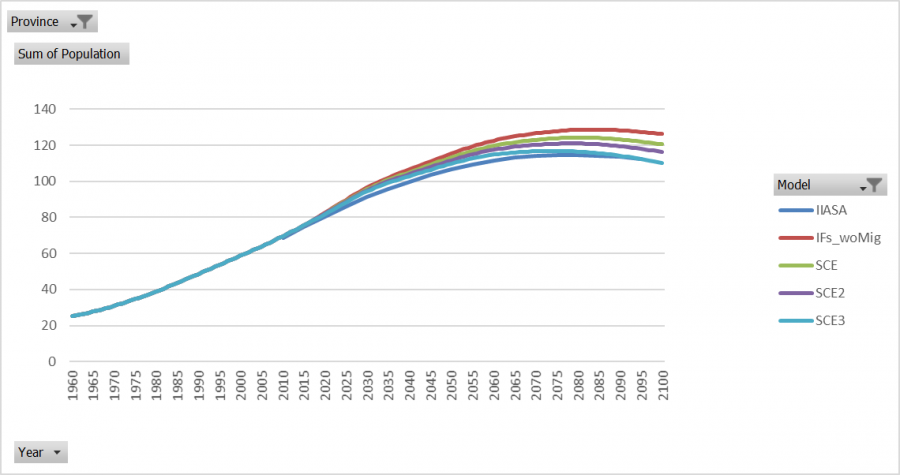
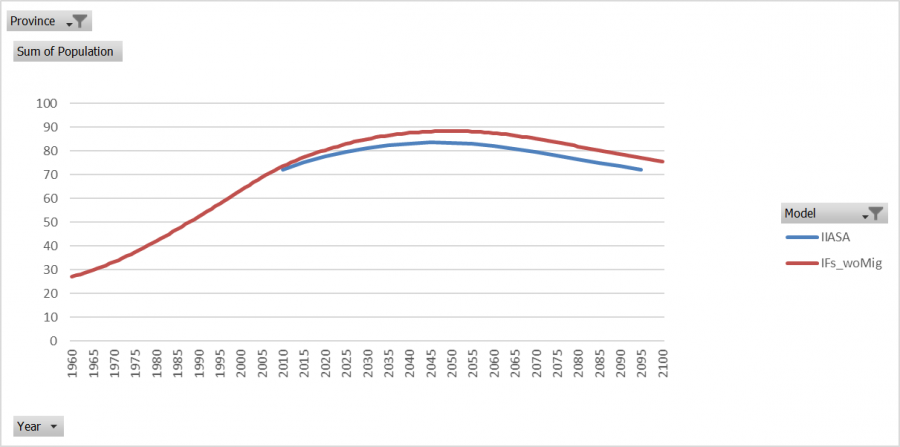
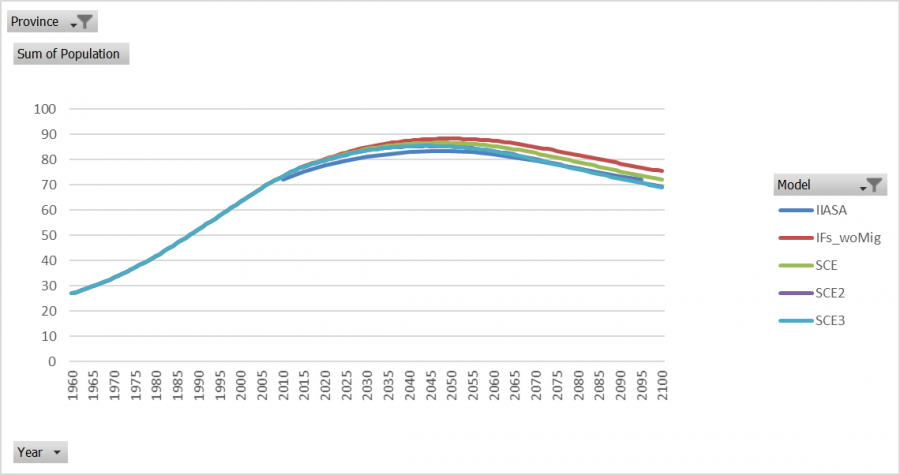
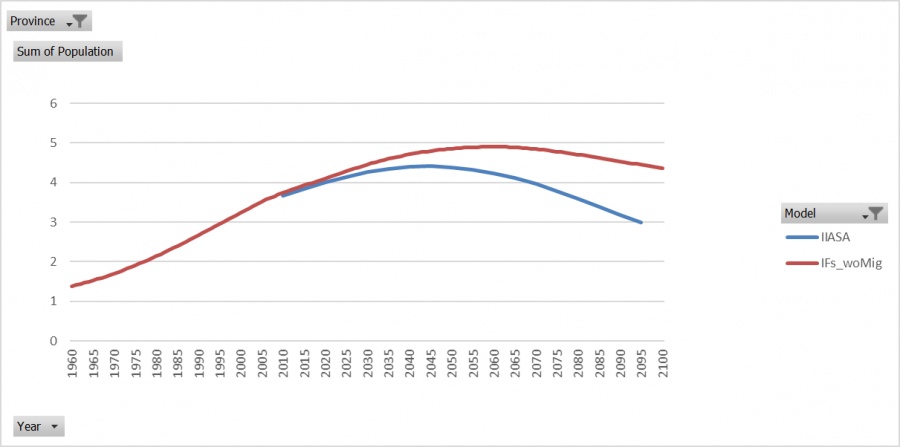
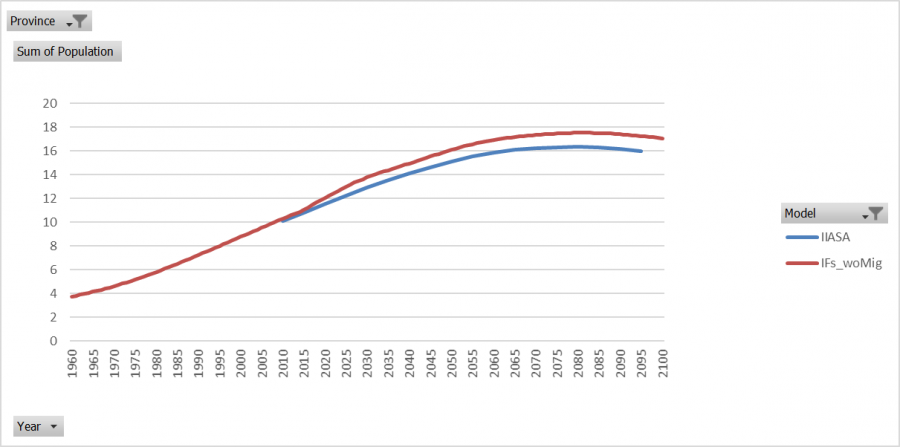
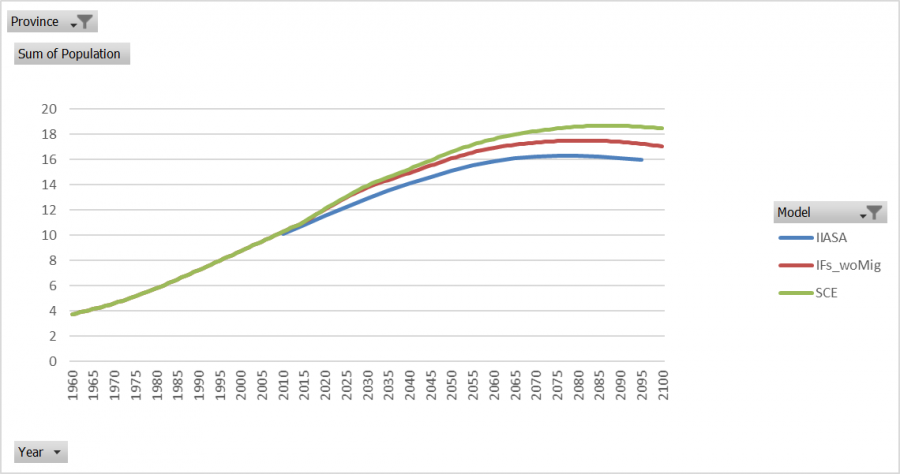
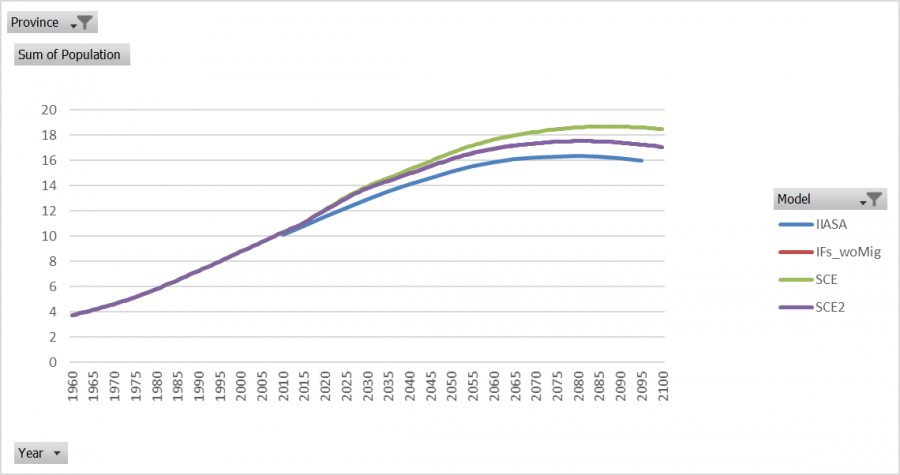
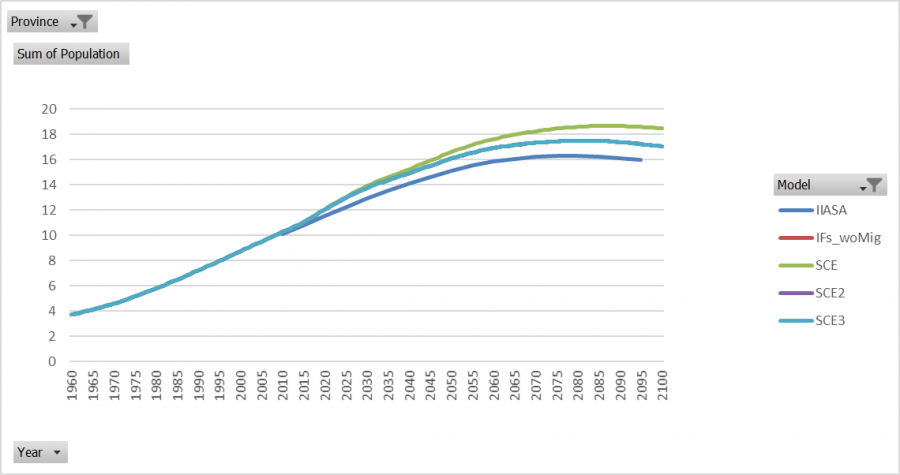
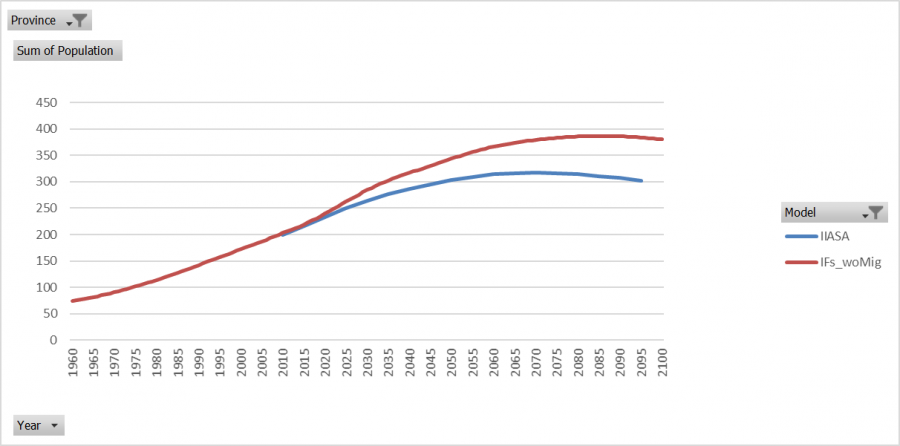
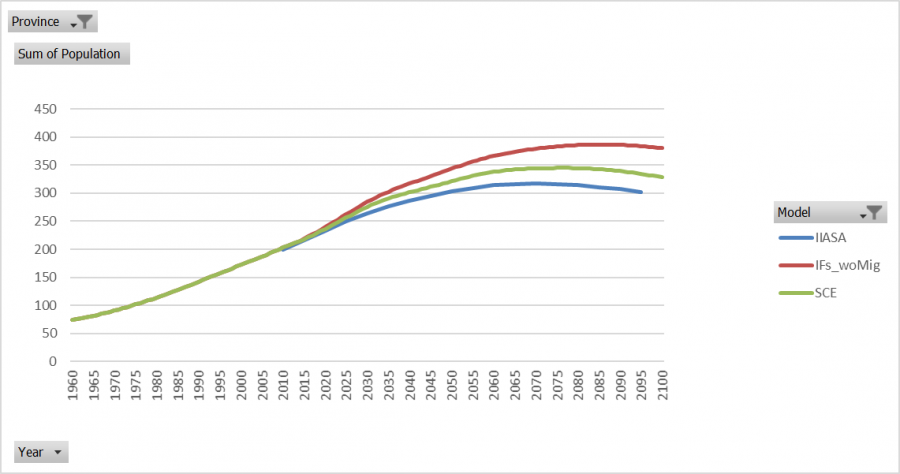
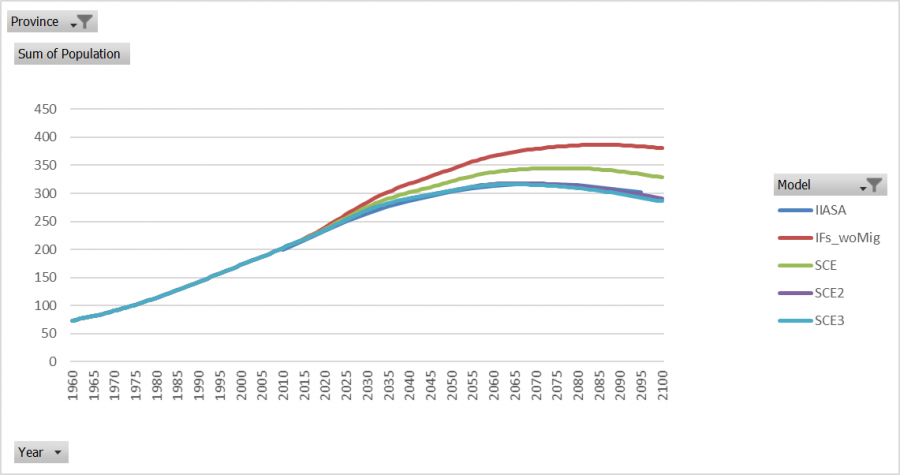
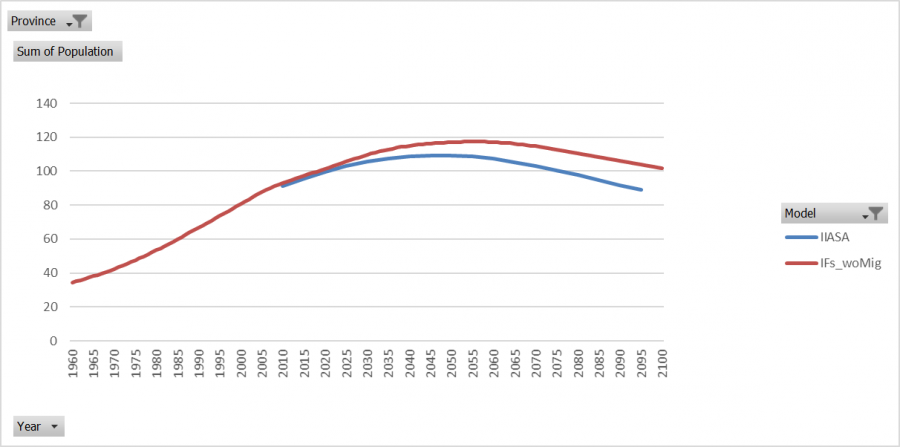
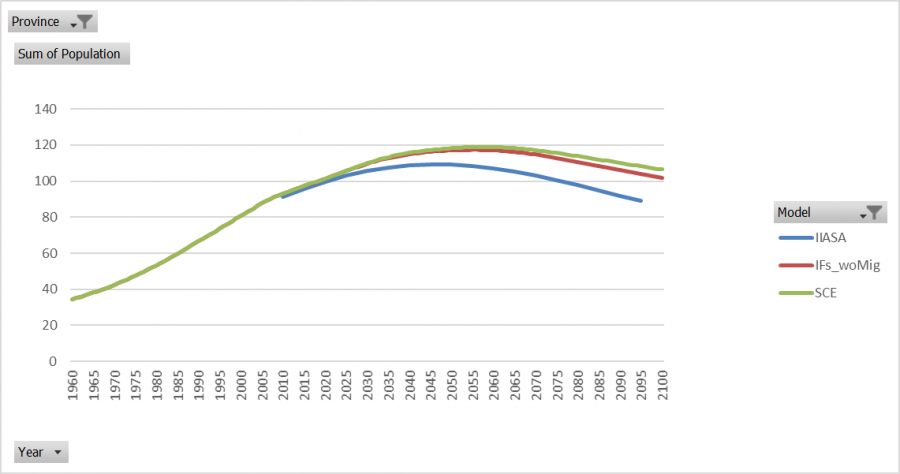
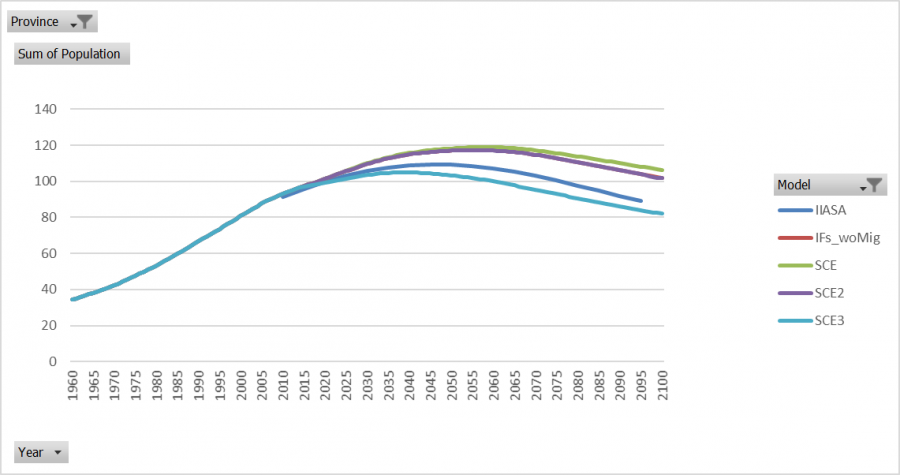
Below is a graph of the population sum of the states and terrritories for IIASA, IFs without migration, and the three IFs migration scenarios. These are all compared to the 186 version of IFs. As shown below, IFs without migration and IFs migration scenario 1 are significantly higher than the other population models. IIASA's subnational model's population summed is almost identical to IFs' 186 model. Migration scenario 2 is in between the two models. The third and final migration scenario is the closest to IIASA and the 186 version of IFs. The third migration scenario has about 19 million more people than the 186 version of IFs in 2100, where as the second scenario has about 78 million more people and the first migration scenario has about 172 million more people. | |||
[[File:IndiaPopRolledSCE3.png|900px|IndiaPopRolledSCE3.png]] | |||
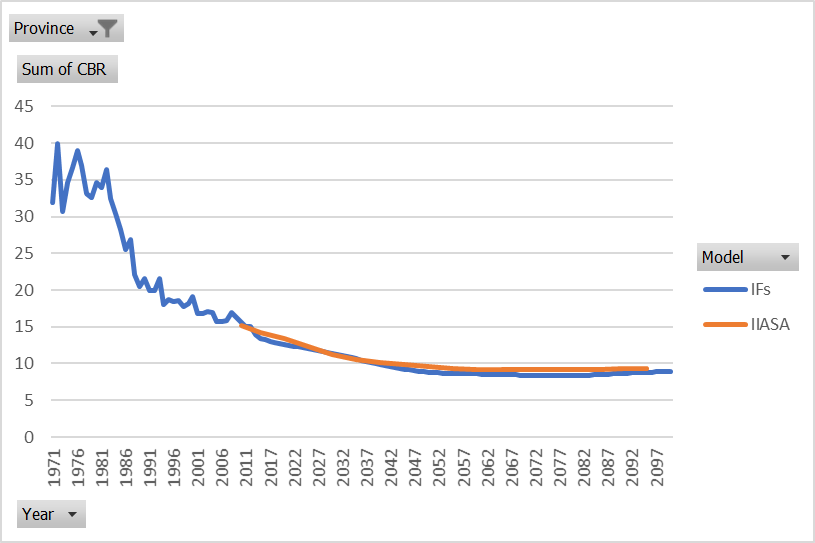
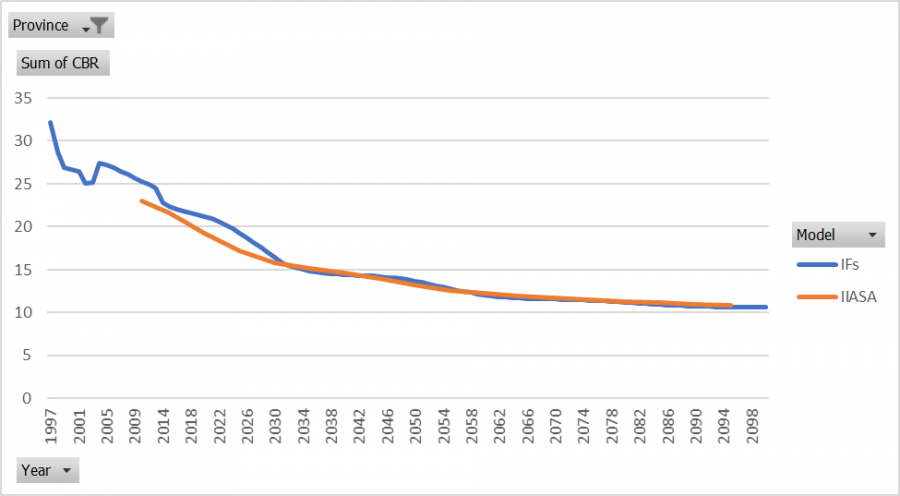
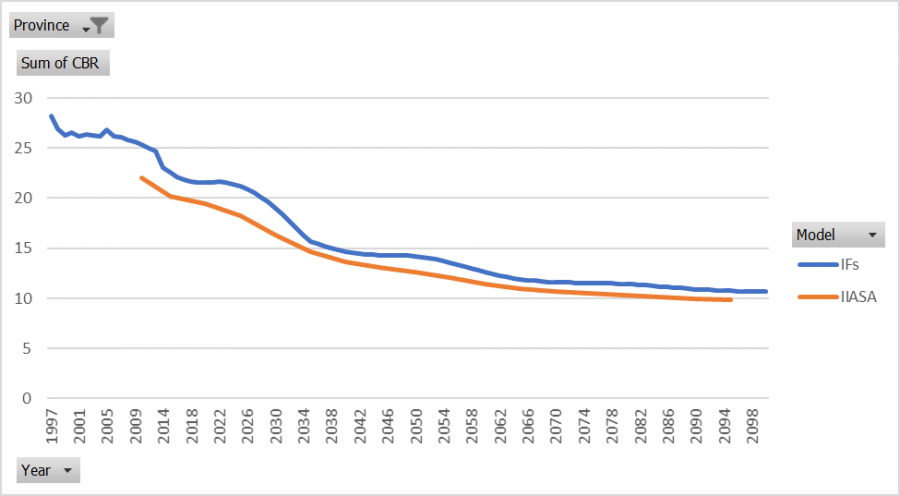
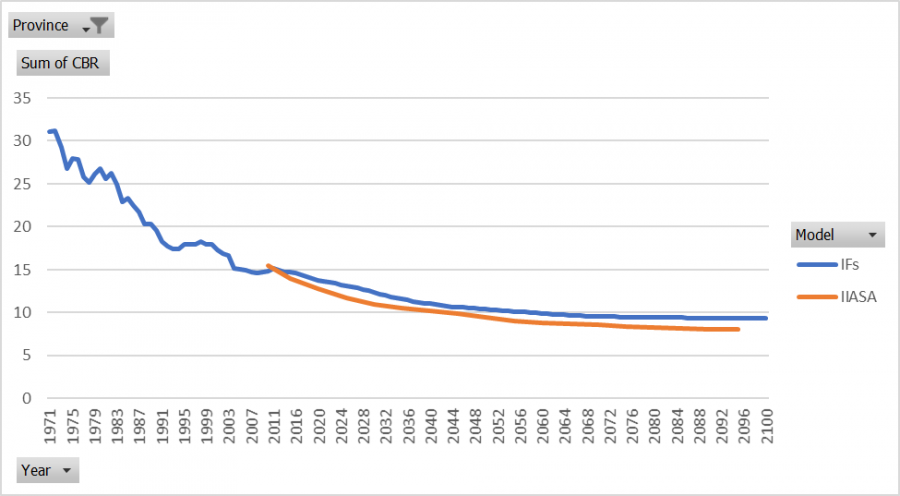
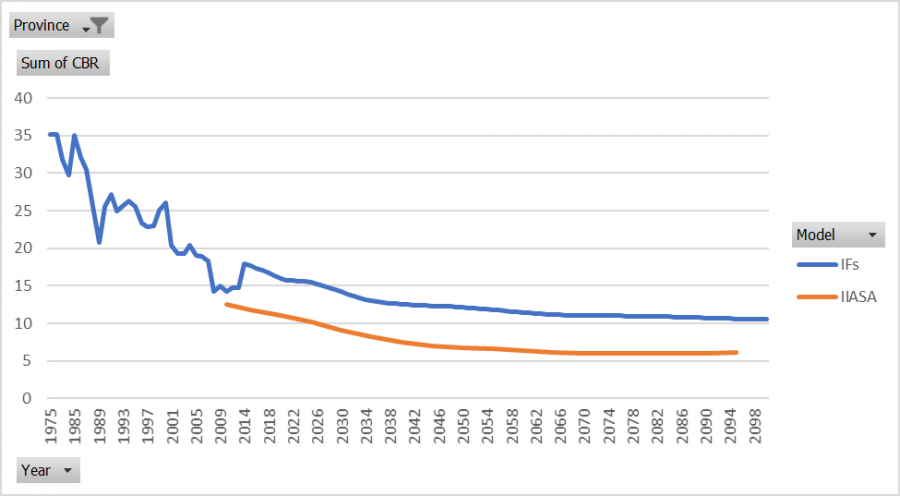
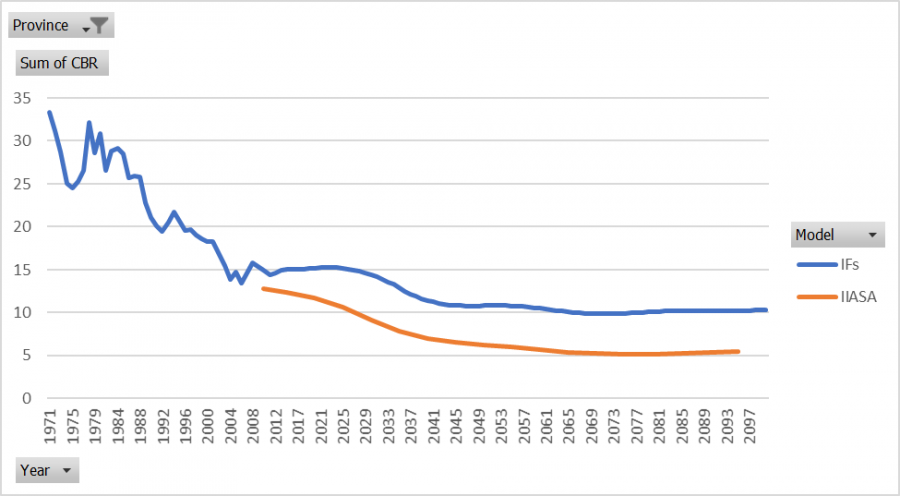
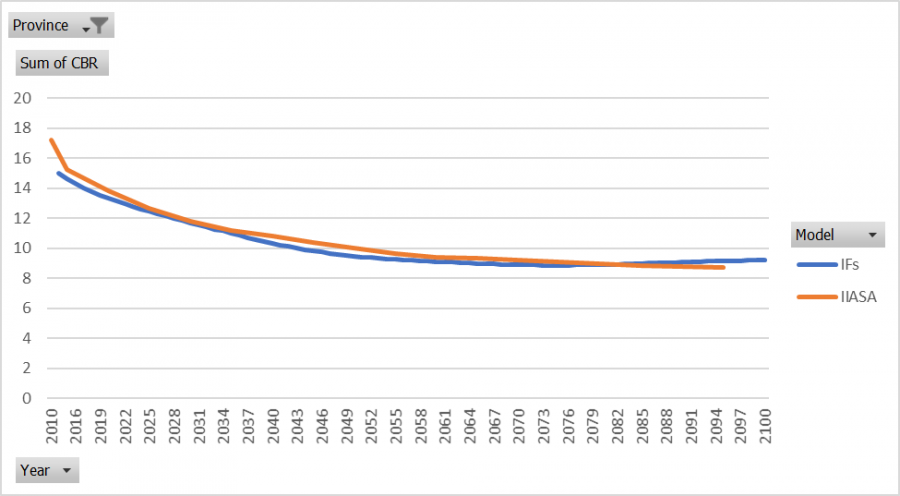
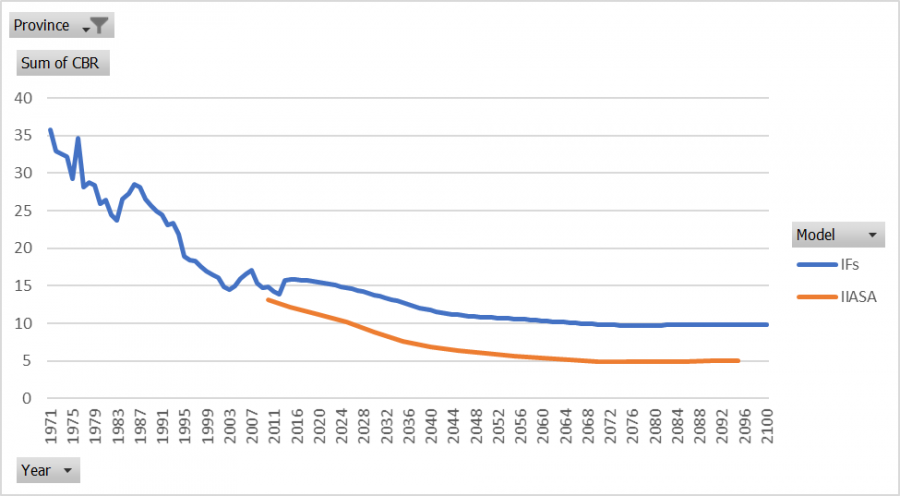
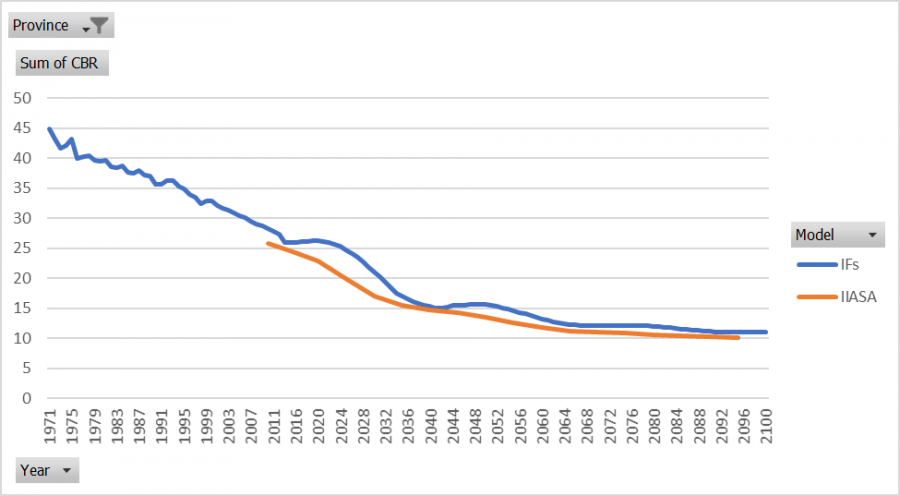
==== Crude Birth Rates ==== | |||
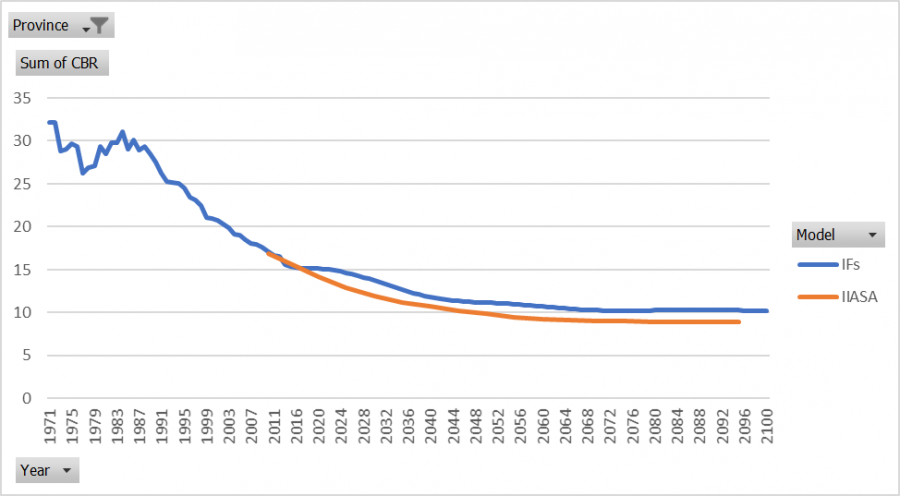
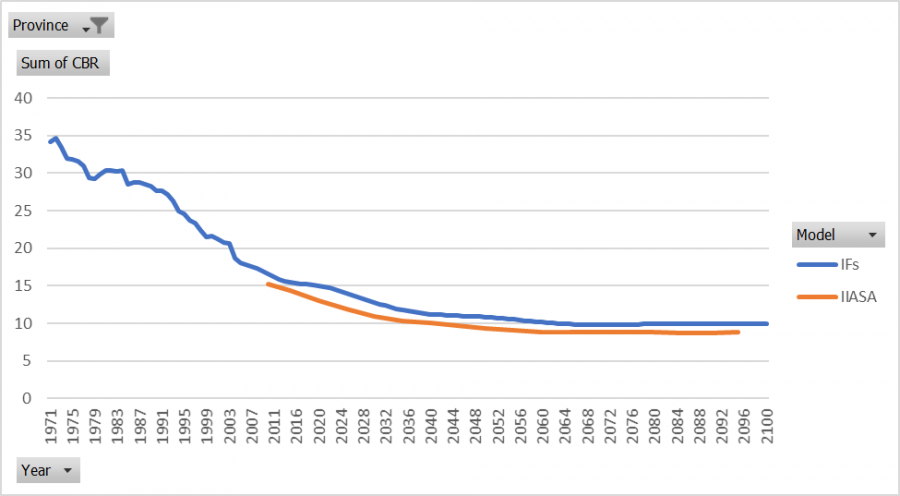
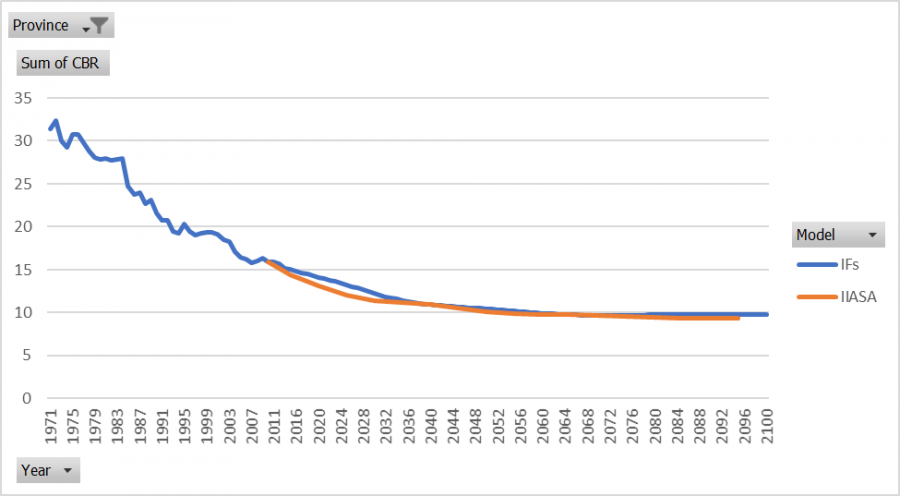
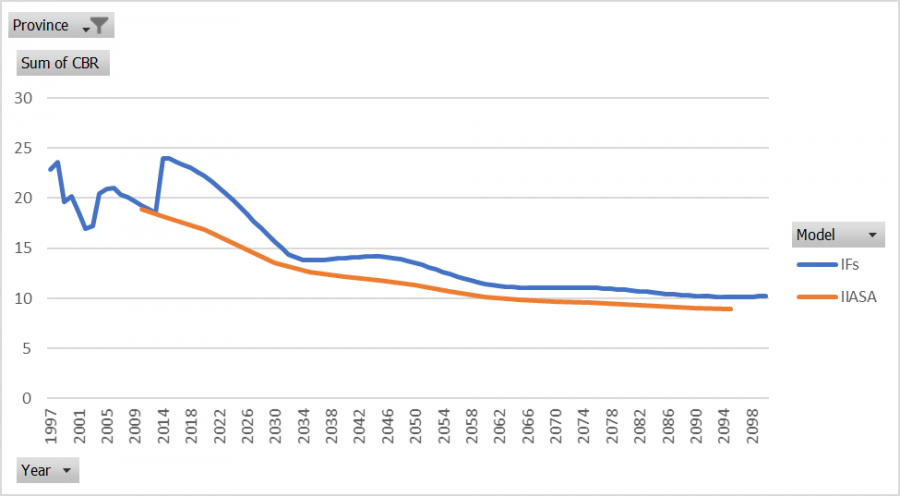
[[File:IndiaCBRIIASASCE3.png|900px|IndiaCBRIIASASCE3.png]] | |||
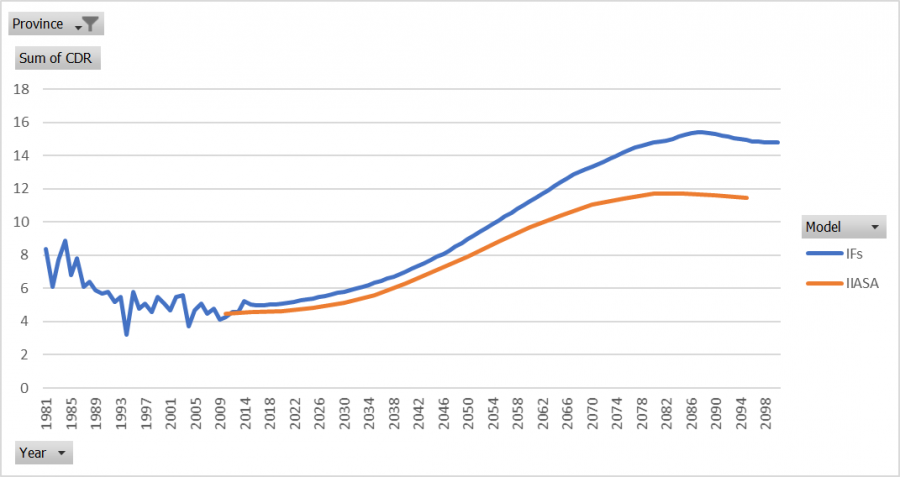
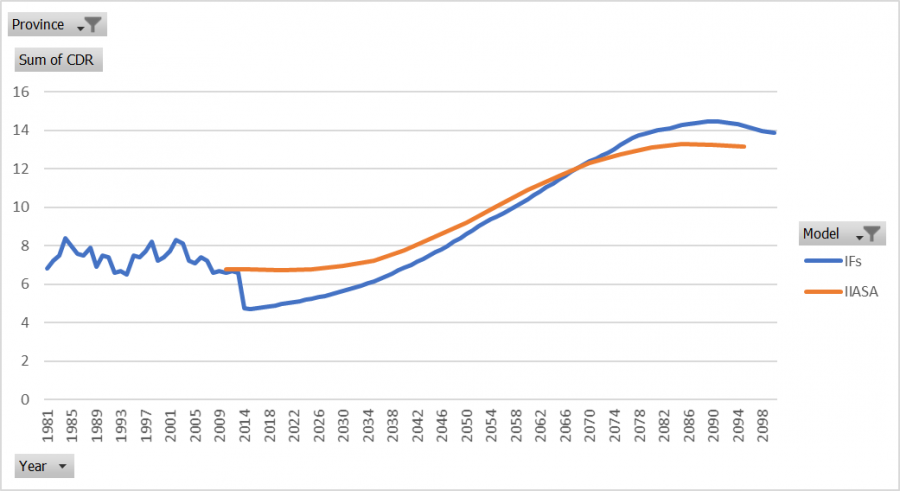
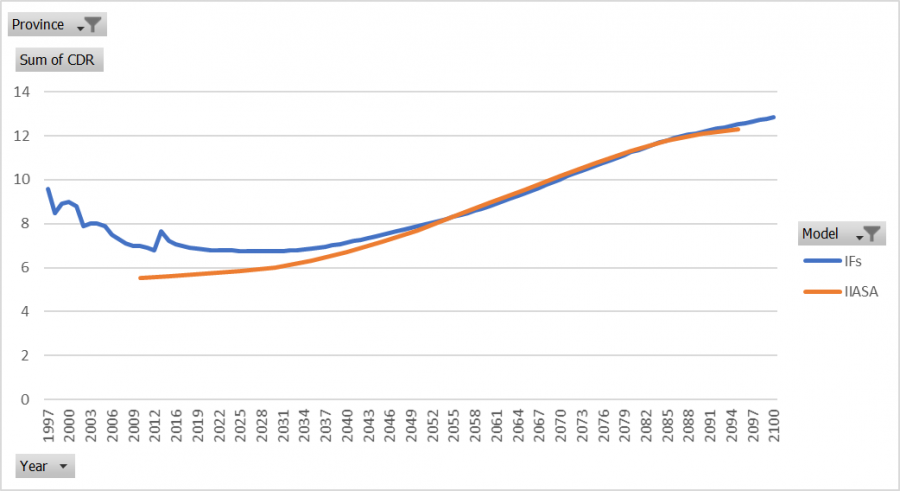
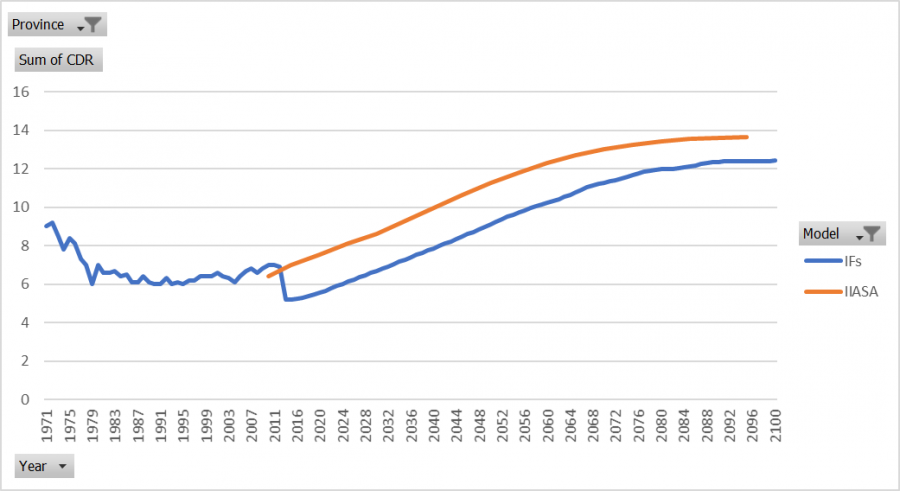
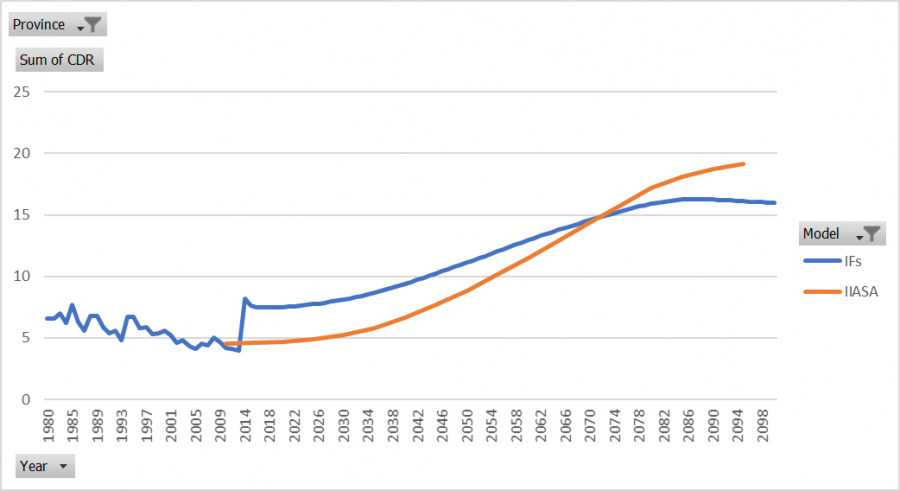
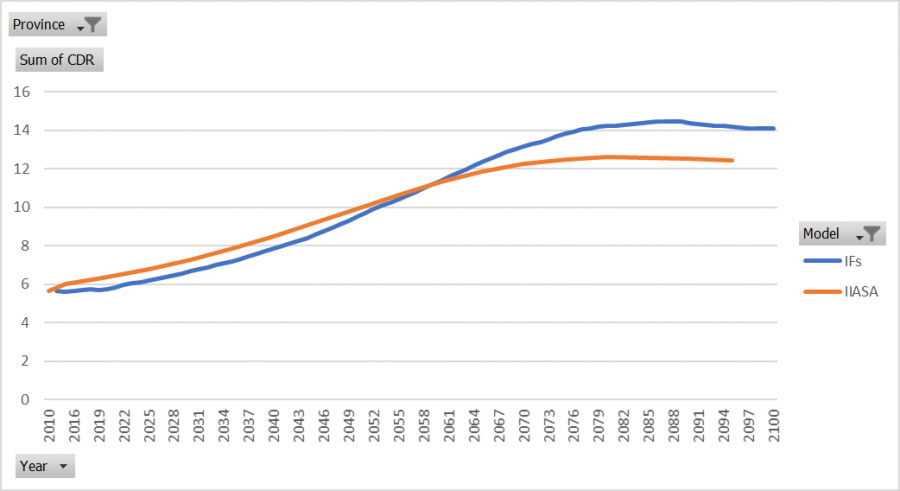
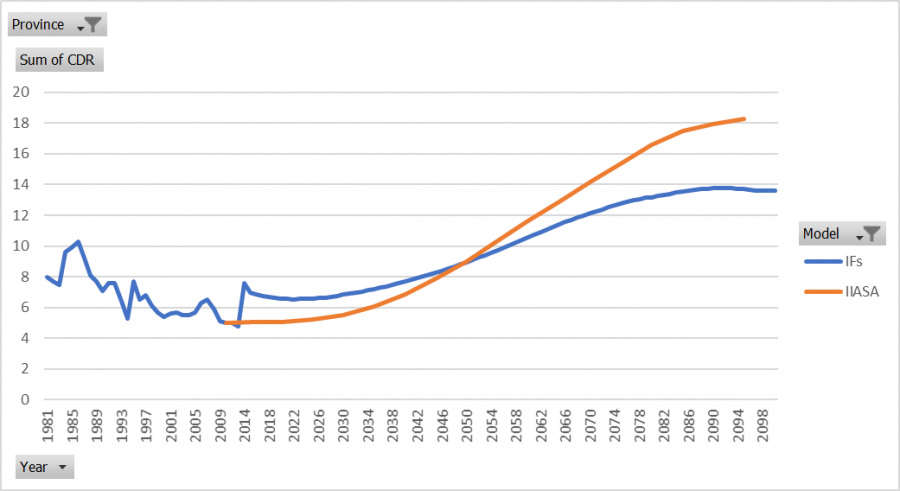
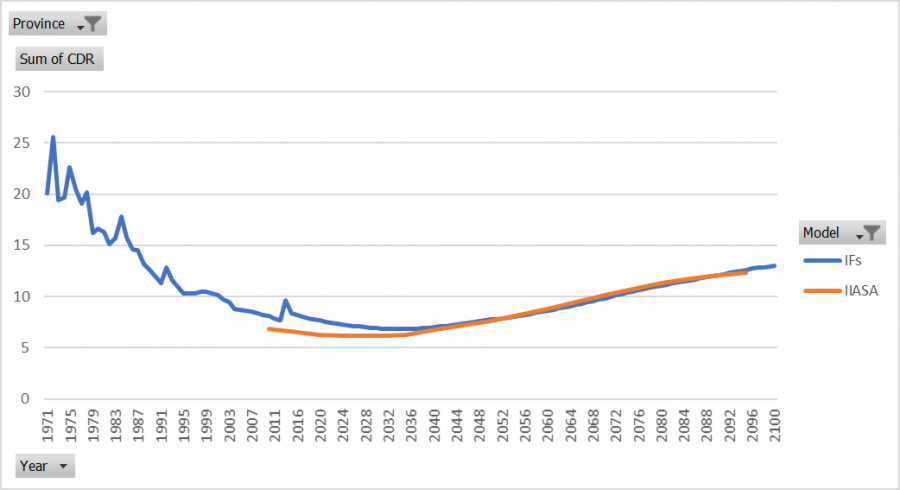
==== Crude Death Rates ==== | |||
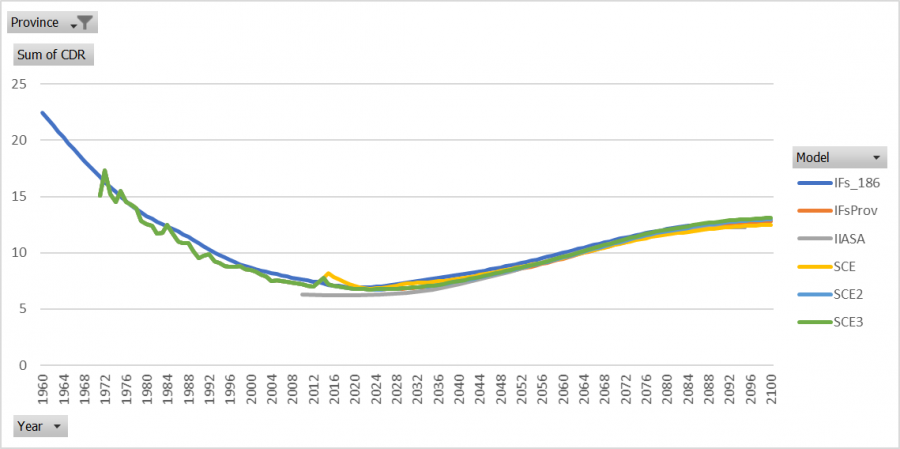
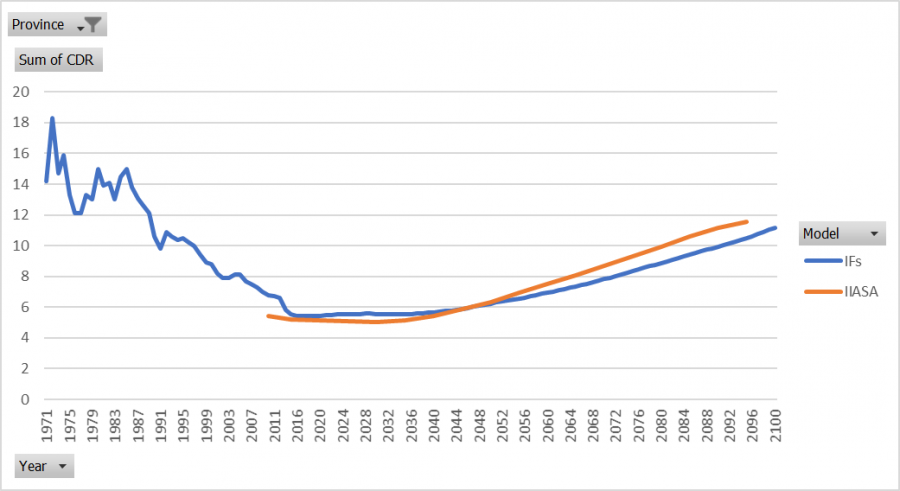
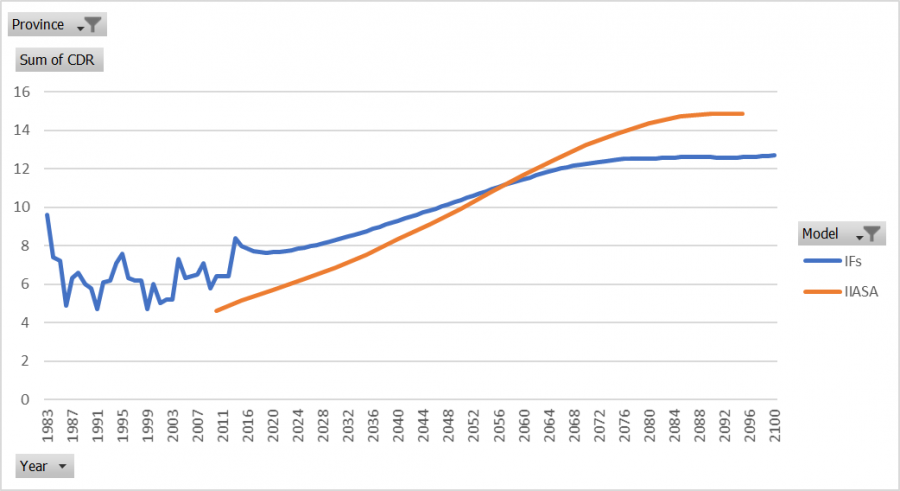
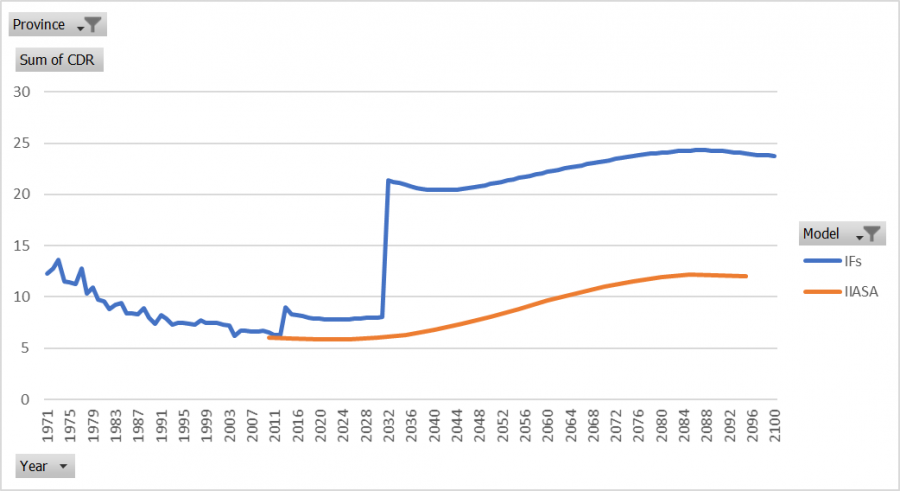
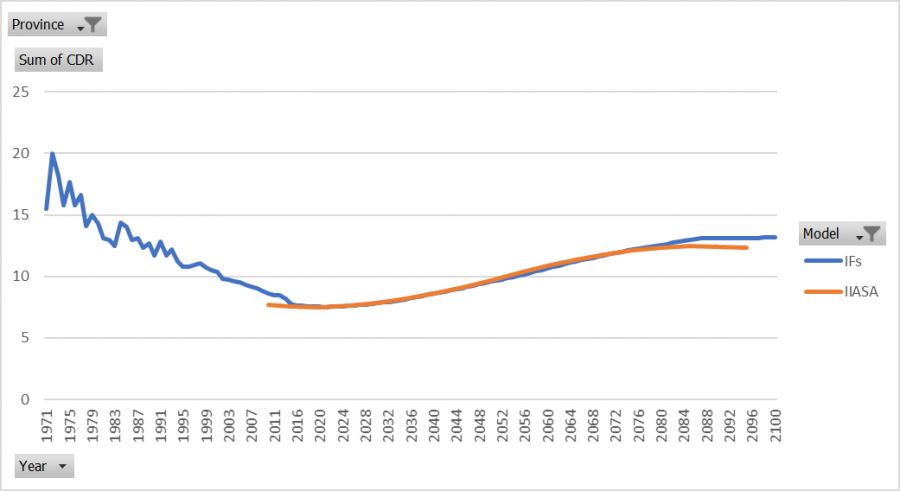
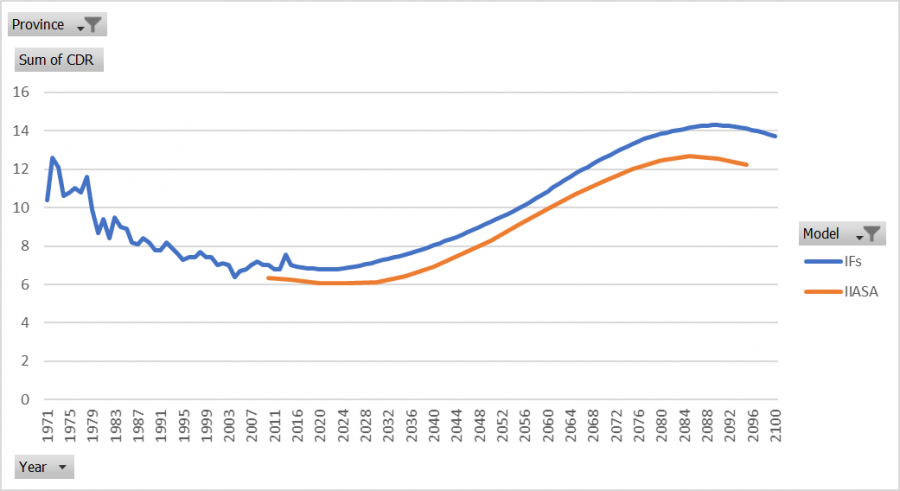
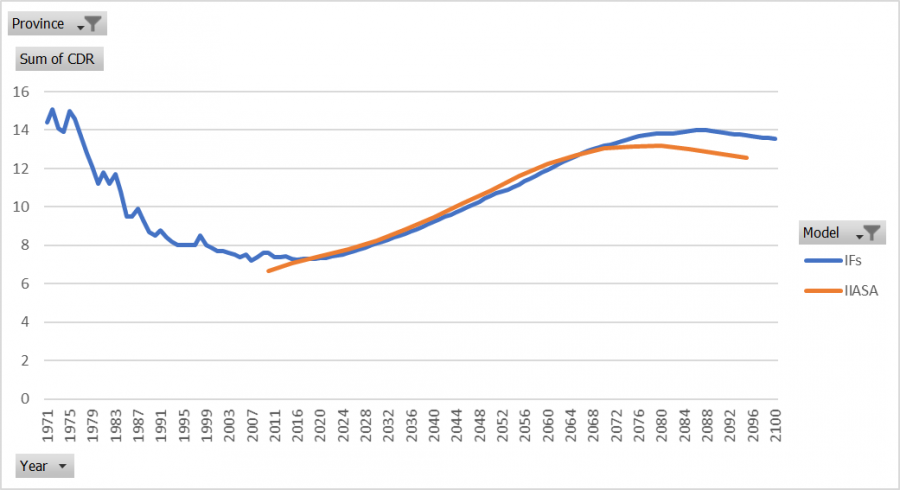
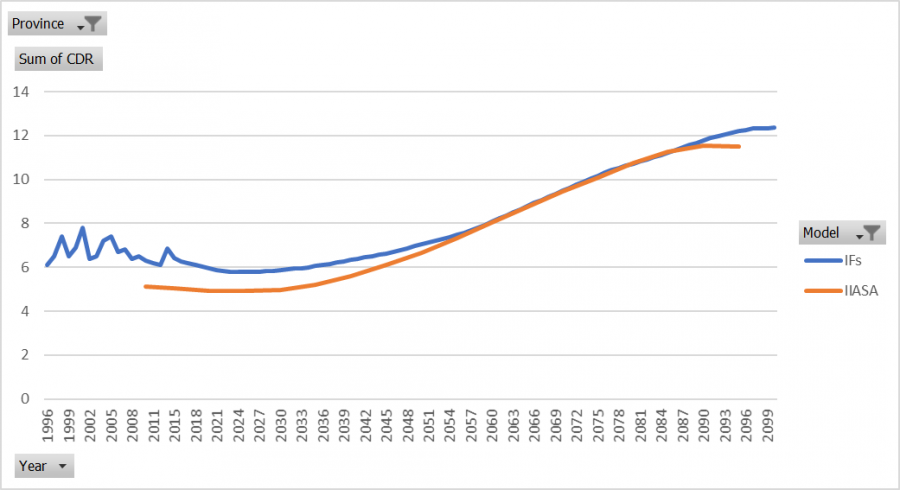
[[File:IndiaCDRSce3.png|900px|IndiaCDRSce3.png]] | |||
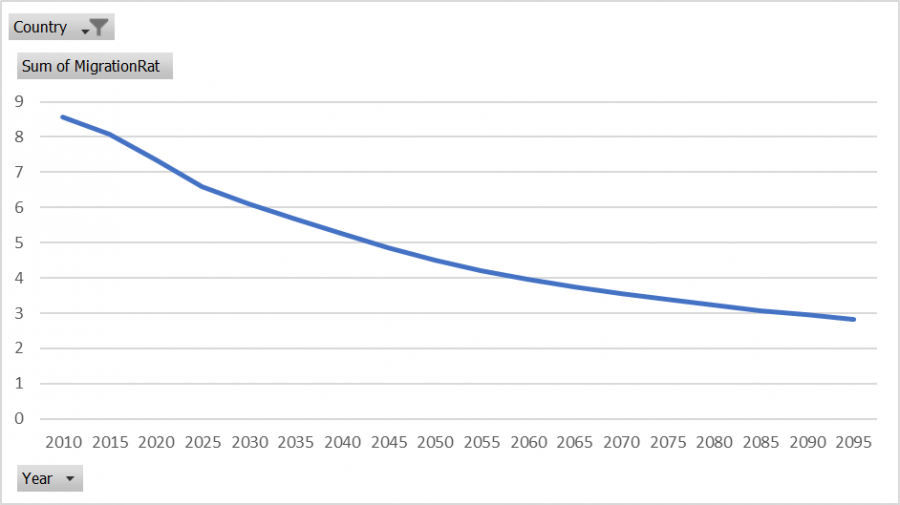
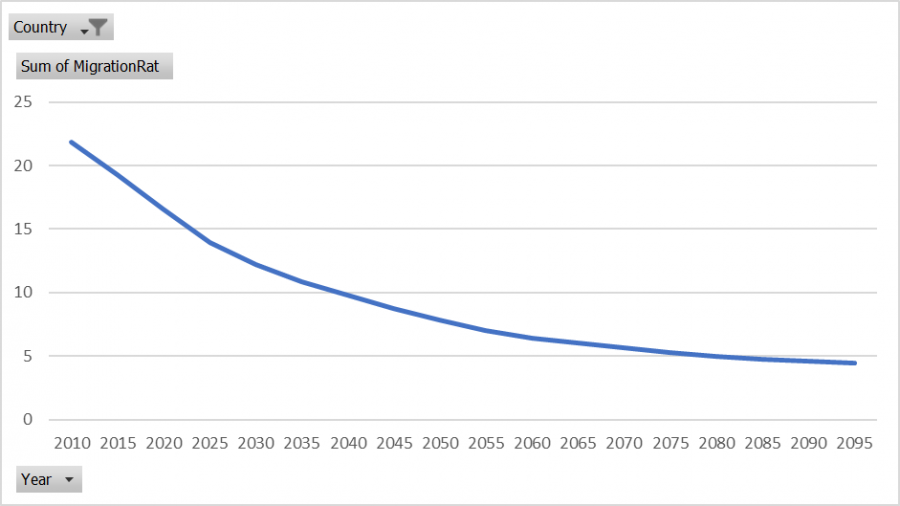
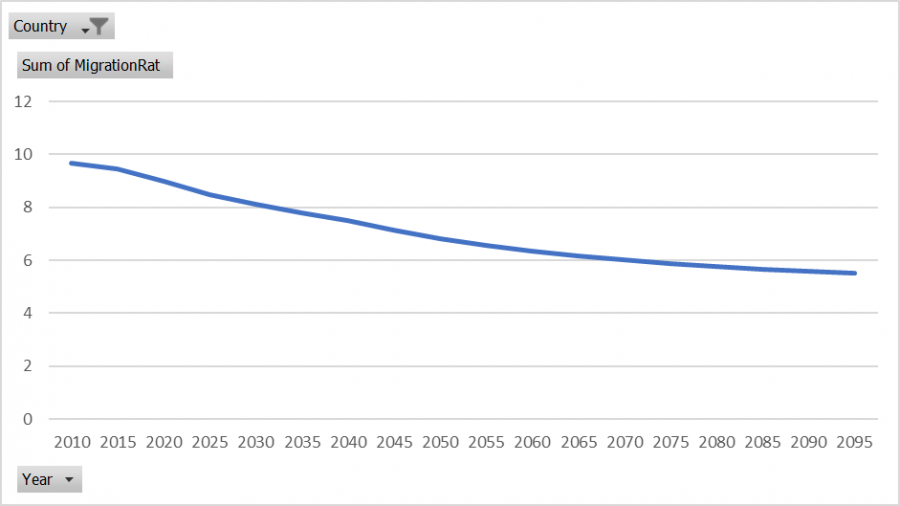
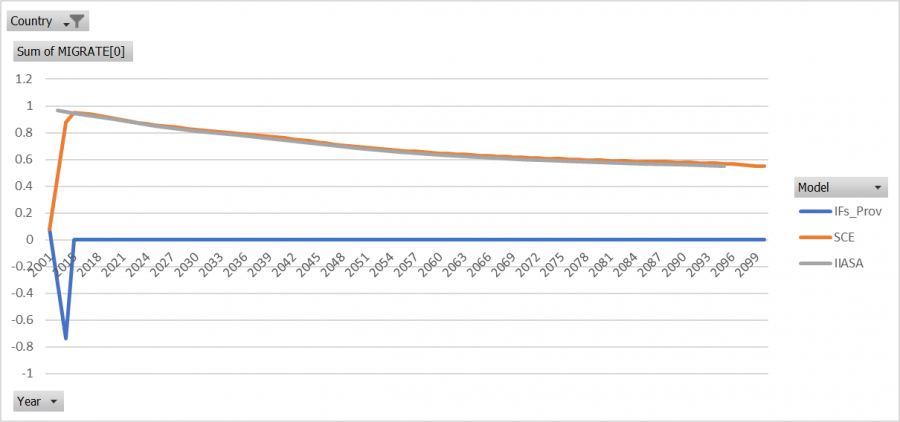
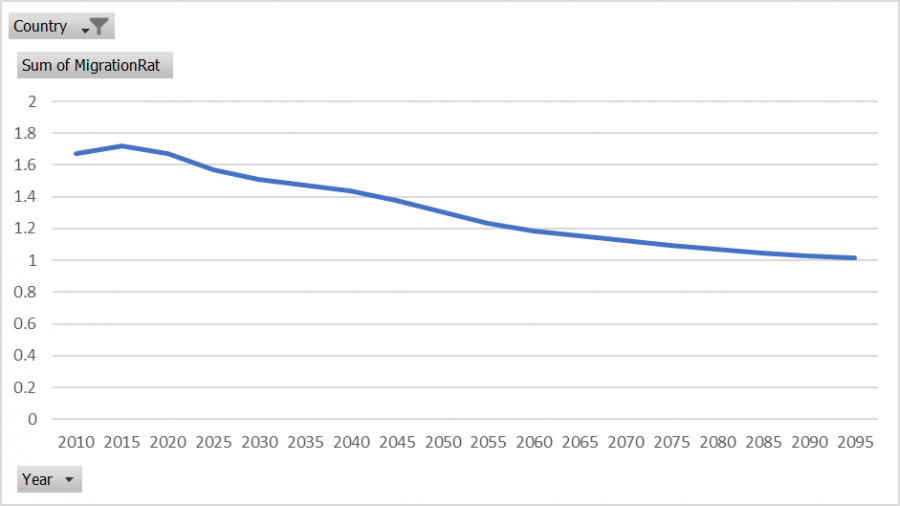
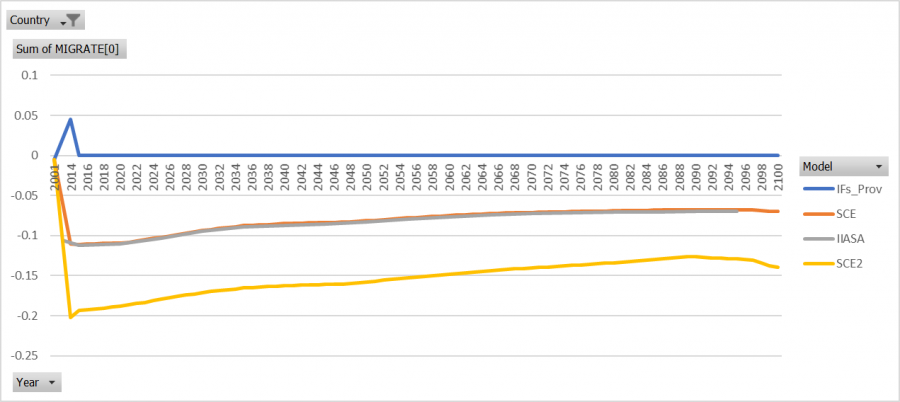
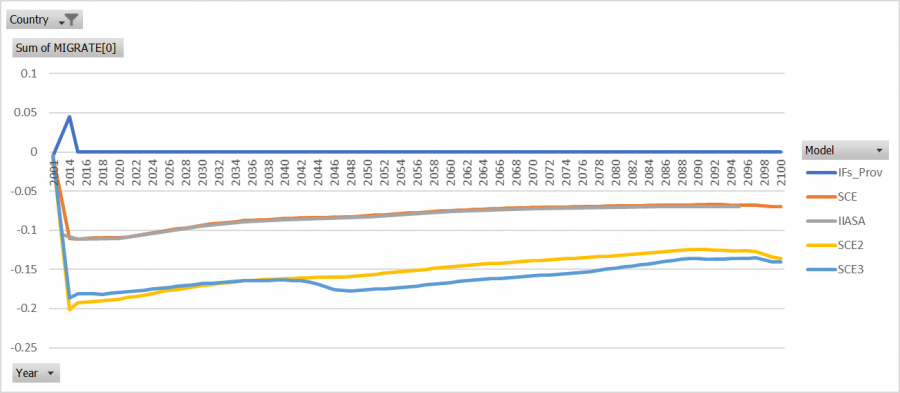
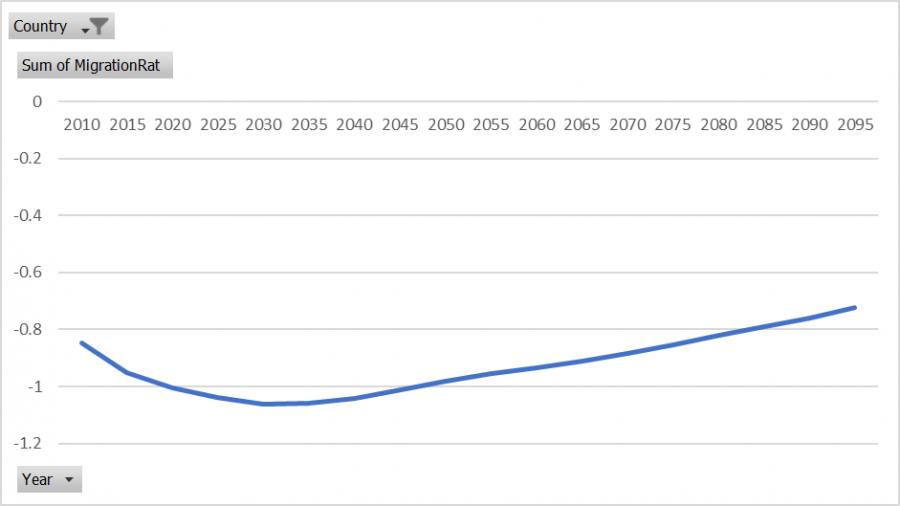
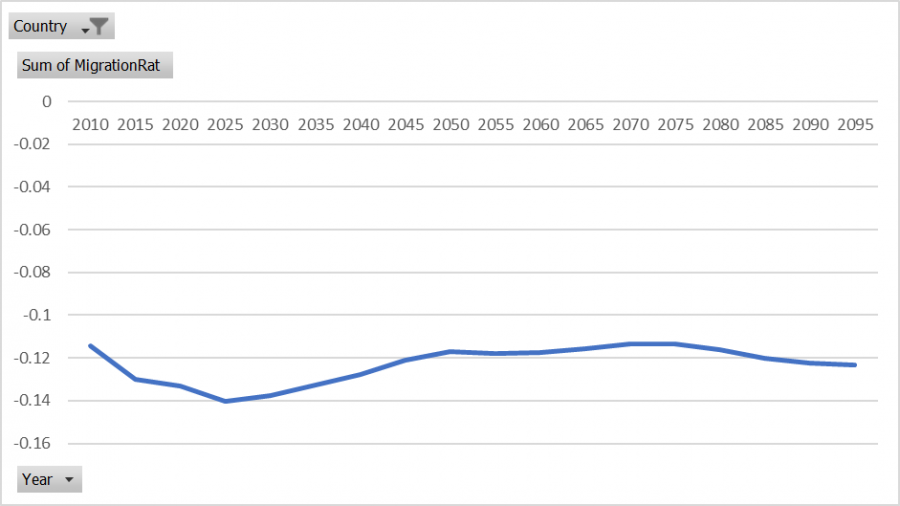
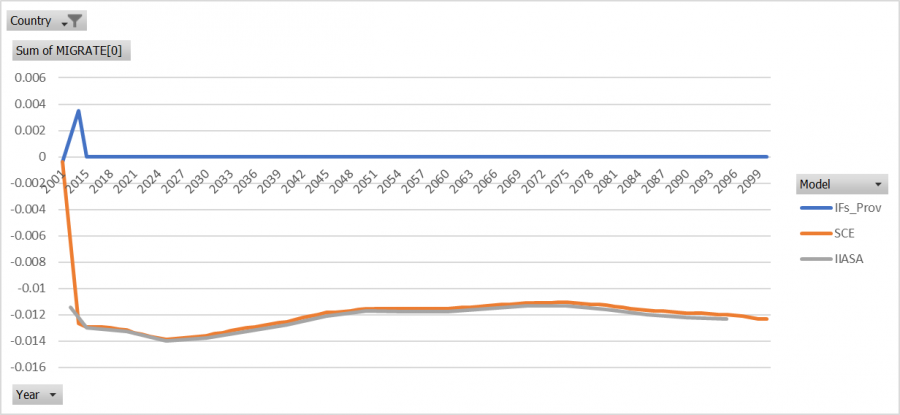
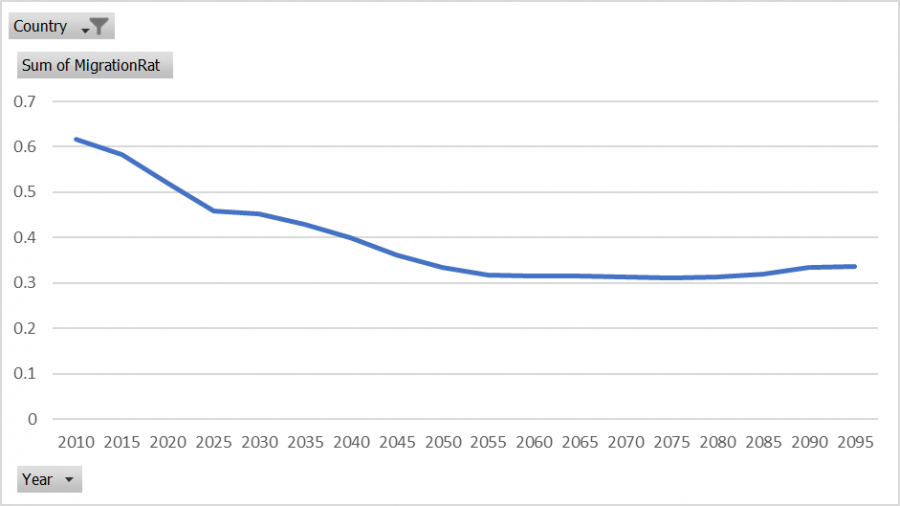
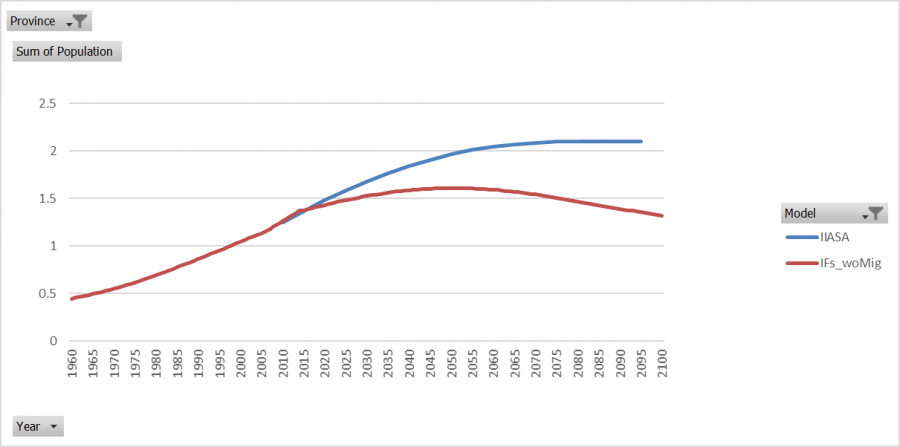
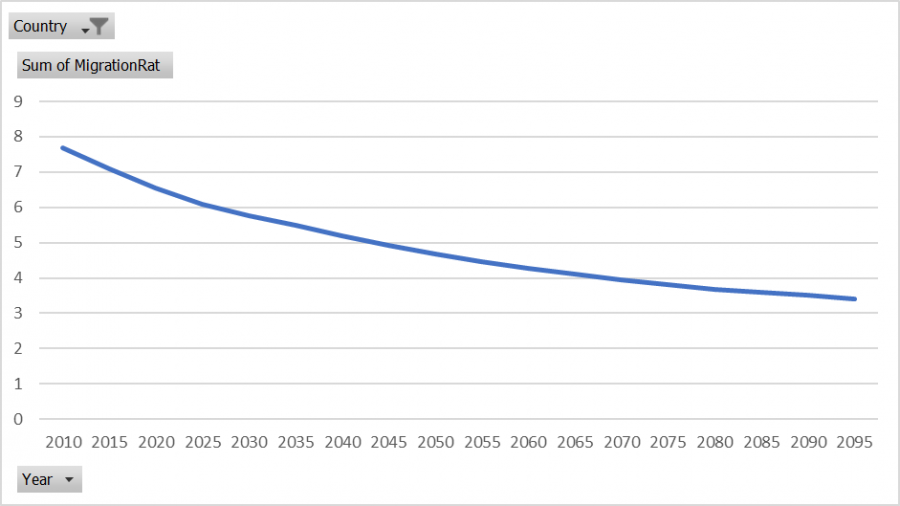
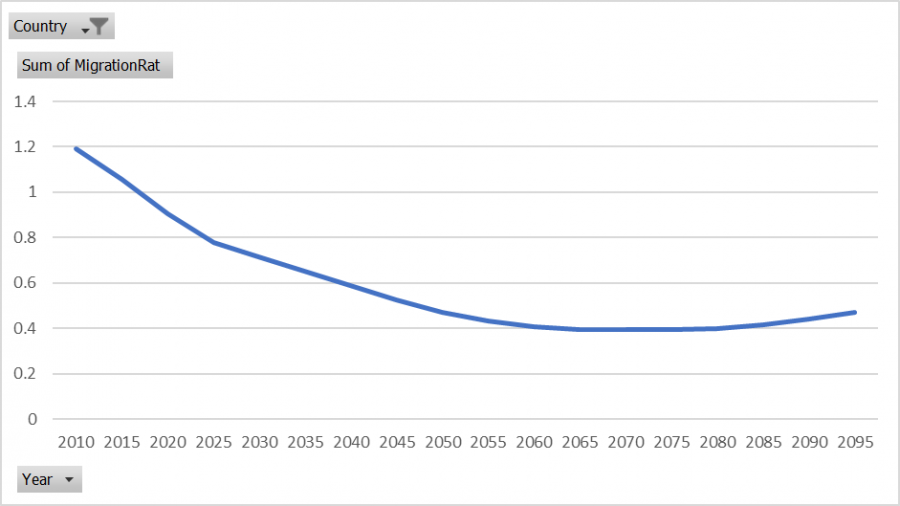
==== Migration Rates ==== | |||
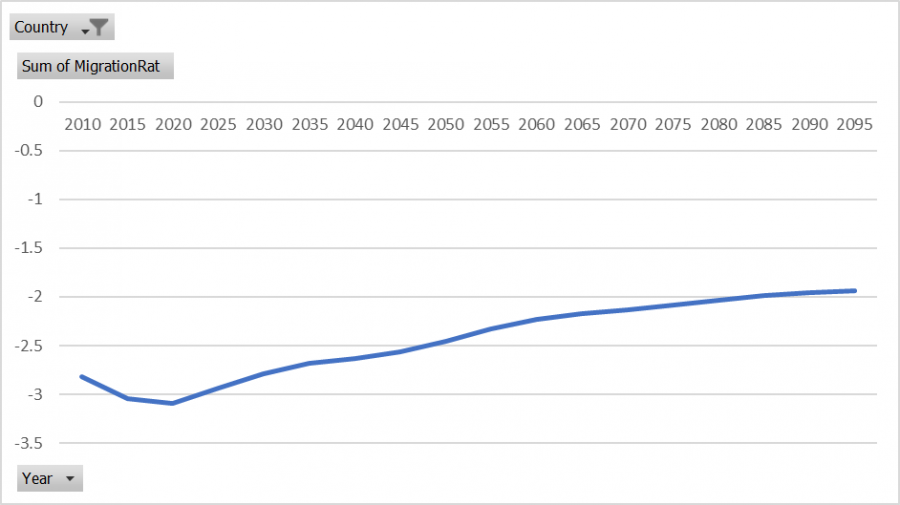
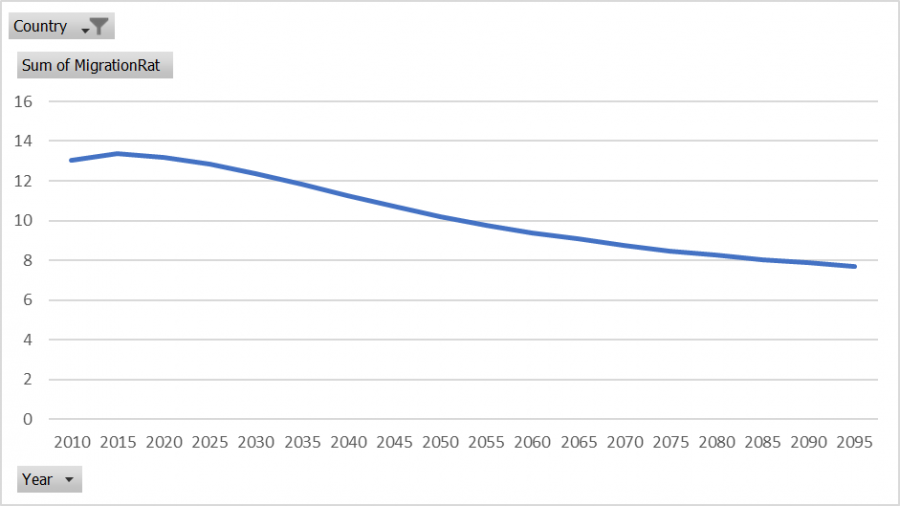
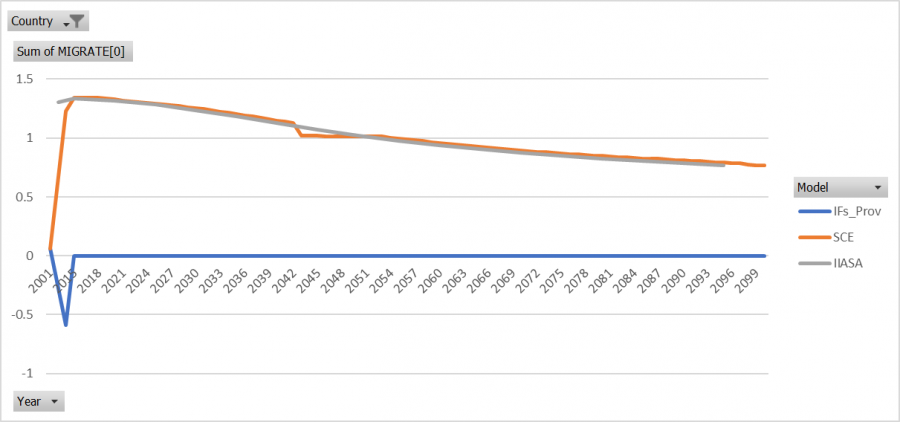
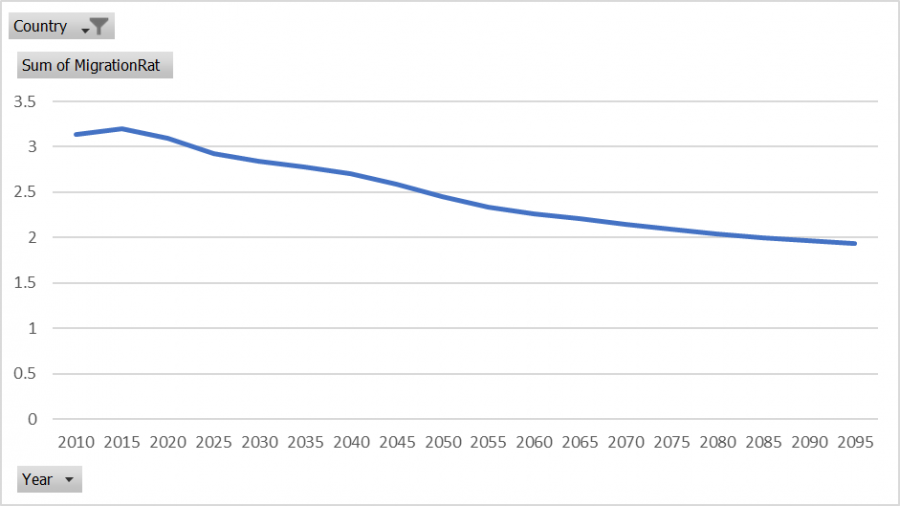
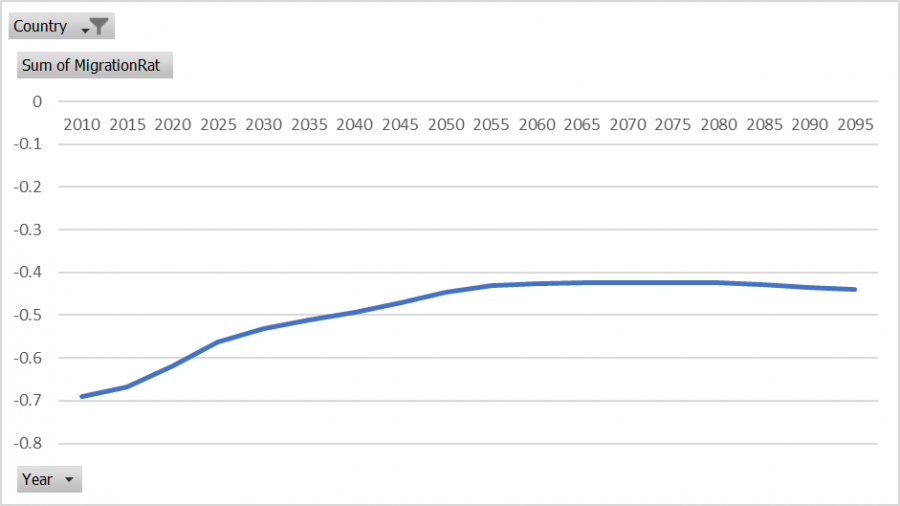
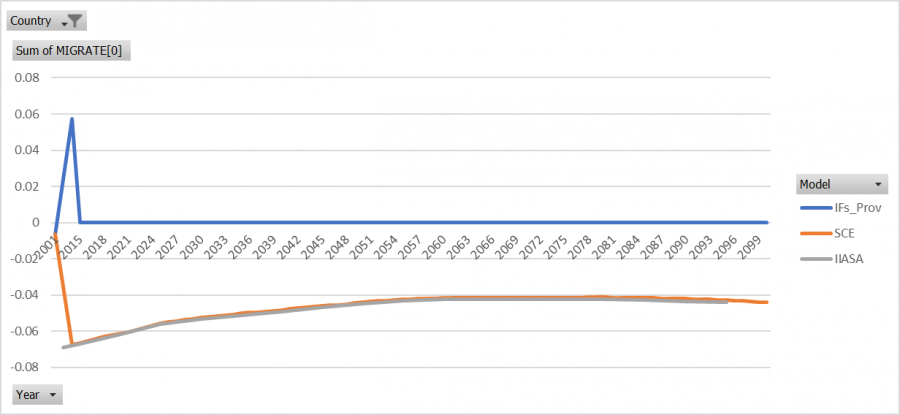
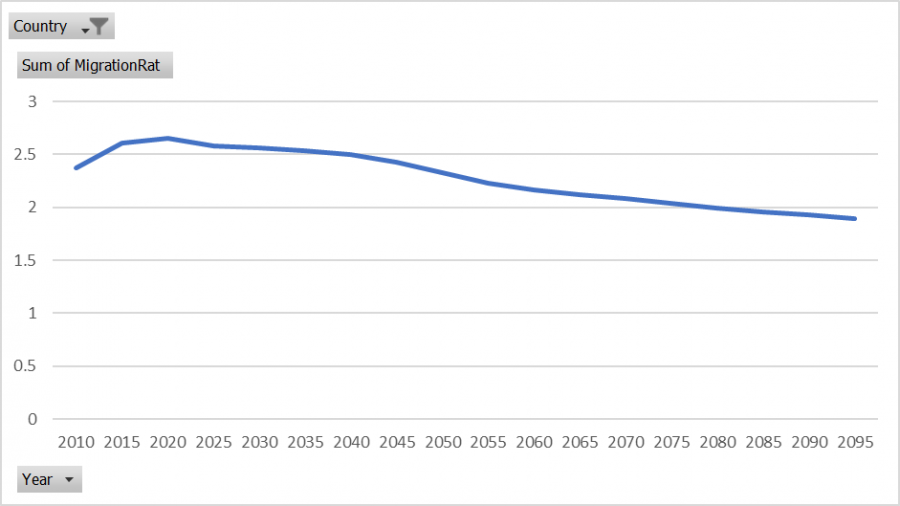
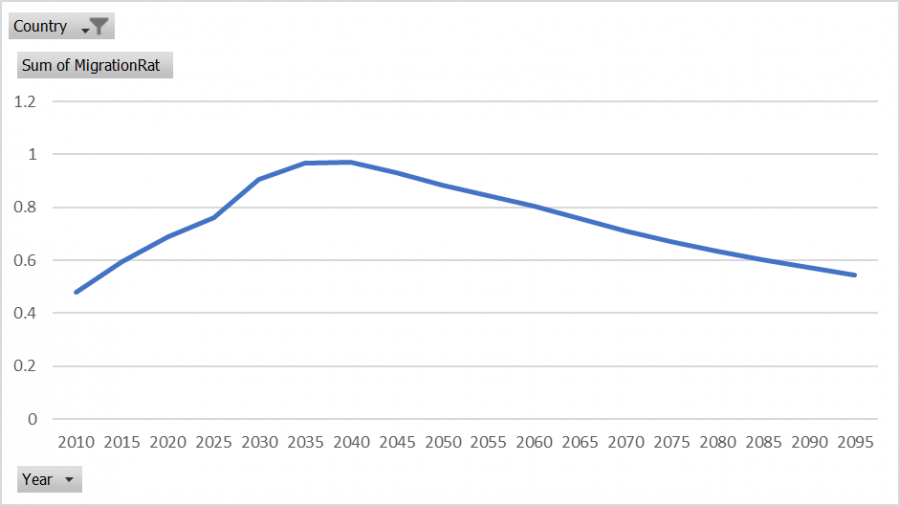
[[File:IndiaMigRateIIASASCE3.png|900px|IndiaMigRateIIASASCE3.png]] | |||
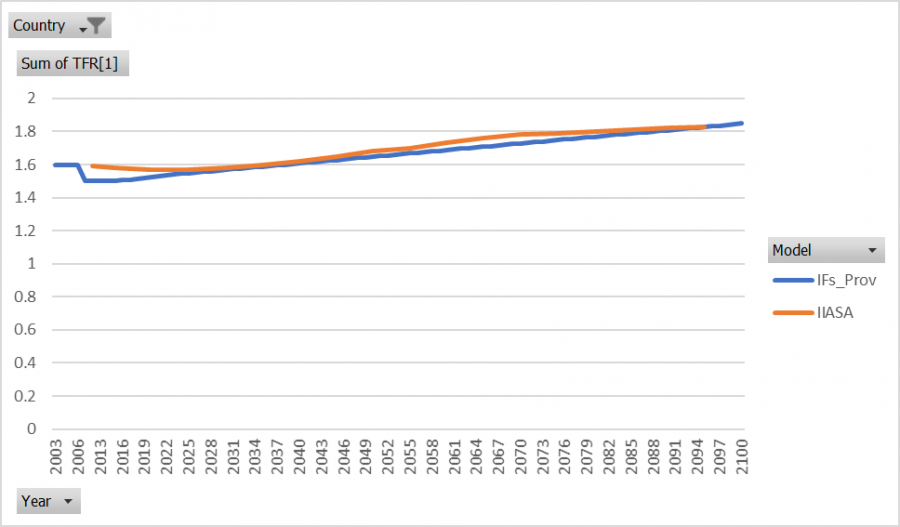
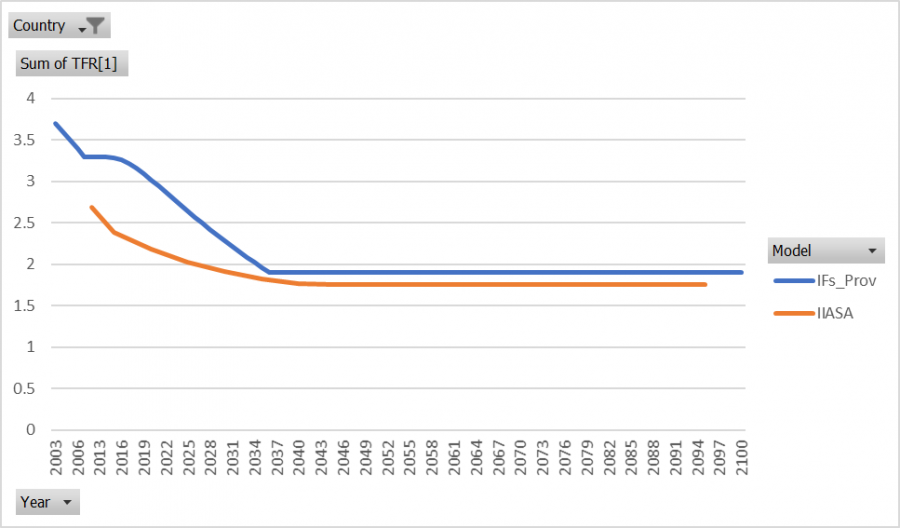
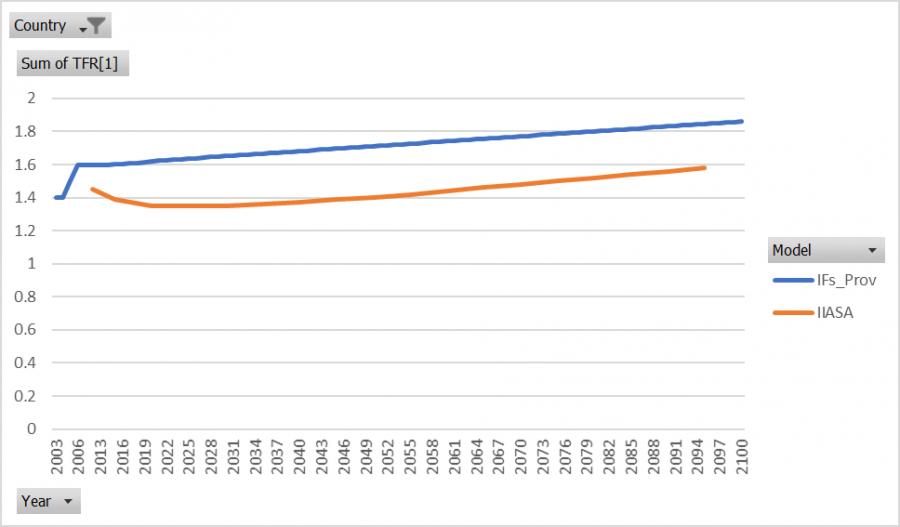
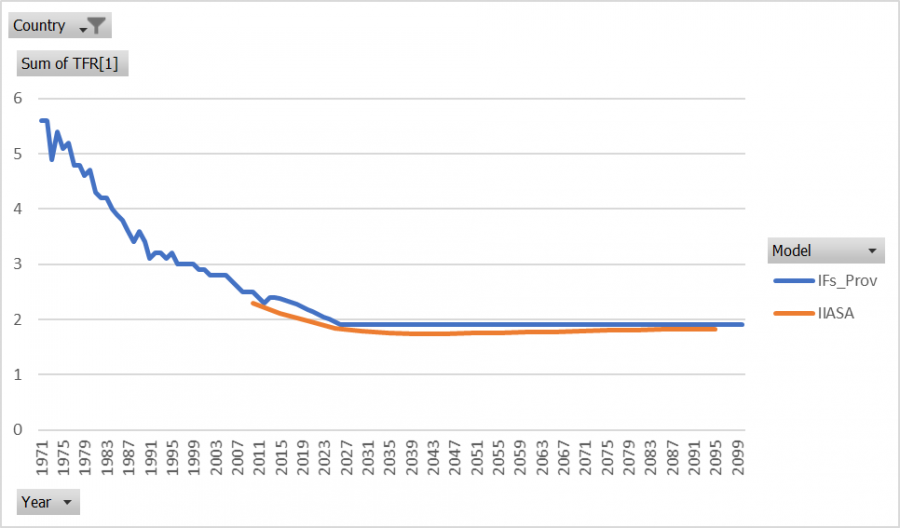
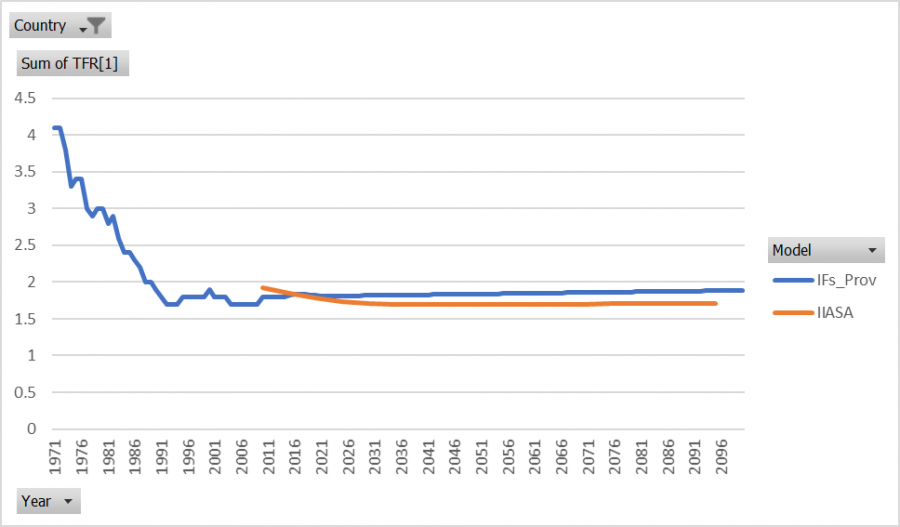
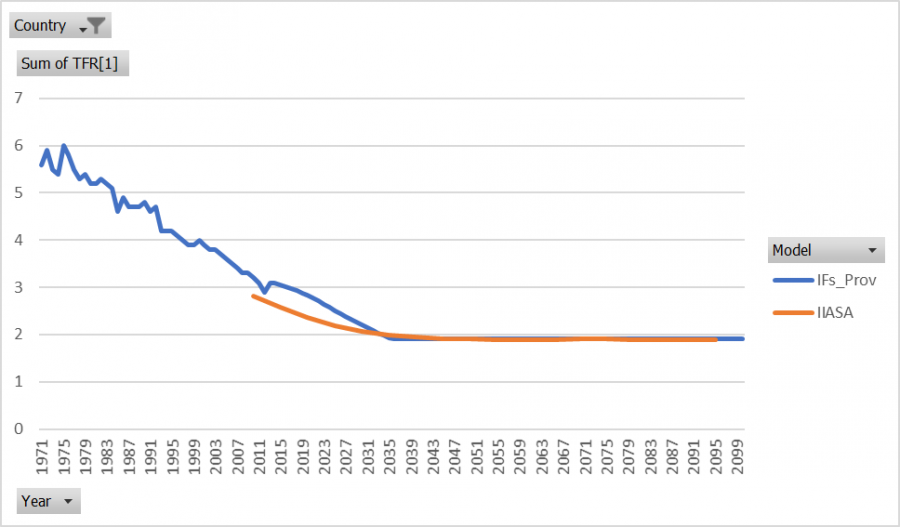
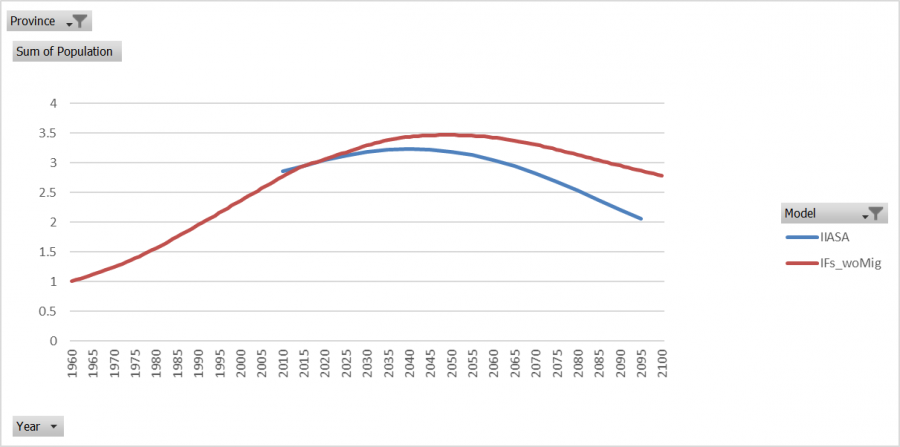
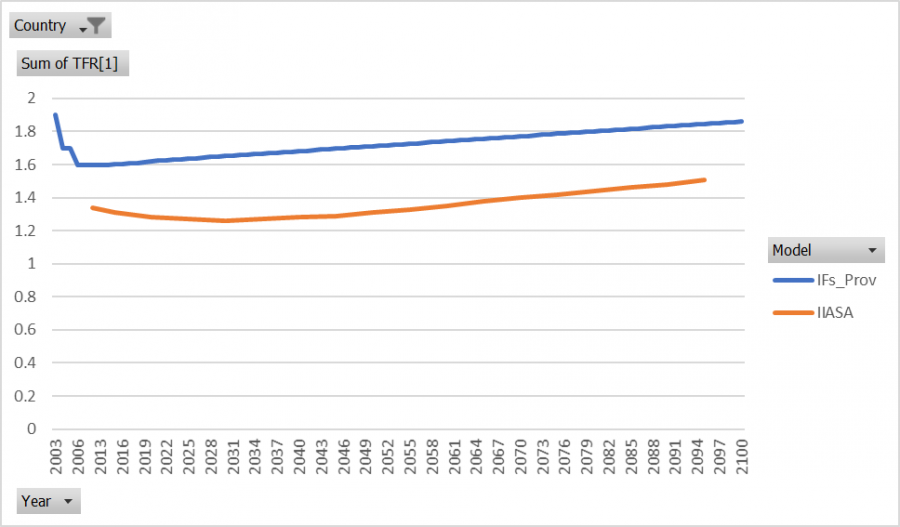
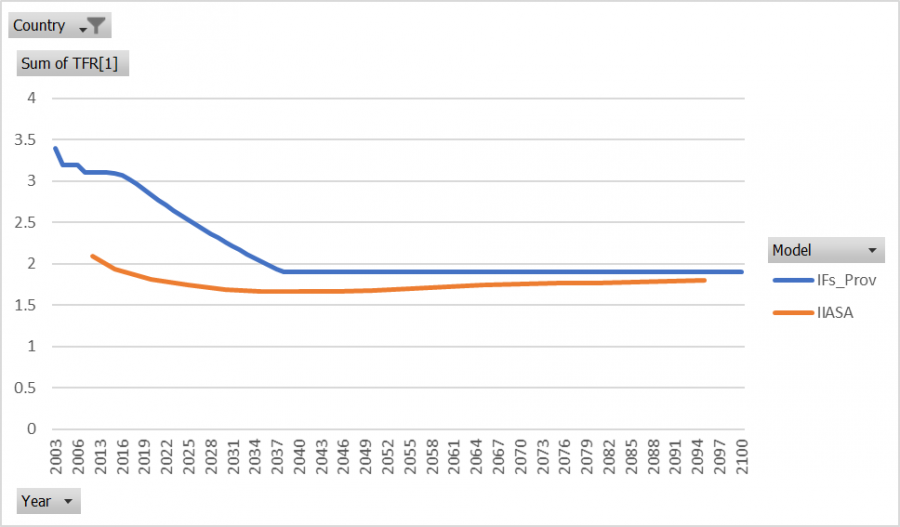
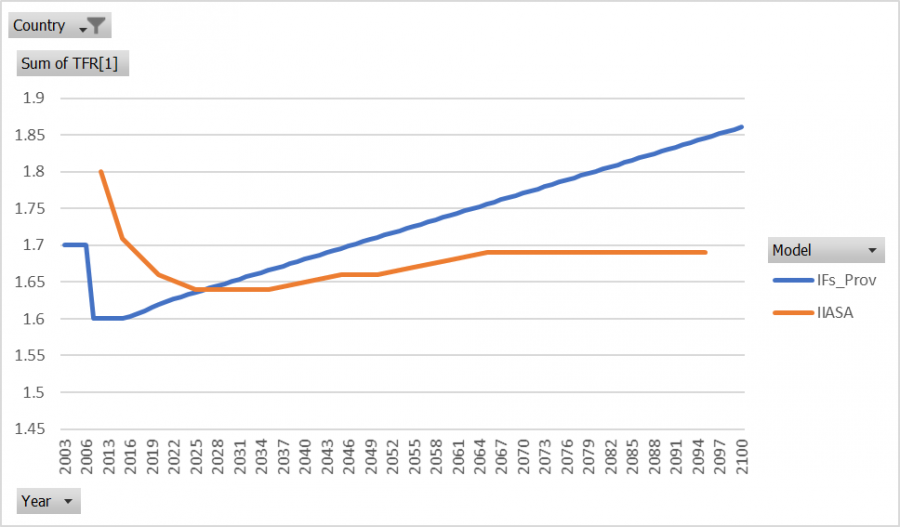
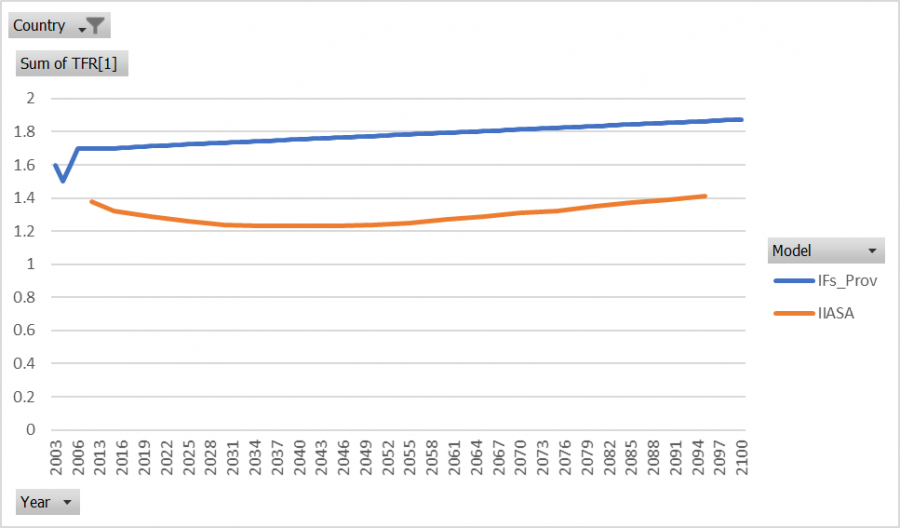
==== Total Fertility Rates ==== | |||
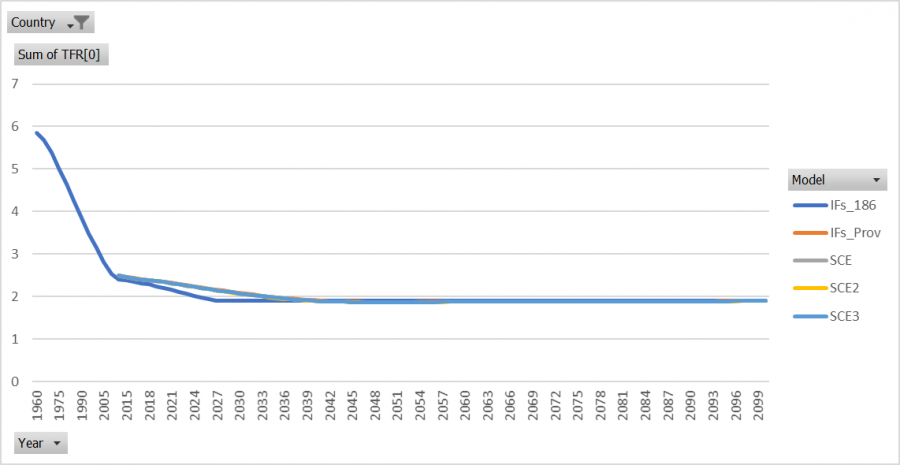
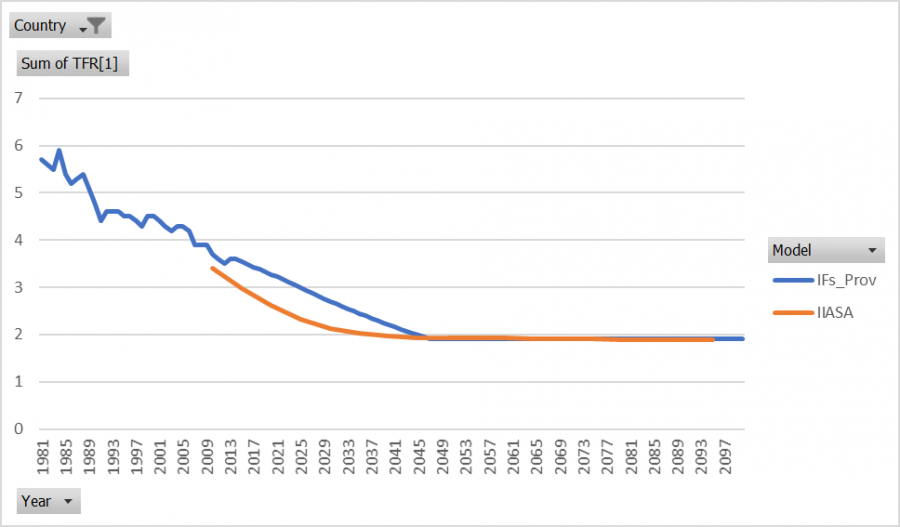
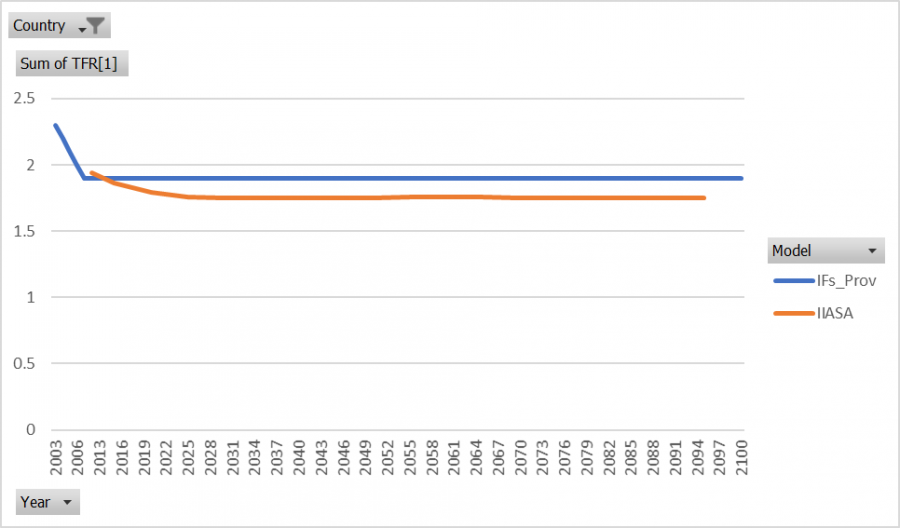
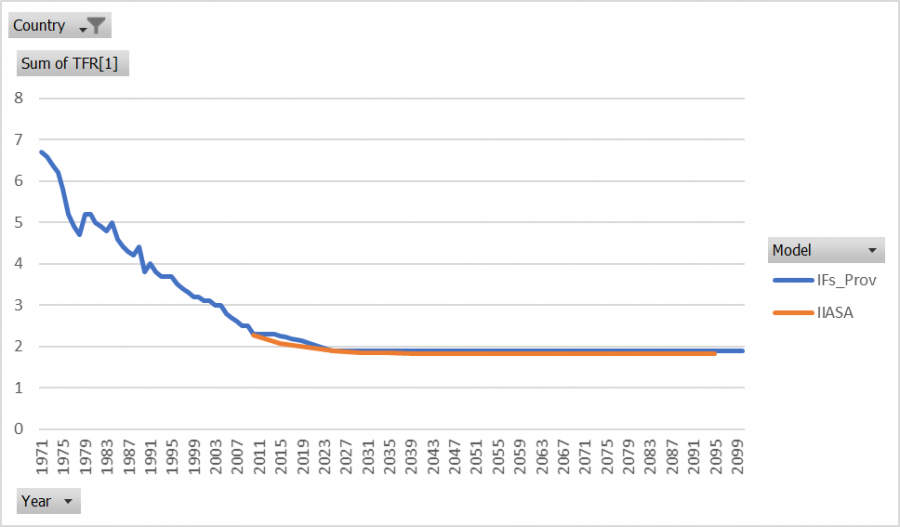
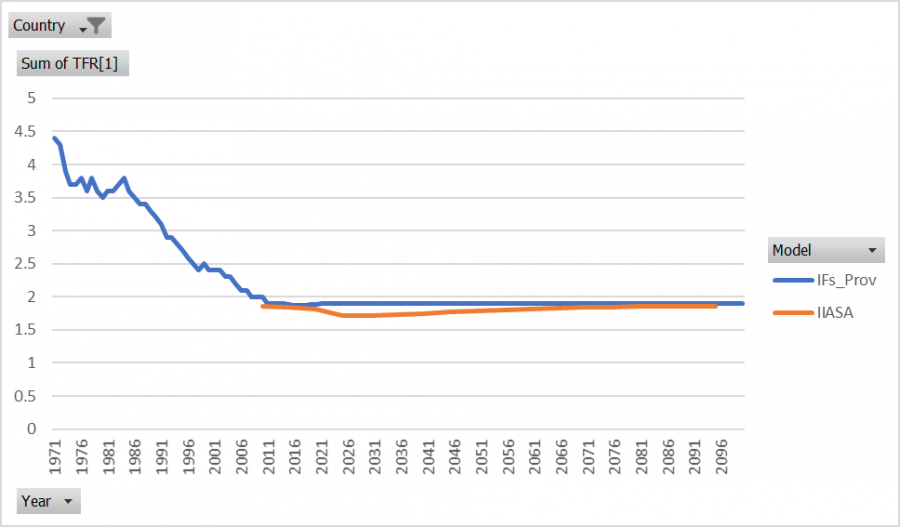
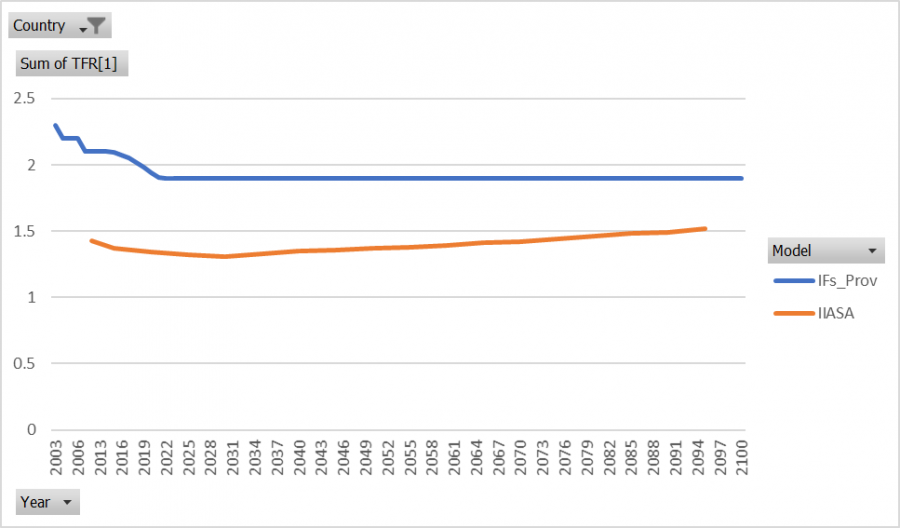
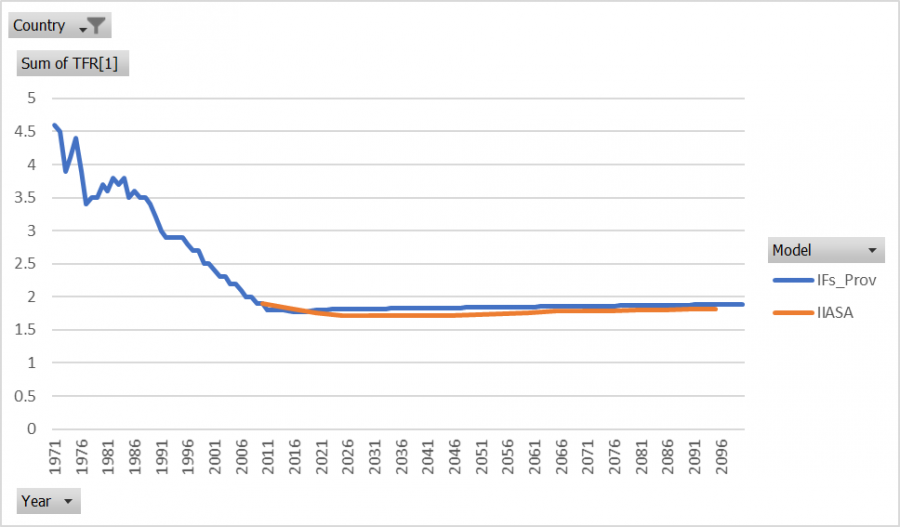
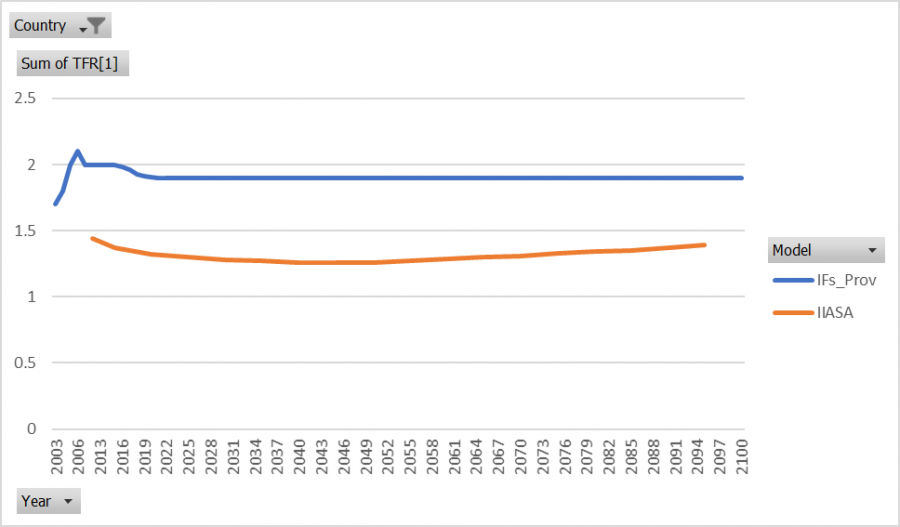
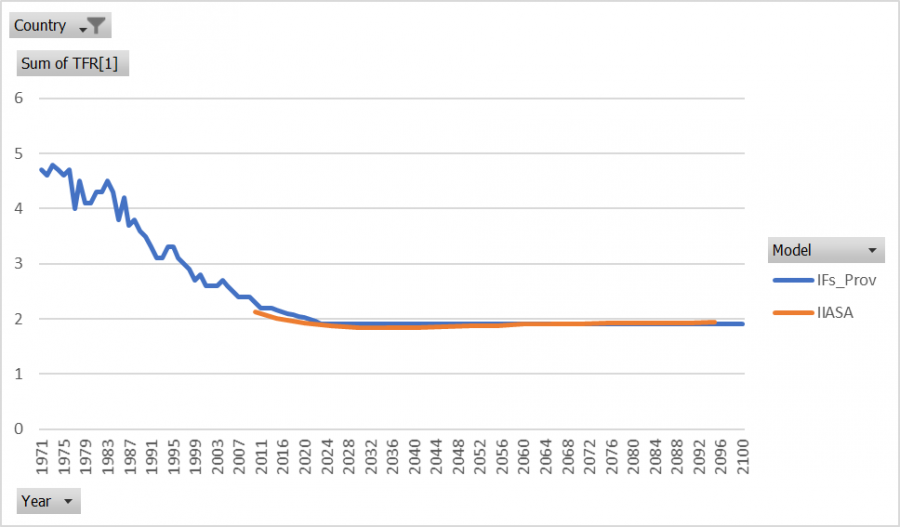
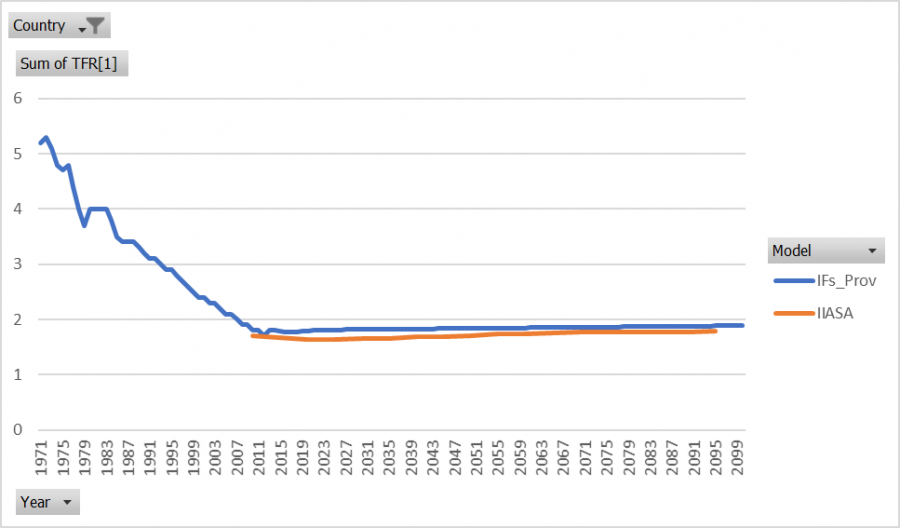
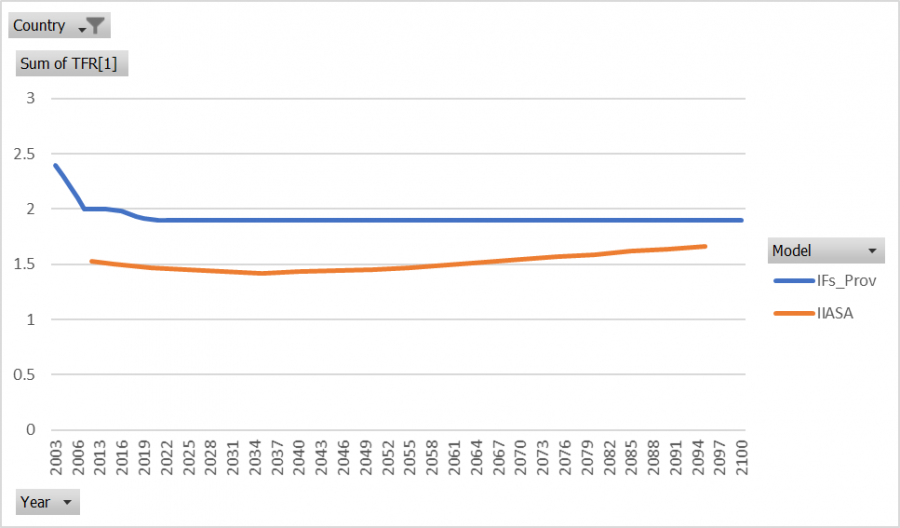
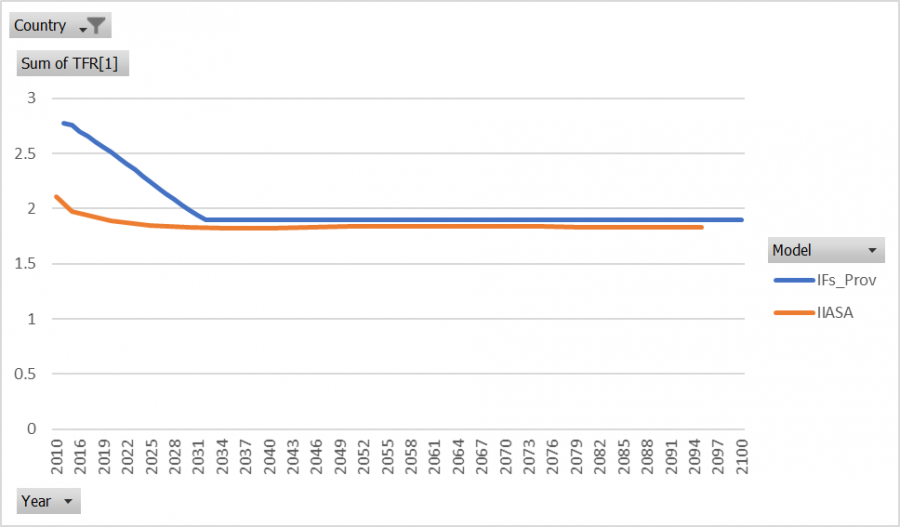
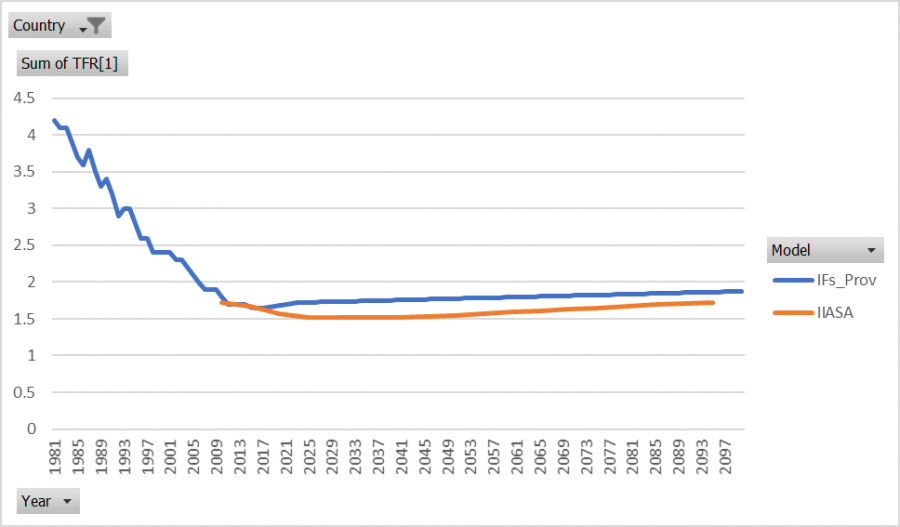
[[File:IndiaTFRSCE3.png|900px|IndiaTFRSCE3.png]] | |||
=== Andaman and Nicobar Islands === | === Andaman and Nicobar Islands === | ||
| Line 142: | Line 166: | ||
The second migration scenario is almost identical to the first scenario. In the first few years of forecast, Andaman and Nicobar Islands are identical to IIASA in the second scenario, whereas, in the first scenario the migration rates are at zero. | The second migration scenario is almost identical to the first scenario. In the first few years of forecast, Andaman and Nicobar Islands are identical to IIASA in the second scenario, whereas, in the first scenario the migration rates are at zero. | ||
[[File:AndamanandNicobarMigIIASASCE2.png|900px]] | [[File:AndamanandNicobarMigIIASASCE2.png|900px|AndamanandNicobarMigIIASASCE2.png]] | ||
===== Population After Migration Scenario 2 ===== | ===== Population After Migration Scenario 2 ===== | ||
| Line 148: | Line 172: | ||
Although ''migrater'' was not changed between the two scenarios, the migration rate and the population did change. The slight change in the first years of migration increased population sufficiently to bring Andaman and Nicobar Islands up to almost IIASA's population forecast. | Although ''migrater'' was not changed between the two scenarios, the migration rate and the population did change. The slight change in the first years of migration increased population sufficiently to bring Andaman and Nicobar Islands up to almost IIASA's population forecast. | ||
[[File:AndamanandNicobarPopIIASAMGSCE2.png|900px]] | [[File:AndamanandNicobarPopIIASAMGSCE2.png|900px|AndamanandNicobarPopIIASAMGSCE2.png]] | ||
==== Migration Scenario 3 Results ==== | |||
The migration rates are the same for Andaman and Nicobar Islands as they were in the second scenario. | |||
===== Migration Rates After Migration Scenario 3 ===== | |||
[[File:AndamanandNicobarMigIIASASCE3.png|900px|AndamanandNicobarMigIIASASCE3.png]] | |||
===== Population After Migration Scenario 3 ===== | |||
[[File:AndamanandNicobarPopIIASAMGSCE3 5.png|900px|AndamanandNicobarPopIIASAMGSCE3 5.png]] | |||
=== Arunanchal Pradesh === | === Arunanchal Pradesh === | ||
| Line 192: | Line 228: | ||
Arunanchal Pradesh's population is significantly greater after the introduction of migration into the model. | Arunanchal Pradesh's population is significantly greater after the introduction of migration into the model. | ||
[[File:ArunanchalPradeshPopIIASASCE.png|900px|ArunanchalPradeshPopIIASASCE.png]] | |||
==== Migration Scenario 2 Results ==== | ==== Migration Scenario 2 Results ==== | ||
| Line 200: | Line 236: | ||
===== Migration Rate After Migration Scenario 2 ===== | ===== Migration Rate After Migration Scenario 2 ===== | ||
[[File:ArunanchalPradeshMigIIASASCE2.png|900px]] | [[File:ArunanchalPradeshMigIIASASCE2.png|900px|ArunanchalPradeshMigIIASASCE2.png]] | ||
===== Population After Migration Scenario 2 ===== | ===== Population After Migration Scenario 2 ===== | ||
| Line 206: | Line 242: | ||
After the second scenario with the removal of migration rates, Arunanchal Pradesh's population is identical to the base case and close to IIASA's population forecast. | After the second scenario with the removal of migration rates, Arunanchal Pradesh's population is identical to the base case and close to IIASA's population forecast. | ||
[[File:ArunanchalPradeshPopIIASASCE2.png|900px]] | [[File:ArunanchalPradeshPopIIASASCE2.png|900px|ArunanchalPradeshPopIIASASCE2.png]] | ||
=== | ==== Migration Scenario 3 Results ==== | ||
Arunanchal Pradesh's migration rates were unchanged in the third and final scenario. | |||
===== Migration Rates After Migration Scenario 3 ===== | |||
==== Crude Birth Rates ==== | [[File:ArunanchalPradeshMigIIASASCE3.png|900px|ArunanchalPradeshMigIIASASCE3.png]] | ||
===== Population After Migration Scenario 3 ===== | |||
[[File:ArunanchalPradeshPopIIASASCE3 5.png|900px|ArunanchalPradeshPopIIASASCE3 5.png]] | |||
=== Assam === | |||
==== Population ==== | |||
The IFs model's population forecasts are slightly greater than IIASA's by less than 5% in all years. The average difference between the two models is around a 3%. [[File:AssamPopIIASA.png|900px|AssamPopIIASA.png]] | |||
==== Crude Birth Rates ==== | |||
CBRs are relatively close in the two models. The largest difference is in 2095 where IFs's population forecast is nearly 8% lower than IIASA's. [[File:AssamCBRIIASA.png|900px|AssamCBRIIASA.png]] | CBRs are relatively close in the two models. The largest difference is in 2095 where IFs's population forecast is nearly 8% lower than IIASA's. [[File:AssamCBRIIASA.png|900px|AssamCBRIIASA.png]] | ||
| Line 252: | Line 300: | ||
Although the migration rates are unchanged in the second scenario, the migration rates are greater in the second scenario than in the first. | Although the migration rates are unchanged in the second scenario, the migration rates are greater in the second scenario than in the first. | ||
[[File:AssamMigIIASASCE2.png|900px]] | [[File:AssamMigIIASASCE2.png|900px|AssamMigIIASASCE2.png]] | ||
===== Population After Migration Scenario 2 ===== | ===== Population After Migration Scenario 2 ===== | ||
| Line 258: | Line 306: | ||
Assam's migration rates do not change significantly in absolute terms and the population forecasts in the second scenario is quite close to IIASA's and the first scenario's population forecasts. | Assam's migration rates do not change significantly in absolute terms and the population forecasts in the second scenario is quite close to IIASA's and the first scenario's population forecasts. | ||
[[File:AssamPopIIASAMigSCE2.png|900px]] | [[File:AssamPopIIASAMigSCE2.png|900px|AssamPopIIASAMigSCE2.png]] | ||
==== Migration Scenario 3 Results ==== | |||
Assam's migration rates are unchanged in the third scenario from the previous iteration. | |||
===== Migration Rates After Migration Scenario 3 ===== | |||
[[File:AssamMigIIASASCE3.png|900px|AssamMigIIASASCE3.png]] | |||
===== Population After Migration Scenario 3 ===== | |||
[[File:AssamPopIIASAMigSCE3 5.png|900px|AssamPopIIASAMigSCE3 5.png]] | |||
=== Bihar === | === Bihar === | ||
| Line 306: | Line 366: | ||
This migration scenario is the one represented in all other provinces, where all provinces have migration data from IIASA in the ''migrater'' parameter. | This migration scenario is the one represented in all other provinces, where all provinces have migration data from IIASA in the ''migrater'' parameter. | ||
===== Migration Rate After Migration Scenario ===== | ===== Migration Rate After Migration Scenario 2 ===== | ||
With all provinces' migration rates adjusted, Bihar responds as expected where migration rates match IIASA's. | With all provinces' migration rates adjusted, Bihar responds as expected where migration rates match IIASA's. | ||
| Line 312: | Line 372: | ||
[[File:BiharMigIIASASCE.png|900px|BiharMigIIASASCE.png]] | [[File:BiharMigIIASASCE.png|900px|BiharMigIIASASCE.png]] | ||
===== Population After Migration Scenario ===== | ===== Population After Migration Scenario 2 ===== | ||
[[File:BiharPopIIASAMgSCE.png|900px|BiharPopIIASAMgSCE.png]] | [[File:BiharPopIIASAMgSCE.png|900px|BiharPopIIASAMgSCE.png]] | ||
| Line 324: | Line 384: | ||
The doubling of migration rates in 2014 shifts the migration rate line in the scenario down. After 2085, migration rates are forecast to decline to the same level that is in IIASA and the previous scenario. | The doubling of migration rates in 2014 shifts the migration rate line in the scenario down. After 2085, migration rates are forecast to decline to the same level that is in IIASA and the previous scenario. | ||
[[File:BiharMigIIASASCE2.png|900px]] | [[File:BiharMigIIASASCE2.png|900px|BiharMigIIASASCE2.png]] | ||
===== Population After Migration Scenario 3 ===== | ===== Population After Migration Scenario 3 ===== | ||
| Line 330: | Line 390: | ||
After the third migration scenario, Bihar's population forecasts have sufficiently declined to levels that are close to IIASA's population forecasts. There is a decline in population by about 80 million in 2100 from the base case to the third scenario. | After the third migration scenario, Bihar's population forecasts have sufficiently declined to levels that are close to IIASA's population forecasts. There is a decline in population by about 80 million in 2100 from the base case to the third scenario. | ||
[[File:BiharPopIIASAMgSCE2.png|900px]] | [[File:BiharPopIIASAMgSCE2.png|900px|BiharPopIIASAMgSCE2.png]] | ||
==== Migration Scenario 4 Results ==== | |||
Bihar's migration scenario 4 is the equivalent of migration scenario 3 for all other provinces in India. Bihar's migration rates were unchanged in the final scenario from the previous version. | |||
===== Migration Rates After Migration Scenario 4 ===== | |||
[[File:BiharMigIIASASCE3.png|900px|BiharMigIIASASCE3.png]] | |||
===== Population After Migration Scenario 4 ===== | |||
[[File:BiharPopIIASAMgSCE3 5.png|900px|BiharPopIIASAMgSCE3 5.png]] | |||
=== Chandigarh === | === Chandigarh === | ||
| Line 380: | Line 452: | ||
The migration rates are larger in the second scenario, in spite of identical data in both scenarios. | The migration rates are larger in the second scenario, in spite of identical data in both scenarios. | ||
[[File:ChandigarhMigIIASASCE2.png|900px]] | [[File:ChandigarhMigIIASASCE2.png|900px|ChandigarhMigIIASASCE2.png]] | ||
===== Population After Migration Scenario 2 ===== | ===== Population After Migration Scenario 2 ===== | ||
| Line 386: | Line 458: | ||
Chandigarh's population in the second scenario is about the same as IIASA's until about 2050. After 2050, the second scenario's population forecast is greater than IIASA's. | Chandigarh's population in the second scenario is about the same as IIASA's until about 2050. After 2050, the second scenario's population forecast is greater than IIASA's. | ||
[[File:ChandigarhPopIIASAMgSCE2.png|900px]] | [[File:ChandigarhPopIIASAMgSCE2.png|900px|ChandigarhPopIIASAMgSCE2.png]] | ||
=== | ==== Migration Scenario 3 Results ==== | ||
Chandigarh's migration rates were unchanged in the third and final scenario. | |||
The IFs model's forecast of population in Chhatisgarh is greater than IIASA's population forecasts by an increasing margin. By 2095 IFs' population is about 11% greater than IIASA's. | ===== Migration Rates After Migration Scenario 3 ===== | ||
[[File:ChandigarhMigIIASASCE3.png|900px|ChandigarhMigIIASASCE3.png]] | |||
===== Population After Migration Scenario 3 ===== | |||
[[File:ChandigarhPopIIASAMgSCE3 5.png|900px|ChandigarhPopIIASAMgSCE3 5.png]] | |||
=== Chhatisgarh === | |||
==== Population ==== | |||
The IFs model's forecast of population in Chhatisgarh is greater than IIASA's population forecasts by an increasing margin. By 2095 IFs' population is about 11% greater than IIASA's. | |||
[[File:ChhatisgarhPopIIASA.png|900px|ChhatisgarhPopIIASA.png]] | [[File:ChhatisgarhPopIIASA.png|900px|ChhatisgarhPopIIASA.png]] | ||
| Line 418: | Line 502: | ||
[[File:ChhatisgarhTFRIIASA.png|900px|ChhatisgarhTFRIIASA.png]] | [[File:ChhatisgarhTFRIIASA.png|900px|ChhatisgarhTFRIIASA.png]] | ||
==== Migration Scenario Results ==== | ==== Migration Scenario 1 Results ==== | ||
===== Migration Rate After Migration Scenario ===== | ===== Migration Rate After Migration Scenario 1 ===== | ||
[[File:ChhatisgarhMigIIASASCE.png|900px|ChhatisgarhMigIIASASCE.png]] | [[File:ChhatisgarhMigIIASASCE.png|900px|ChhatisgarhMigIIASASCE.png]] | ||
===== Population After Migration Scenario ===== | ===== Population After Migration Scenario 1 ===== | ||
[[File:ChhatisgarhPopIIASAMgSCE.png|900px|ChhatisgarhPopIIASAMgSCE.png]] | [[File:ChhatisgarhPopIIASAMgSCE.png|900px|ChhatisgarhPopIIASAMgSCE.png]] | ||
| Line 436: | Line 520: | ||
The migration rates in the second scenario are identical to the migration rates from IIASA and the first scenario. However after the second scenario was run migration rates are greater for all years. | The migration rates in the second scenario are identical to the migration rates from IIASA and the first scenario. However after the second scenario was run migration rates are greater for all years. | ||
[[File: | [[File:ChhatisgarhMigIIASASCE2 5.png|900px|ChhatisgarhMigIIASASCE2 5.png]] | ||
===== Population After Migration Scenario 2 ===== | ===== Population After Migration Scenario 2 ===== | ||
| Line 442: | Line 526: | ||
The greater migration rates makes population slightly greater in the second scenario, but the difference is small. | The greater migration rates makes population slightly greater in the second scenario, but the difference is small. | ||
[[File:ChhatisgarhPopIIASAMgSCE2.png|900px]] | [[File:ChhatisgarhPopIIASAMgSCE2.png|900px|ChhatisgarhPopIIASAMgSCE2.png]] | ||
==== Migration Scenario 3 Results ==== | |||
Chhatisgarh's migration rates were doubled, which means they were lowered from -0.12 to -0.24 in 2014. | |||
===== Migration Rates After Migration Scenario 3 ===== | |||
[[File:ChhatisgarhMigIIASASCE3.png|900px|ChhatisgarhMigIIASASCE3.png]] | |||
===== Population After Migration Scenario 3 ===== | |||
[[File:ChhatisgarhPopIIASAMgSCE3 5.png|900px|ChhatisgarhPopIIASAMgSCE3 5.png]] | |||
=== Dadra and Nagar Haveli === | === Dadra and Nagar Haveli === | ||
| Line 474: | Line 570: | ||
[[File:DadraandNagarHaveliTFRIIASA.png|900px|DadraandNagarHaveliTFRIIASA.png]] | [[File:DadraandNagarHaveliTFRIIASA.png|900px|DadraandNagarHaveliTFRIIASA.png]] | ||
==== Migration Scenario Results ==== | ==== Migration Scenario 1 Results ==== | ||
===== Migration Rate After Migration Scenario ===== | ===== Migration Rate After Migration Scenario 1 ===== | ||
[[File:DadraandNagarHaveliMigIIASASCE.png|900px|DadraandNagarHaveliMigIIASASCE.png]] | [[File:DadraandNagarHaveliMigIIASASCE.png|900px|DadraandNagarHaveliMigIIASASCE.png]] | ||
===== Population After Migration Scenario ===== | ===== Population After Migration Scenario 1 ===== | ||
[[File:DadraandNagarHaveliPopIIASAMgSCE.png|900px|DadraandNagarHaveliPopIIASAMgSCE.png]] | [[File:DadraandNagarHaveliPopIIASAMgSCE.png|900px|DadraandNagarHaveliPopIIASAMgSCE.png]] | ||
| Line 492: | Line 588: | ||
Although the migration rates within the second scenario are identical to IIASA's and the first scenario, after the scenario is run the migration rates are greater in the second scenario. | Although the migration rates within the second scenario are identical to IIASA's and the first scenario, after the scenario is run the migration rates are greater in the second scenario. | ||
[[File:DadraandNagarHaveliMigIIASASCE2.png|900px]] | [[File:DadraandNagarHaveliMigIIASASCE2.png|900px|DadraandNagarHaveliMigIIASASCE2.png]] | ||
===== Population After Migration Scenario 2 ===== | ===== Population After Migration Scenario 2 ===== | ||
The increased migration rates in the second scenario causes the population forecasts to overshoot IIASA's. | The increased migration rates in the second scenario causes the population forecasts to overshoot IIASA's. The total population is really small in all models. | ||
[[File:DadraandNagarHaveliPopIIASASCE2.png|900px]] | [[File:DadraandNagarHaveliPopIIASASCE2.png|900px|DadraandNagarHaveliPopIIASASCE2.png]] | ||
=== | ==== Migration Scenario 3 Results ==== | ||
Dadra and Nagar Haveli's migration rates were unchanged. | |||
===== Migration Rates After Migration Scenario 3 ===== | |||
[[File:DamanandDiuPopIIASA.png|900px|DamanandDiuPopIIASA.png]] | [[File:DadraandNagarHaveliMigIIASASCE3.png|900px|DadraandNagarHaveliMigIIASASCE3.png]] | ||
===== Population After Migration Scenario 3 ===== | |||
[[File:DadraandNagarHaveliPopIIASAMgSCE3 5.png|900px|DadraandNagarHaveliPopIIASAMgSCE3 5.png]] | |||
=== Daman and Diu === | |||
==== Population ==== | |||
IFs population forecasts for Daman and Diu are significantly less than the IIASA population forecasts. The magnitude of difference between the population forecasts in the IFs model and IIASA's model is at its greatest in 2095 with the IFs population being 268% less than the IIASA population. | |||
[[File:DamanandDiuPopIIASA.png|900px|DamanandDiuPopIIASA.png]] | |||
==== Crude Birth Rates ==== | ==== Crude Birth Rates ==== | ||
| Line 550: | Line 658: | ||
Although there was no change to the migration rate data between the first and second scenario, the second scenario has larger migration rates after the scenario was run. | Although there was no change to the migration rate data between the first and second scenario, the second scenario has larger migration rates after the scenario was run. | ||
[[File:DamanandDiuMigIIASASCE2.png|900px]] | [[File:DamanandDiuMigIIASASCE2.png|900px|DamanandDiuMigIIASASCE2.png]] | ||
===== Population After Migration Scenario 2 ===== | ===== Population After Migration Scenario 2 ===== | ||
The population forecasts | The population forecasts are greater than in the first scenario and overshoots IIASA's forecasts by about 4 hundred thousand people at the end of the time horizon. | ||
[[File:DamanandDiuPopIIASAMgSCE2 5.png|900px|DamanandDiuPopIIASAMgSCE2 5.png]] | |||
==== Migration Scenario 3 Results ==== | |||
Daman and Diu's migration rates have not changed from the previous scenario. | |||
===== Migration Rates After Migration Scenario 3 ===== | |||
[[File:DamanandDiuMigIIASASCE3.png|900px|DamanandDiuMigIIASASCE3.png]] | |||
===== Population After Migration Scenario 3 ===== | |||
[[File: | [[File:DamanandDiuPopIIASAMgSCE3 5.png|900px|DamanandDiuPopIIASAMgSCE3 5.png]] | ||
=== Delhi === | === Delhi === | ||
| Line 606: | Line 726: | ||
Migration rates in the second scenario are greater than in the first, despite the same migration data being in both scenarios. | Migration rates in the second scenario are greater than in the first, despite the same migration data being in both scenarios. | ||
[[File:DelhiMigIIASASCE2.png|900px]] | [[File:DelhiMigIIASASCE2.png|900px|DelhiMigIIASASCE2.png]] | ||
===== Population After Migration Scenario 2 ===== | ===== Population After Migration Scenario 2 ===== | ||
| Line 612: | Line 732: | ||
Due to the increase in migration rates after the second scenario was run, the population forecasts are greater in the second scenario by about 10 million in 2100. | Due to the increase in migration rates after the second scenario was run, the population forecasts are greater in the second scenario by about 10 million in 2100. | ||
[[File:DelhiPopIIASAMgSCE2.png|900px]] | [[File:DelhiPopIIASAMgSCE2.png|900px|DelhiPopIIASAMgSCE2.png]] | ||
==== Migration Scenario 3 Results ==== | |||
Delhi's migration rates were not changed from the previous iterations. | |||
===== Migration Rates After Migration Scenario 3 ===== | |||
[[File:DelhiMigIIASASCE3.png|900px|DelhiMigIIASASCE3.png]] | |||
===== Population After Migration Scenario 3 ===== | |||
[[File:DelhiPopIIASAMgSCE3 5.png|900px|DelhiPopIIASAMgSCE3 5.png]] | |||
=== Goa === | === Goa === | ||
| Line 662: | Line 794: | ||
The migration rate in Goa was halved starting in 2014 in the second migration scenario. However, the first few years are close to zero after the scenario was run. These zeroes are not in the data in the scenario, rather it is some push back from within the model. | The migration rate in Goa was halved starting in 2014 in the second migration scenario. However, the first few years are close to zero after the scenario was run. These zeroes are not in the data in the scenario, rather it is some push back from within the model. | ||
[[File:GoaMigIIASASCE2.png|900px]] | [[File:GoaMigIIASASCE2.png|900px|GoaMigIIASASCE2.png]] | ||
===== Population After Migration Scenario 2 ===== | ===== Population After Migration Scenario 2 ===== | ||
| Line 668: | Line 800: | ||
The halving of migration rates in Goa in the second scenario brings population forecasts down to IIASA's population forecasts. | The halving of migration rates in Goa in the second scenario brings population forecasts down to IIASA's population forecasts. | ||
[[File:GoaPopIIASAMgSCE2.png|900px]] | [[File:GoaPopIIASAMgSCE2.png|900px|GoaPopIIASAMgSCE2.png]] | ||
=== | ==== Migration Scenario 3 Results ==== | ||
Goa's migration rates were unchanged from the previous scenario. | |||
The population forecasts of Gujarat are similar in the two models, with IFs' forecasts being greater than IIASA's in all years. The magnitude of difference between the two models is less than 5% in all years. | ===== Migration Rates After Migration Scenario 3 ===== | ||
[[File:GoaMigIIASASCE3.png|900px|GoaMigIIASASCE3.png]] | |||
===== Population After Migration Scenario 3 ===== | |||
[[File:GoaPopIIASAMgSCE3 5.png|900px|GoaPopIIASAMgSCE3 5.png]] | |||
=== Gujarat === | |||
==== Population ==== | |||
The population forecasts of Gujarat are similar in the two models, with IFs' forecasts being greater than IIASA's in all years. The magnitude of difference between the two models is less than 5% in all years. | |||
[[File:GujaratPopIIASA.png|900px|GujaratPopIIASA.png]] | [[File:GujaratPopIIASA.png|900px|GujaratPopIIASA.png]] | ||
| Line 716: | Line 860: | ||
===== Migration Rates After Scenario 2 ===== | ===== Migration Rates After Scenario 2 ===== | ||
[[File:GujaratMigIIASASCE2.png|900px]] | [[File:GujaratMigIIASASCE2.png|900px|GujaratMigIIASASCE2.png]] | ||
===== Population After Migration Scenario 2 ===== | ===== Population After Migration Scenario 2 ===== | ||
| Line 722: | Line 866: | ||
Population drops down to close to IIASA's forecasts when migration data is not used for Gujarat in the second scenario. | Population drops down to close to IIASA's forecasts when migration data is not used for Gujarat in the second scenario. | ||
[[File:GujaratPopIIASAMgSCE2.png|900px]] | [[File:GujaratPopIIASAMgSCE2.png|900px|GujaratPopIIASAMgSCE2.png]] | ||
==== Migration Scenario 3 Results ==== | |||
Gujarat's migration rates were unchanged from the previous scenario version. | |||
===== Migration Rates After Migration Scenario 3 ===== | |||
[[File:GujaratMigIIASASCE3.png|900px|GujaratMigIIASASCE3.png]] | |||
===== Population After Migration Scenario 3 ===== | |||
[[File:GujaratPopIIASAMgSCE3 5.png|900px|GujaratPopIIASAMgSCE3 5.png]] | |||
=== Haryana === | === Haryana === | ||
| Line 770: | Line 926: | ||
===== Migration Rate After Migration Scenario 2 ===== | ===== Migration Rate After Migration Scenario 2 ===== | ||
There is some push back in the model on the migration rates, but they are close to the desired values. | |||
[[File:HaryanaMigIIASASCE2 5.png|900px|HaryanaMigIIASASCE2 5.png]] | |||
===== Population After Migration Rate Scenario 2 ===== | |||
Population is even closer in the second scenario to IIASA's forecasts, than it was in the first. | |||
[[File:HaryanaPopIIASAMgSCE2 5.png|900px|HaryanaPopIIASAMgSCE2 5.png]] | |||
==== Migration Scenario 3 Results ==== | |||
Haryana's migration rates are unchanged from the previous scenario. | |||
==== | ===== Migration Rates After Migration Scenario 3 ===== | ||
IIASA's forecasts of CDRs are greater than IFs until 2085. The magnitude of difference between the two models ranges from -10% to 5%. | [[File:HaryanaMigIIASASCE3.png|900px|HaryanaMigIIASASCE3.png]] | ||
===== Population After Migration Scenario 3 ===== | |||
[[File:HaryanaPopIIASAMgSCE3 5.png|900px|HaryanaPopIIASAMgSCE3 5.png]] | |||
=== Himachal Pradesh === | |||
==== Population ==== | |||
The population forecasts in the two models are quite close with IIASA's forecasts are slightly larger from 2060 through the end of the time horizon. | |||
[[File:HimachalPradeshPopIIASA.png|900px|HimachalPradeshPopIIASA.png]] | |||
==== Crude Birth Rates ==== | |||
IFs forecasts CBRs to be higher than IIASA for all years by a decreasing margin. In 2030 the magnitude of difference between the two models peaks at 13% and by 2095 the magnitude of difference declines to 7.5%. | |||
[[File:HimachalPradeshCBRIIASA.png|900px|HimachalPradeshCBRIIASA.png]] | |||
==== Crude Death Rates ==== | |||
IIASA's forecasts of CDRs are greater than IFs until 2085. The magnitude of difference between the two models ranges from -10% to 5%. | |||
[[File:HimachalPradeshCDRIIASA.png|900px|HimachalPradeshCDRIIASA.png]] | [[File:HimachalPradeshCDRIIASA.png|900px|HimachalPradeshCDRIIASA.png]] | ||
| Line 816: | Line 994: | ||
===== Migration Rate After Scenario 2 ===== | ===== Migration Rate After Scenario 2 ===== | ||
[[File:HimachalPradeshMigIIASASCE2.png|900px]] | [[File:HimachalPradeshMigIIASASCE2.png|900px|HimachalPradeshMigIIASASCE2.png]] | ||
===== Population After Migration Scenario 2 ===== | ===== Population After Migration Scenario 2 ===== | ||
[[File:HimachalPradeshPopIIASAMgSCE2.png|900px]] | [[File:HimachalPradeshPopIIASAMgSCE2.png|900px|HimachalPradeshPopIIASAMgSCE2.png]] | ||
==== Migration Scenario 3 Results ==== | |||
Himachal Pradesh's migration rates are unchanged from the previous scenario. | |||
===== Migration Rates After Migration Scenario 3 ===== | |||
[[File:HimachalPradeshMigIIASASCE3.png|900px|HimachalPradeshMigIIASASCE3.png]] | |||
===== Population After Migration Scenario 3 ===== | |||
[[File:HimachalPradeshPopIIASAMgSCE3 5.png|900px|HimachalPradeshPopIIASAMgSCE3 5.png]] | |||
=== Jammu and Kashmir === | === Jammu and Kashmir === | ||
| Line 878: | Line 1,068: | ||
[[File:JammuKashmirPopIIASAMgSCE2.png|900px|JammuKashmirPopIIASAMgSCE2.png]] | [[File:JammuKashmirPopIIASAMgSCE2.png|900px|JammuKashmirPopIIASAMgSCE2.png]] | ||
=== Jharkhand === | ==== Migration Scenario 3 Results ==== | ||
Jammu and Kashmir's migration rates were tripled from the calculated migration rate from IIASA in the third and final iteration. | |||
===== Migration Rates After Migration Scenario 3 ===== | |||
[[File:JammuKashmirMigIIASASCE3.png|900px|JammuKashmirMigIIASASCE3.png]] | |||
===== Population After Migration Scenario 3 ===== | |||
[[File:JammuKashmirPopIIASAMgSCE3 5.png|900px|JammuKashmirPopIIASAMgSCE3 5.png]] | |||
=== Jharkhand === | |||
==== Population ==== | ==== Population ==== | ||
| Line 924: | Line 1,126: | ||
===== Migration Rates After Migration Scenario 2 ===== | ===== Migration Rates After Migration Scenario 2 ===== | ||
[[File:JharkhandMigIIASASCE2.png|900px]] | [[File:JharkhandMigIIASASCE2.png|900px|JharkhandMigIIASASCE2.png]] | ||
===== Population After Migration Scenario 2 ===== | ===== Population After Migration Scenario 2 ===== | ||
| Line 930: | Line 1,132: | ||
The second scenario forecasts Jharkhand's population to be close to IIASA's forecasts. | The second scenario forecasts Jharkhand's population to be close to IIASA's forecasts. | ||
[[File:JharkhandPopIIASAMgSCE2.png|900px]] | [[File:JharkhandPopIIASAMgSCE2.png|900px|JharkhandPopIIASAMgSCE2.png]] | ||
==== Migration Scenario 3 Results ==== | |||
Jharkhand's migration rates are unchanged from the last scenario. | |||
===== Migration Rates After Migration Scenario 3 ===== | |||
[[File:JharkhandMigIIASASCE3.png|900px|JharkhandMigIIASASCE3.png]] | |||
===== Population After Migration Scenario 3 ===== | |||
[[File:JharkhandPopIIASAMgSCE3 5.png|900px|JharkhandPopIIASAMgSCE3 5.png]] | |||
=== Karnataka === | === Karnataka === | ||
| Line 978: | Line 1,192: | ||
===== Migration Rates After Scenario 2 ===== | ===== Migration Rates After Scenario 2 ===== | ||
[[File:KarnatakaMigIIASASCE2.png|900px]] | [[File:KarnatakaMigIIASASCE2.png|900px|KarnatakaMigIIASASCE2.png]] | ||
===== Population After Migration Scenario 2 ===== | ===== Population After Migration Scenario 2 ===== | ||
| Line 984: | Line 1,198: | ||
Karnataka's population is about 8 million greater than IIASA's at the end of the time horizon. | Karnataka's population is about 8 million greater than IIASA's at the end of the time horizon. | ||
[[File:KarnatakaPopIIASAMgSCE2.png|900px]] | [[File:KarnatakaPopIIASAMgSCE2.png|900px|KarnatakaPopIIASAMgSCE2.png]] | ||
==== Migration Scenario 3 Results ==== | |||
Karnataka's migration rates were lowered to -0.4, despite the fact that IIASA forecasts there to be positive net migration into Karnataka. The negative migration rates are to offset the greater rate of deaths forecasts in Karnataka by the IIASA model. | |||
===== Migration Rates After Migration Scenario 3 ===== | |||
[[File:KarnatakaMigIIASASCE3.png|900px|KarnatakaMigIIASASCE3.png]] | |||
===== Population After Migration Scenario 3 ===== | |||
[[File:KarnatakaPopIIASAMgSCE3 5.png|900px|KarnatakaPopIIASAMgSCE3 5.png]] | |||
=== Kerala === | === Kerala === | ||
| Line 1,016: | Line 1,242: | ||
[[File:KeralaTFRIIASA.png|900px|KeralaTFRIIASA.png]] | [[File:KeralaTFRIIASA.png|900px|KeralaTFRIIASA.png]] | ||
==== Migration Scenario Results ==== | ==== Migration Scenario 1 Results ==== | ||
===== Migration Rate After Migration Scenario ===== | ===== Migration Rate After Migration Scenario 1 ===== | ||
[[File:KeralaMigIIASASCE.png|900px|KeralaMigIIASASCE.png]] | [[File:KeralaMigIIASASCE.png|900px|KeralaMigIIASASCE.png]] | ||
===== Population After Migration Scenario ===== | ===== Population After Migration Scenario 1 ===== | ||
[[File:KeralaPopIIASAMgSCE.png|900px|KeralaPopIIASAMgSCE.png]] | [[File:KeralaPopIIASAMgSCE.png|900px|KeralaPopIIASAMgSCE.png]] | ||
| Line 1,034: | Line 1,260: | ||
There is some model push back in the latter years of forecasts in migration rates where migration rates decline to around IIASA's level. | There is some model push back in the latter years of forecasts in migration rates where migration rates decline to around IIASA's level. | ||
[[File:KeralaMigIIASASCE2.png|900px]] | [[File:KeralaMigIIASASCE2.png|900px|KeralaMigIIASASCE2.png]] | ||
===== Population After Migration Scenario 2 ===== | ===== Population After Migration Scenario 2 ===== | ||
| Line 1,040: | Line 1,266: | ||
After doubling migration rates in the second scenario, IFs population forecasts in Kerala are closer to IIASA's but they are still about 3 million greater at the end of the time horizon. | After doubling migration rates in the second scenario, IFs population forecasts in Kerala are closer to IIASA's but they are still about 3 million greater at the end of the time horizon. | ||
[[File:KeralaPopIIASAMgSCE2.png|900px]] | [[File:KeralaPopIIASAMgSCE2.png|900px|KeralaPopIIASAMgSCE2.png]] | ||
=== | ==== Migration Scenario 3 Results ==== | ||
==== Population ==== | Kerala's migration rates are increased in the third and final scenario. They are tripled from the first scenario. | ||
===== Migration Rates After Migration Scenario 3 ===== | |||
[[File:KeralaMigIIASASCE3.png|900px|KeralaMigIIASASCE3.png]] | |||
===== Population After Migration Scenario 3 ===== | |||
[[File:KeralaPopIIASAMgSCE3 5.png|900px|KeralaPopIIASAMgSCE3 5.png]] | |||
=== Lakshadweep === | |||
==== Population ==== | |||
IFs' forecast for population in Lakshadweep is significantly lower than IIASA's forecast. The magnitude of difference between the two models in 2095 is 64%. | IFs' forecast for population in Lakshadweep is significantly lower than IIASA's forecast. The magnitude of difference between the two models in 2095 is 64%. | ||
| Line 1,090: | Line 1,328: | ||
===== Migration Rates After Migration Scenario 2 ===== | ===== Migration Rates After Migration Scenario 2 ===== | ||
[[File:LakshadweepMigIIASASCE2.png|900px]] | [[File:LakshadweepMigIIASASCE2.png|900px|LakshadweepMigIIASASCE2.png]] | ||
===== Population After Migration Scenario 2 ===== | ===== Population After Migration Scenario 2 ===== | ||
| Line 1,096: | Line 1,334: | ||
The second scenario is much closer to IIASA's forecasts of population. | The second scenario is much closer to IIASA's forecasts of population. | ||
[[File:LakshadweepPopIIASAMgSCE2.png|900px]] | [[File:LakshadweepPopIIASAMgSCE2.png|900px|LakshadweepPopIIASAMgSCE2.png]] | ||
==== Migration Scenario 3 Results ==== | |||
Lakshadweep's migration rates are the same in the third scenario as they were in the second scenario. | |||
===== Migration Rates After Migration Scenario 3 ===== | |||
[[File:LakshadweepMigIIASASCE3.png|900px|LakshadweepMigIIASASCE3.png]] | |||
===== Population After Migration Scenario 3 ===== | |||
[[File:LakshadweepPopIIASAMgSCE3 5.png|900px|LakshadweepPopIIASAMgSCE3 5.png]] | |||
=== Madhya Pradesh === | === Madhya Pradesh === | ||
| Line 1,146: | Line 1,396: | ||
Even though the same migration rates were used in the scenario, there is a difference between the two scenarios. The second scenario's migration rates are larger than the first scenario because of some model pushback. | Even though the same migration rates were used in the scenario, there is a difference between the two scenarios. The second scenario's migration rates are larger than the first scenario because of some model pushback. | ||
[[File:MadhyaPradeshMigIIASASCE2.png|900px]] | [[File:MadhyaPradeshMigIIASASCE2.png|900px|MadhyaPradeshMigIIASASCE2.png]] | ||
===== Population After Migration Scenario 2 ===== | ===== Population After Migration Scenario 2 ===== | ||
| Line 1,152: | Line 1,402: | ||
This difference in migration rates is not apparent in the population forecasts because the migration rates are so small. | This difference in migration rates is not apparent in the population forecasts because the migration rates are so small. | ||
[[File:MadhyaPradeshPopIIASAMgSCE2.png|900px]] | [[File:MadhyaPradeshPopIIASAMgSCE2.png|900px|MadhyaPradeshPopIIASAMgSCE2.png]] | ||
==== Migration Scenario 3 ==== | |||
Madhya Pradesh's migration rates are unchanged in the third scenario from the second scenario. | |||
===== Migration Rates After Migration Scenario 3 ===== | |||
[[File:MadhyaPradeshMigIIASASCE3.png|900px|MadhyaPradeshMigIIASASCE3.png]] | |||
===== Population After Migration Scenario 3 ===== | |||
[[File:MadhyaPradeshPopIIASAMgSCE3 5.png|900px|MadhyaPradeshPopIIASAMgSCE3 5.png]] | |||
=== Maharashtra === | === Maharashtra === | ||
| Line 1,202: | Line 1,464: | ||
Although the same data is used in the second scenario as was in the first, the model pushes migration rates up above what is in the scenario. | Although the same data is used in the second scenario as was in the first, the model pushes migration rates up above what is in the scenario. | ||
[[File:MaharashtraMigIIASASCE2.png|900px]] | [[File:MaharashtraMigIIASASCE2.png|900px|MaharashtraMigIIASASCE2.png]] | ||
===== Population After Migration Scenario 2 ===== | ===== Population After Migration Scenario 2 ===== | ||
| Line 1,208: | Line 1,470: | ||
The increase in migration rates in the second scenario causes an increase in population in Maharashtra by about 10 million at the end of the time horizon. | The increase in migration rates in the second scenario causes an increase in population in Maharashtra by about 10 million at the end of the time horizon. | ||
[[File:MaharasthraPopIIASAMgSCE2.png|900px]] | [[File:MaharasthraPopIIASAMgSCE2.png|900px|MaharasthraPopIIASAMgSCE2.png]] | ||
=== | ==== Migration Scenario 3 Results ==== | ||
Madhya Pradesh's migration rates are unchanged from the second scenario. | |||
===== Migration Rates After Migration Scenario 3 ===== | |||
[[File:ManipurPopIIASA.png|900px|ManipurPopIIASA.png]] | [[File:MadhyaPradeshMigIIASASCE3.png|900px|MadhyaPradeshMigIIASASCE3.png]] | ||
===== Population After Migration Scenario 3 ===== | |||
[[File:MaharasthraPopIIASAMgSCE3 5.png|900px|MaharasthraPopIIASAMgSCE3 5.png]] | |||
=== Manipur === | |||
==== Population ==== | |||
IFs' population forecast for Manipur are greater than IIASA's by an increasing margin through the end of the time horizon. The magnitude of difference reaches 28% in 2095. | |||
[[File:ManipurPopIIASA.png|900px|ManipurPopIIASA.png]] | |||
==== Crude Birth Rates ==== | ==== Crude Birth Rates ==== | ||
| Line 1,260: | Line 1,534: | ||
There is the same increase away from IIASA's data in migration rates to zero in the second scenario as is in the first scenario during the latter years. However, the second scenario has higher migration rates than the first. | There is the same increase away from IIASA's data in migration rates to zero in the second scenario as is in the first scenario during the latter years. However, the second scenario has higher migration rates than the first. | ||
[[File:ManipurMigIIASASCE2.png|900px]] | [[File:ManipurMigIIASASCE2.png|900px|ManipurMigIIASASCE2.png]] | ||
===== Population After Migration Scenario 2 ===== | ===== Population After Migration Scenario 2 ===== | ||
| Line 1,266: | Line 1,540: | ||
The population forecasts in the second scenario are about the same as the first. | The population forecasts in the second scenario are about the same as the first. | ||
[[File:ManipurPopIIASAMgSCE2.png|900px]] | [[File:ManipurPopIIASAMgSCE2.png|900px|ManipurPopIIASAMgSCE2.png]] | ||
==== Migration Scenario 3 Results ==== | |||
Manipur's migration scenario is the same as in the first and second scenarios. | |||
===== Migration Rates After Migration Scenario 3 ===== | |||
[[File:ManipurMigIIASASCE3.png|900px|ManipurMigIIASASCE3.png]] | |||
===== Population After Migration Scenario 3 ===== | |||
Population in IFs is still about half a million more people than in IIASA's forecasts at the end of the time horizon. | |||
[[File:ManipurPopIIASAMgSCE3 5.png|900px|ManipurPopIIASAMgSCE3 5.png]] | |||
=== Meghalaya === | === Meghalaya === | ||
| Line 1,314: | Line 1,602: | ||
===== Migration Rates After Migration Scenario 2 ===== | ===== Migration Rates After Migration Scenario 2 ===== | ||
[[File:MeghalayaMigIIASASCE2.png|900px]] | [[File:MeghalayaMigIIASASCE2.png|900px|MeghalayaMigIIASASCE2.png]] | ||
===== Population After Migration Rate Scenario 2 ===== | ===== Population After Migration Rate Scenario 2 ===== | ||
| Line 1,320: | Line 1,608: | ||
The population forecasts in IFs for Meghalaya are about 2.5 million greater than IIASA's forecasts at the end of the time horizon. | The population forecasts in IFs for Meghalaya are about 2.5 million greater than IIASA's forecasts at the end of the time horizon. | ||
[[File:MeghalayaPopIIASAMgSCE2.png|900px]] | [[File:MeghalayaPopIIASAMgSCE2.png|900px|MeghalayaPopIIASAMgSCE2.png]] | ||
==== Migration Scenario 3 Results ==== | |||
Meghalya's migration rates were significantly reduced in the third and final scenario. The IIASA forecasts of migration in Meghalaya are positive but because their forecasts for deaths are significantly greater than what is in IFs, IIASA's population forecasts are much lower than what is in IFs without migration. Therefore, migration rates are lowered to -1.25 in 2014 in the third scenario to bring population in-line with IIASA's forecasts. | |||
===== Migration Rates After Migration Scenario 3 ===== | |||
[[File:MeghalayaMigIIASASCE3.png|900px|MeghalayaMigIIASASCE3.png]] | |||
===== Population After Migration Scenario 3 ===== | |||
Population after the third scenario run, is about 2 million less at than it was in the previous scenarios at the end of the time horizon. | |||
[[File:MeghalayaPopIIASAMgSCE3 5.png|900px|MeghalayaPopIIASAMgSCE3 5.png]] | |||
=== Mizoram === | === Mizoram === | ||
| Line 1,368: | Line 1,670: | ||
===== Migration Rates After Migration Scenario 2 ===== | ===== Migration Rates After Migration Scenario 2 ===== | ||
[[File:MizoramMigIIASASCE2.png|900px]] | [[File:MizoramMigIIASASCE2.png|900px|MizoramMigIIASASCE2.png]] | ||
===== Population After Migration Scenario 2 ===== | ===== Population After Migration Scenario 2 ===== | ||
| Line 1,374: | Line 1,676: | ||
The second scenario's forecast of population are closer to IIASA's forecast. | The second scenario's forecast of population are closer to IIASA's forecast. | ||
[[File:MizoramPopIIASAMgSCE2.png|900px]] | [[File:MizoramPopIIASAMgSCE2.png|900px|MizoramPopIIASAMgSCE2.png]] | ||
=== | ==== Migration Scenario 3 ==== | ||
==== Population ==== | Mizoram's migration rates are the same in the third scenario as they were in the second. | ||
===== Migration Rates After Migration Scenario 3 ===== | |||
[[File:MizoramMigIIASASCE3.png|900px|MizoramMigIIASASCE3.png]] | |||
===== Population After Migration Scenario 3 ===== | |||
[[File:MizoramPopIIASAMgSCE3 5.png|900px|MizoramPopIIASAMgSCE3 5.png]] | |||
=== Nagaland === | |||
==== Population ==== | |||
IFs' forecast of population in Nagaland is significantly greater than IIASA's forecast. By 2095 IFs' population forecast is about 38% greater than IIASA's. | IFs' forecast of population in Nagaland is significantly greater than IIASA's forecast. By 2095 IFs' population forecast is about 38% greater than IIASA's. | ||
| Line 1,422: | Line 1,736: | ||
===== Migration Rates After Migration Scenario 2 ===== | ===== Migration Rates After Migration Scenario 2 ===== | ||
[[File:NagalandMigIIASASCE2.png|900px]] | [[File:NagalandMigIIASASCE2.png|900px|NagalandMigIIASASCE2.png]] | ||
===== After Migration Scenario 2 ===== | ===== Population After Migration Scenario 2 ===== | ||
Population is slightly lower in the second scenario, but there is not a significant improvement in the population forecast for Nagaland. | Population is slightly lower in the second scenario, but there is not a significant improvement in the population forecast for Nagaland. | ||
===== [[File: | [[File:NagalandPopIIASAMgSCE2.png|900px|NagalandPopIIASAMgSCE2.png]] | ||
==== Migration Scenario 3 Results ==== | |||
Migration rates were lowered to three times what IIASA forecasts for Nagaland, which is -0.175. | |||
===== Migration Rates After Migration Scenario 3 ===== | |||
[[File:NagalandMigIIASASCE3.png|900px|NagalandMigIIASASCE3.png]] | |||
===== Population After Migration Scenario 3 ===== | |||
Nagaland's population is still significantly greater than IIASA's forecasts, but Nagaland's total population is relatively small compared to the rest of India. | |||
[[File:NagalandPopIIASAMgSCE3 5.png|900px|NagalandPopIIASAMgSCE3 5.png]] | |||
=== Orissa === | === Orissa === | ||
| Line 1,476: | Line 1,804: | ||
===== Migration Rates After Migration Scenario 2 ===== | ===== Migration Rates After Migration Scenario 2 ===== | ||
[[File:OrissaMigIIASASCE2.png|900px]] | [[File:OrissaMigIIASASCE2.png|900px|OrissaMigIIASASCE2.png]] | ||
===== Population After Migration Scenario 2 ===== | ===== Population After Migration Scenario 2 ===== | ||
| Line 1,482: | Line 1,810: | ||
The population forecasts in the second scenario are improved and are close to IIASA's. | The population forecasts in the second scenario are improved and are close to IIASA's. | ||
[[File:OrissaPopIIASAMgSCE2.png|900px]] | [[File:OrissaPopIIASAMgSCE2.png|900px|OrissaPopIIASAMgSCE2.png]] | ||
==== Migration Scenario 3 Results ==== | |||
Orissa's migration rates are the same in the third scenario as they were in the previous iterations. | |||
===== Migration Rates After Migration Scenario 3 ===== | |||
[[File:OrissaMigIIASASCE3.png|900px|OrissaMigIIASASCE3.png]] | |||
===== Population After Migration Scenario 3 ===== | |||
[[File:OrissaPopIIASAMgSCE3 5.png|900px|OrissaPopIIASAMgSCE3 5.png]] | |||
=== Pondicherry === | === Pondicherry === | ||
| Line 1,532: | Line 1,872: | ||
Despite the same data having been used in the second scenario as was in the first, the model pushed back and increased migration rates somewhat in the second scenario. | Despite the same data having been used in the second scenario as was in the first, the model pushed back and increased migration rates somewhat in the second scenario. | ||
[[File:PondicherryMigIIASASCE2.png|900px]] | [[File:PondicherryMigIIASASCE2.png|900px|PondicherryMigIIASASCE2.png]] | ||
===== Population After Migration Scenario 2 ===== | ===== Population After Migration Scenario 2 ===== | ||
| Line 1,538: | Line 1,878: | ||
The change in migration rates pushed population forecasts up. The second scenario overshoots IIASA's population forecasts by about a half a million at the end of the time horizon. | The change in migration rates pushed population forecasts up. The second scenario overshoots IIASA's population forecasts by about a half a million at the end of the time horizon. | ||
[[File:PondicherryPopIIASAMgSCE2.png|900px]] | [[File:PondicherryPopIIASAMgSCE2.png|900px|PondicherryPopIIASAMgSCE2.png]] | ||
=== | ==== Migration Scenario 3 Results ==== | ||
==== Population ==== | Pondicherry's migration rates are the same in the third scenario as they were in the previous scenarios. | ||
===== Migration Rates After Migration Scenario 3 ===== | |||
[[File:PondicherryMigIIASASCE3.png|900px|PondicherryMigIIASASCE3.png]] | |||
===== Population After Migration Scenario 3 ===== | |||
[[File:PondicherryPopIIASAMgSCE3 5.png|900px|PondicherryPopIIASAMgSCE3 5.png]] | |||
=== Punjab === | |||
==== Population ==== | |||
IFs forecasts Punjab's population to be lower than IIASA's by an increasing margin. Punjab's population is forecast to be about 5 million less in the IFs model than in IIASA's model by 2095. | IFs forecasts Punjab's population to be lower than IIASA's by an increasing margin. Punjab's population is forecast to be about 5 million less in the IFs model than in IIASA's model by 2095. | ||
| Line 1,586: | Line 1,938: | ||
===== Migration Rates After Migration Scenario 2 ===== | ===== Migration Rates After Migration Scenario 2 ===== | ||
[[File:PunjabMigIIASASCE2.png|900px]] | [[File:PunjabMigIIASASCE2.png|900px|PunjabMigIIASASCE2.png]] | ||
===== Population After Migration Scenario 2 ===== | ===== Population After Migration Scenario 2 ===== | ||
| Line 1,592: | Line 1,944: | ||
The second scenario improves population forecasts and Punjab's population is in line with what we see at IIASA. | The second scenario improves population forecasts and Punjab's population is in line with what we see at IIASA. | ||
[[File:PunjabPopIIASAMgSCE2.png|900px]] | [[File:PunjabPopIIASAMgSCE2.png|900px|PunjabPopIIASAMgSCE2.png]] | ||
==== Migration Scenario 3 ==== | |||
Punjab's migration rates are unchanged in the third scenario. | |||
===== Migration Rates After Migration Scenario 3 ===== | |||
[[File:PunjabMigIIASASCE3.png|900px|PunjabMigIIASASCE3.png]] | |||
===== Population After Migration Scenario 3 ===== | |||
[[File:PunjabPopIIASAMgSCE3 5.png|900px|PunjabPopIIASAMgSCE3 5.png]] | |||
=== Rajasthan === | === Rajasthan === | ||
| Line 1,640: | Line 2,004: | ||
===== Migration Rates After Migration Scenario 2 ===== | ===== Migration Rates After Migration Scenario 2 ===== | ||
[[File:RajasthanMigIIASASCE2.png|900px]] | [[File:RajasthanMigIIASASCE2.png|900px|RajasthanMigIIASASCE2.png]] | ||
===== Population After Migration Scenario 2 ===== | ===== Population After Migration Scenario 2 ===== | ||
| Line 1,646: | Line 2,010: | ||
The second scenario forecasts population to be closer to IIASA's population forecasts, but there is still a difference by about 4 million people. | The second scenario forecasts population to be closer to IIASA's population forecasts, but there is still a difference by about 4 million people. | ||
[[File:RajasthanPopIIASAMgSCE2.png|900px]] | [[File:RajasthanPopIIASAMgSCE2.png|900px|RajasthanPopIIASAMgSCE2.png]] | ||
==== Migration Scenario 3 Results ==== | |||
In the third and final scenario, Rajasthan's migration rates were tripled from the first scenario. | |||
===== Migration Rates After Migration Scenario 3 ===== | |||
[[File:RajasthanMigIIASASCE3.png|900px|RajasthanMigIIASASCE3.png]] | |||
===== Population After Migration Scenario 3 ===== | |||
[[File:RajasthanPopIIASAMgSCE3 5.png|900px|RajasthanPopIIASAMgSCE3 5.png]] | |||
=== Sikkim === | === Sikkim === | ||
| Line 1,658: | Line 2,034: | ||
==== Crude Birth Rates ==== | ==== Crude Birth Rates ==== | ||
CBRs are greater in the IFs model. | CBRs are greater in the IFs model. [[File:SikkimCBRIIASA.png|900px|SikkimCBRIIASA.png]] | ||
[[File:SikkimCBRIIASA.png|900px|SikkimCBRIIASA.png]] | |||
==== Crude Death Rates ==== | ==== Crude Death Rates ==== | ||
CDRs in the two models are close together from 2010 through 2050. After 2050, IIASA's CDRs are greater than IFs by an increasing margin. | CDRs in the two models are close together from 2010 through 2050. After 2050, IIASA's CDRs are greater than IFs by an increasing margin. [[File:SikkimCDRIIASA.png|900px|SikkimCDRIIASA.png]] | ||
==== Migration ==== | |||
[[File:SikkimMigIIASA.png|900px|SikkimMigIIASA.png]] | |||
==== Total Fertilty Rates ==== | ==== Total Fertilty Rates ==== | ||
| Line 1,680: | Line 2,052: | ||
==== Migration Scenario 1 Results ==== | ==== Migration Scenario 1 Results ==== | ||
===== Migration Rate After Migration Scenario 1 ===== | ===== Migration Rate After Migration Scenario 1[[File:SikkimMigIIASASCE.png|900px|SikkimMigIIASASCE.png]] ===== | ||
[[File: | ===== Population After Migration Scenario 1[[File:SikkimPopIIASAMgSCE.png|900px|SikkimPopIIASAMgSCE.png]] ===== | ||
==== | ==== Migration Scenario 2 Results ==== | ||
The inclusion of migration in the first scenario made population forecasts further away from IIASA's forecasts. Therefore, the migration parameter is turned off in the second scenario. | |||
==== Migration Scenario 2 | ===== Migration Rates After Migration Scenario 2[[File:SikkimMigIIASASCE2.png|900px|SikkimMigIIASASCE2.png]] ===== | ||
===== Population After Migration Scenario 2[[File:SikkimPopIIASAMgSCE2.png|900px|SikkimPopIIASAMgSCE2.png]] ===== | |||
==== Migration Scenario 3 Results ==== | |||
Sikkim's migration rates remain at zero in the third scenario. | |||
===== | ===== Migration Rates After Scenario 3[[File:SikkimMigIIASASCE3.png|900px|SikkimMigIIASASCE3.png]] ===== | ||
[[File: | ===== Population After Scenario 3[[File:SikkimPopIIASAMgSCE3 5.png|900px|SikkimPopIIASAMgSCE3 5.png]] ===== | ||
=== Tamil Nadu === | === Tamil Nadu === | ||
| Line 1,748: | Line 2,120: | ||
There is some push back in the model, which causes migration rates to increase from 2070 through 2085 and then decline again through the end of the time horizon. | There is some push back in the model, which causes migration rates to increase from 2070 through 2085 and then decline again through the end of the time horizon. | ||
[[File:TamilNaduMigIIASASCE2.png|900px]] | [[File:TamilNaduMigIIASASCE2.png|900px|TamilNaduMigIIASASCE2.png]] | ||
===== Population After Migration Scenario 2 ===== | ===== Population After Migration Scenario 2 ===== | ||
| Line 1,754: | Line 2,126: | ||
Tamil Nadu's population is improved in the second scenario and is close to IIASA's forecasts. | Tamil Nadu's population is improved in the second scenario and is close to IIASA's forecasts. | ||
[[File:TamilNaduPopIIASAMgSCE2.png|900px]] | [[File:TamilNaduPopIIASAMgSCE2.png|900px|TamilNaduPopIIASAMgSCE2.png]] | ||
==== Migration Scenario 3 Results ==== | |||
Tamil Nadu's migration rates are unchanged in the third scenario. | |||
===== Migration Rates After Migration Scenario 3 ===== | |||
[[File:TamilNaduMigIIASASCE3.png|900px|TamilNaduMigIIASASCE3.png]] | |||
===== Population After Migration Scenario 3 ===== | |||
[[File:TamilNaduPopIIASAMgSCE3 5.png|900px|TamilNaduPopIIASAMgSCE3 5.png]] | |||
=== Tripura === | === Tripura === | ||
| Line 1,786: | Line 2,170: | ||
[[File:TripuraTFRIIASA.png|900px|TripuraTFRIIASA.png]] | [[File:TripuraTFRIIASA.png|900px|TripuraTFRIIASA.png]] | ||
==== Migration Scenario Results ==== | ==== Migration Scenario 1 Results ==== | ||
===== Migration Rate After Migration Scenario ===== | ===== Migration Rate After Migration Scenario 1 ===== | ||
[[File:TripuraMigIIASASCE.png|900px|TripuraMigIIASASCE.png]] | [[File:TripuraMigIIASASCE.png|900px|TripuraMigIIASASCE.png]] | ||
===== Population After Migration Scenario ===== | ===== Population After Migration Scenario 1 ===== | ||
[[File:TripuraPopIIASAMgSCE.png|900px|TripuraPopIIASAMgSCE.png]] | [[File:TripuraPopIIASAMgSCE.png|900px|TripuraPopIIASAMgSCE.png]] | ||
=== | ==== Migration Scenario 2 Results ==== | ||
The inclusion of migration rates in the first scenario made population forecasts worse. Therefore, migration was removed for Tripura in the second scenario. | |||
===== Migration Rates After Migration Scenario 2 ===== | |||
[[File: | [[File:TripuraMigIIASASCE2.png|900px|TripuraMigIIASASCE2.png]] | ||
==== | ===== Population After Migration Scenario 2 ===== | ||
Migration is closer to IIASA, but population is forecast to be greater in the IFs model by about 1.25 million at the end of the time horizon. | |||
[[File: | [[File:TripuraPopIIASAMgSCE2.png|900px|TripuraPopIIASAMgSCE2.png]] | ||
==== | ==== Migration Scenario 3 ==== | ||
Despite IIASA's migration forecasts have a positive net inward migration in Tripura, Tripura's migration rates were lowered to -0.5 in 2014 in the third scenario. This was done to counteract the the lower death rates and higher birth rates in IFs as compared to IIASA. | |||
[[File:UttaranchalCDRIIASA.png|900px|UttaranchalCDRIIASA.png]] | ===== Migration Rates After Migration Scenario 3 ===== | ||
[[File:TripuraMigIIASASCE3.png|900px|TripuraMigIIASASCE3.png]] | |||
===== Population After Migration Scenario 3 ===== | |||
[[File:TripuraPopIIASAMgSCE3 5.png|900px|TripuraPopIIASAMgSCE3 5.png]] | |||
=== Uttaranchal === | |||
==== Population ==== | |||
IFs' forecast of Uttaranchal's population is greater than IIASA's by an increasing margin. By 2095, IFs' population forecast is about 7% greater than IIASA's | |||
[[File:UttaranchalPopIIASA.png|900px|UttaranchalPopIIASA.png]] | |||
==== Crude Birth Rate ==== | |||
There is a jump up in 2014 in IFs' CBR forecast when the model initializes. This jump produces a 25% difference between the two models. This difference declines until 2030, then there is an increase until 2045. From 2045 on the difference between the two models decreases until the end of the time horizon. IFs' forecasts of CBRs are greater than IIASA's for all years. | |||
[[File:UttaranchalCBRIIASA.png|900px|UttaranchalCBRIIASA.png]] | |||
==== Crude Death Rate ==== | |||
The two models start at different points, with the IFs model being about 20% greater than IIASA. By 2055, the two models' forecasts of CDRs converge and stay together until 2085. | |||
[[File:UttaranchalCDRIIASA.png|900px|UttaranchalCDRIIASA.png]] | |||
==== Migration ==== | ==== Migration ==== | ||
| Line 1,826: | Line 2,236: | ||
[[File:UttaranchalTFRIIASA.png|900px|UttaranchalTFRIIASA.png]] | [[File:UttaranchalTFRIIASA.png|900px|UttaranchalTFRIIASA.png]] | ||
==== Migration Scenario Results ==== | ==== Migration Scenario 1 Results ==== | ||
===== Migration Rate After Migration Scenario ===== | ===== Migration Rate After Migration Scenario 1 ===== | ||
[[File:UttaranchalMigIIASASCE.png|900px|UttaranchalMigIIASASCE.png]] | [[File:UttaranchalMigIIASASCE.png|900px|UttaranchalMigIIASASCE.png]] | ||
===== Population After Migration Scenario ===== | ===== Population After Migration Scenario 1 ===== | ||
[[File:UttaranchalPopIIASAMgSCE.png|900px|UttaranchalPopIIASAMgSCE.png]] | [[File:UttaranchalPopIIASAMgSCE.png|900px|UttaranchalPopIIASAMgSCE.png]] | ||
=== | ==== Migration Scenario 2 Results ==== | ||
==== Population ==== | The introduction of net inward migration in the first scenario pushed IFs population further away from IIASA's forecasts. Therefore, migration was removed from the model in the second scenario. | ||
===== Migration Rate After Migration Scenario 2 ===== | |||
[[File:UttaranchalMigIIASASCE2.png|900px|UttaranchalMigIIASASCE2.png]] | |||
===== Population After Migration Scenario 2 ===== | |||
Uttaranchal's population is closer to IIASA's in the second scenario without migration, but the population is still about 1.5 million greater than in IIASA's model. | |||
[[File:UttaranchalPopIIASAMgSCE2.png|900px|UttaranchalPopIIASAMgSCE2.png]] | |||
==== Migration Scenario 3 Results ==== | |||
Uttaranchal's migration rates are the same in third scenario as they were in the second. | |||
===== Migration Rates After Migration Scenario 3 ===== | |||
[[File:UttaranchalMigIIASASCE2.png|900px|UttaranchalMigIIASASCE2.png]] | |||
===== Population After Migration Scenario 3 ===== | |||
[[File:UttaranchalPopIIASAMgSCE3 5.png|900px|UttaranchalPopIIASAMgSCE3 5.png]] | |||
=== Uttar Pradesh === | |||
==== Population ==== | |||
IFs forecast of population in Uttar Pradesh is greater than IIASA's by an increasing margin. By 2095, Uttar Pradesh is forecast to have about 80 million more people in the IFs forecasts. | IFs forecast of population in Uttar Pradesh is greater than IIASA's by an increasing margin. By 2095, Uttar Pradesh is forecast to have about 80 million more people in the IFs forecasts. | ||
| Line 1,844: | Line 2,280: | ||
[[File:UttarPradeshPopIIASA.png|900px|UttarPradeshPopIIASA.png]] | [[File:UttarPradeshPopIIASA.png|900px|UttarPradeshPopIIASA.png]] | ||
==== Crude Birth Rates ==== | ==== Crude Birth Rates ==== | ||
IFs' forecast of CBRs in Uttar Pradesh is greater than IIASA's for all years by a shifting margin. The difference between the two model's peaks in 2025 with about a 19% difference. By the end of the time horizon in 2095, the two models are almost the same. IIASA's CBRs are forecast to decline steadily. | |||
[[File:UttarPradeshCBRIIASA.png|900px|UttarPradeshCBRIIASA.png]] | |||
==== Crude Death Rates ==== | |||
There is a jump up in CDRs in 2014 in the IFs model when the model initializes. From 2010 through 2040 IFs' forecasts of CDRs are greater than IIASA's by a decreasing margin. From 2040 through the end of the time horizon, the two models are about the same. | |||
[[File:UttarPradeshCDRIIASA.png|900px|UttarPradeshCDRIIASA.png]] | |||
==== Migration ==== | |||
[[File:UttarPradeshMigIIASA.png|900px|UttarPradeshMigIIASA.png]] | |||
==== Total Fertility Rates ==== | |||
IFs' TFR is greater than IIASA by about 0.3 in 2010. Both models steadily decline and reach about 1.9 by 2050 through the end of the time horizon. | |||
[[File:UttarPradeshTFRIIASA.png|900px|UttarPradeshTFRIIASA.png]] | |||
==== Migration Scenario 1 Results ==== | |||
===== Migration Rate After Migration Scenario 1 ===== | |||
[[File:UttarPradeshMigIIASASCE.png|900px|UttarPradeshMigIIASASCE.png]] | |||
===== Population After Migration Scenario 1 ===== | |||
[[File:UttarPradeshPopIIASAMgSCE.png|900px|UttarPradeshPopIIASAMgSCE.png]] | |||
==== Migration Scenario 2 Results ==== | |||
The first migration scenario was not aggressive enough to bring population in IFs down sufficiently. Therefore, the migration rates for Uttar Pradesh were doubled in the second scenario. | |||
===== Migration Rates After Migration Scenario 2 ===== | |||
There was some model push back on migration rates towards the end of the time horizon. | |||
[[File:UttarPradeshMigIIASASCE2.png|900px|UttarPradeshMigIIASASCE2.png]] | |||
===== Population After Migration Scenario 2 ===== | |||
Population forecasts in the second scenario are almost identical to IIASA's. | |||
[[File:UttarPradeshPopIIASAMgSCE2.png|900px|UttarPradeshPopIIASAMgSCE2.png]] | |||
==== Migration Scenario 3 Results ==== | |||
Uttar Pradesh's migration rates are unchanged in the third scenario from the second. | |||
===== Migration Rates After Migration Scenario 3 ===== | |||
[[File:UttarPradeshMigIIASASCE3.png|900px|UttarPradeshMigIIASASCE3.png]] | |||
===== Population After Migration Scenario 3 ===== | |||
[[File:UttarPradeshPopIIASAMgSCE3 5.png|900px|UttarPradeshPopIIASAMgSCE3 5.png]] | |||
=== West Bengal === | |||
==== Population ==== | |||
IFs' population forecast of West Bengal is greater than IIASA's by an increasing margin. By 2095, IFs forecasts about 15 million more people in West Bengal than in the IIASA model. | |||
[[File:WestBengalPopIIASA.png|900px|WestBengalPopIIASA.png]] | |||
==== Crude Birth Rates ==== | |||
IFs forecasts CBRs to be greater than IIASA's forecast by about 2 births per thousand. | |||
[[File:WestBengalCBRIIASA.png|900px|WestBengalCBRIIASA.png]] | |||
==== Crude Death Rates ==== | |||
There is a spike in CDRs in the IFs model in 2014, when the model initializes. From 2020 on the IIASA model's CDRs are greater than the IFs model. | |||
[[File:WestBengalCDRIIASA.png|900px|WestBengalCDRIIASA.png]] | |||
==== Migration ==== | |||
[[File:WestBengalMigIIASA.png|900px|WestBengalMigIIASA.png]] | |||
==== Total Fertility Rates ==== | |||
IFs and IIASA's TFR are about the same for the first few years until 2020. After 2020, IIASA declines below IFs by about 0.2 and then rises. IFs' forecasts of TFR steadily increase from 2010 through the end of time horizon where TFR approaches by does not reach 1.9. IIASA's forecast of TFR reaches 1.72 by 2095. | |||
[[File:WestBengalTFRIIASA.png|900px|WestBengalTFRIIASA.png]] | |||
==== Migration Scenario 1 Results ==== | |||
===== Migration Rate After Migration Scenario 1 ===== | |||
[[File:WestBengalMigIIASASCE.png|900px|WestBengalMigIIASASCE.png]] | |||
===== Population After Migration Scenario 1 ===== | |||
[[File:WestBengalPopIIASAMgSCE.png|900px|WestBengalPopIIASAMgSCE.png]] | |||
==== Migration Scenario 2 Results ==== | |||
The introduction of migration rates in the model with the first scenario made the population forecasts larger and further from the desired value. Therefore, the migration parameter was removed in the second scenario. | |||
===== Migration Rates After Migration Scenario 2 ===== | |||
[[File:WestBengalMigIIASASCE2 5.png|900px|WestBengalMigIIASASCE2 5.png]] | |||
===== Population After Migration Scenario 2 ===== | |||
Population is too high, with about 10 million more people than IIASA at the end of the time horizon. | |||
[[File:WestBengalPopIIASAMgSCE2 5.png|900px|WestBengalPopIIASAMgSCE2 5.png]] | |||
==== Migration Scenario 3 Results ==== | |||
Although IIASA forecasts net inward migration, migration rates in West Bengal were lowered to -0.5 in 2014 in the third scenario. This is to offset the lower deaths and higher births in the IFs model versus the IIASA model to bring population inline with IIASA's forecasts. | |||
===== Migration Rates After Scenario 3 ===== | |||
[[File:WestBengalMigIIASASCE3.png|900px|WestBengalMigIIASASCE3.png]] | |||
===== Population After Migration Scenario 3 ===== | |||
[[File:WestBengalPopIIASAMgSCE3 5.png|900px|WestBengalPopIIASAMgSCE3 5.png]] | |||
= Economy Module = | |||
== India's GDP == | |||
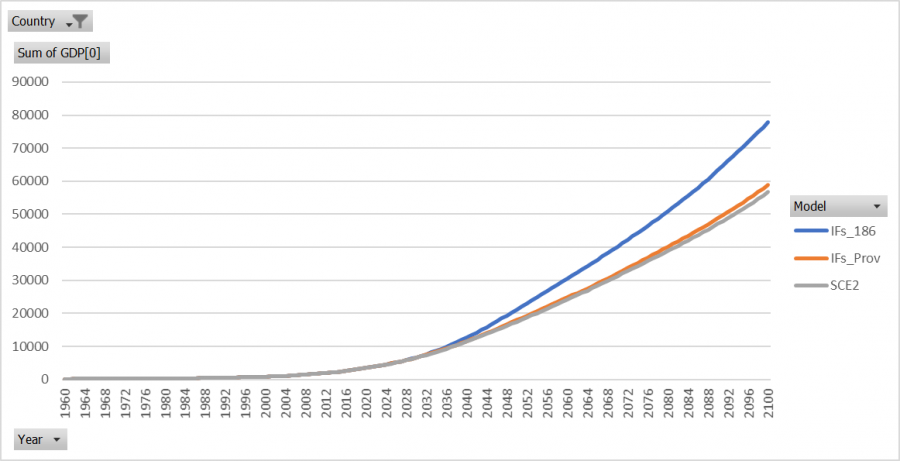
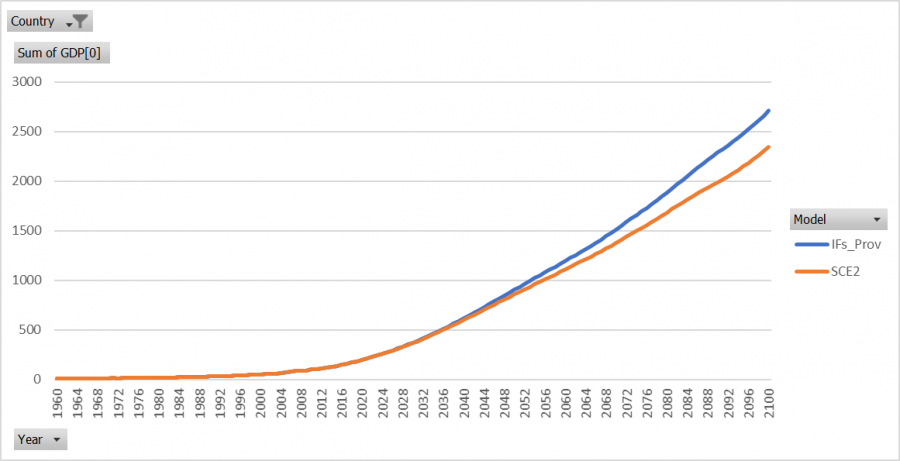
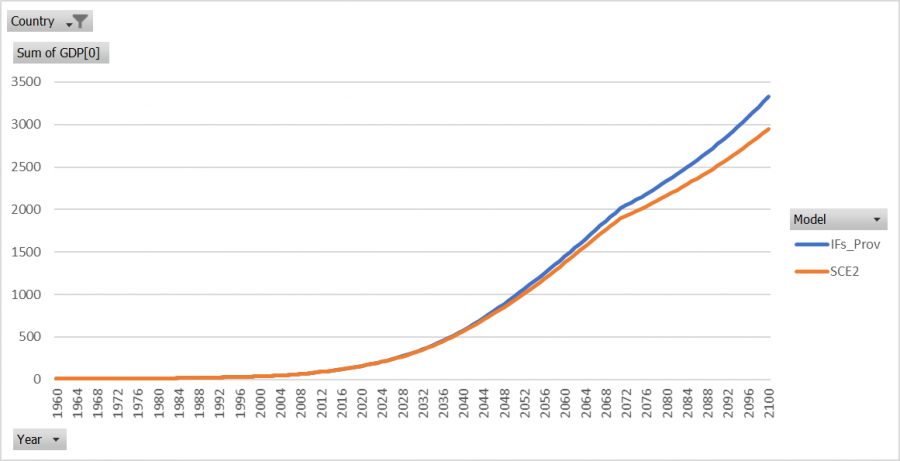
India's GDP in the provincial model is significantly lower than in the 186 model. This has been a problem since the beginning of this project, but the problem has gotten significantly worse after data updates and the inclusion of new series in spring of 2017. | |||
[[File:IndiaGDPSCE2 5.png|900px|IndiaGDPSCE2 5.png]] | |||
=== Andaman and Nicobar Islands's GDP === | |||
[[File:AndamanandNicobarIsGDPSCE2.png|900px|AndamanandNicobarIsGDPSCE2.png]] | |||
=== Andhra Pradesh's GDP === | |||
[[File:AndhraPradeshGDPSCE2.png|900px|AndhraPradeshGDPSCE2.png]] | |||
=== Arunanchal Pradesh's GDP === | |||
[[File:ArunanchalPradeshGDPSCE2.png|900px|ArunanchalPradeshGDPSCE2.png]] | |||
=== Assam's GDP === | |||
[[File:AssamGDPSCE2.png|900px|AssamGDPSCE2.png]] | |||
=== Bihar's GDP === | |||
[[File:BiharGDPSCE2.png|900px|BiharGDPSCE2.png]] | |||
=== Chandigarh's GDP === | |||
[[File:ChandigarhGDPSCE2 5.png|900px|ChandigarhGDPSCE2 5.png]] | |||
=== Chhatisgarh's GDP === | |||
[[File:ChhatisgarhGDPSCE2.png|900px|ChhatisgarhGDPSCE2.png]] | |||
=== Dadra and Nagar Haveli's GDP === | |||
[[File:DadraandNagarHaveliGDPSCE2.png|900px|DadraandNagarHaveliGDPSCE2.png]] | |||
=== Daman and Diu's GDP === | |||
[[File:DamanandDiuGDPSCE2.png|900px|DamanandDiuGDPSCE2.png]] | |||
=== Delhi's GDP === | |||
[[File:DelhiGDPSCE2.png|900px|DelhiGDPSCE2.png]] | |||
=== Goa's GDP === | |||
[[File:GoaGDPSCE2.png|900px|GoaGDPSCE2.png]] | |||
=== Gujarat's GDP === | |||
[[File:GujaratGDPSCE2.png|900px|GujaratGDPSCE2.png]] | |||
=== Haryana's GDP === | |||
[[File:HaryanaGDPSCE2.png|900px|HaryanaGDPSCE2.png]] | |||
=== Himachal Pradesh's GDP === | |||
[[File:HimachalPradeshGDPSCE2.png|900px|HimachalPradeshGDPSCE2.png]] | |||
=== Jammu and Kashmir's GDP === | |||
[[File:JammuKashmirGDPSCE2.png|900px|JammuKashmirGDPSCE2.png]] | |||
=== Jharkhand's GDP === | |||
[[File:JharkhandGDPSCE2.png|900px|JharkhandGDPSCE2.png]] | |||
=== Karnataka's GDP === | |||
[[File:KarnatakaGDPSCE2.png|900px|KarnatakaGDPSCE2.png]] | |||
=== Kerala's GDP === | |||
[[File:KeralaGDPSCE2.png|900px|KeralaGDPSCE2.png]] | |||
=== Lakshadweep's GDP === | |||
[[File:LakshadweepGDPSCE2.png|900px|LakshadweepGDPSCE2.png]] | |||
=== Madhya Pradesh's GDP === | |||
[[File:MadhyaPradeshGDPSCE2.png|900px|MadhyaPradeshGDPSCE2.png]] | |||
=== Maharashtra's GDP === | |||
[[File:MaharashtraGDPSCE2.png|900px|MaharashtraGDPSCE2.png]] | |||
=== Manipur's GDP === | |||
[[File:ManipurGDPSCE2.png|900px|ManipurGDPSCE2.png]] | |||
=== Meghalaya's GDP === | |||
[[File:MeghalayaGDPSCE2.png|900px|MeghalayaGDPSCE2.png]] | |||
=== Mizoram's GDP === | |||
[[File:MizoramGDPSCE2.png|900px|MizoramGDPSCE2.png]] | |||
=== Nagaland's GDP === | |||
[[File:NagalandGDPZCE2.png|900px|NagalandGDPZCE2.png]] | |||
=== Orissa's GDP === | |||
[[File:OrissaGDPSCE2.png|900px|OrissaGDPSCE2.png]] | |||
=== Pondicherry's GDP === | |||
[[File:PondicherryGDPSCE2.png|900px|PondicherryGDPSCE2.png]] | |||
=== Punjab's GDP === | |||
[[File:PunjabGDPSCE2.png|900px|PunjabGDPSCE2.png]] | |||
=== Rajasthan's GDP === | |||
[[File:RajasthanGDPSCE2.png|900px|RajasthanGDPSCE2.png]] | |||
=== Sikkim's GDP === | |||
[[File:SikkimGDPSCE2.png|900px|SikkimGDPSCE2.png]] | |||
=== Tamil Nadu's GDP === | |||
[[File:TamilNaduGDPSCE2.png|900px|TamilNaduGDPSCE2.png]] | |||
=== Telangana's GDP === | |||
[[File:TelanganaGDPSCE2.png|900px|TelanganaGDPSCE2.png]] | |||
=== Tripura's GDP === | |||
[[File:TripuraGDPSCE2.png|900px|TripuraGDPSCE2.png]] | |||
=== Uttaranchal's GDP === | |||
[[File:UttaranchalGDPSCE2.png|900px|UttaranchalGDPSCE2.png]] | |||
=== Uttar Pradesh's GDP === | |||
[[File:UttarPradeshGDPSCE2.png|900px|UttarPradeshGDPSCE2.png]] | |||
=== West Bengal's GDP === | |||
[[File:WestBengalGDPSCE2.png|900px|WestBengalGDPSCE2.png]] | |||
== India's GDP per Capita == | |||
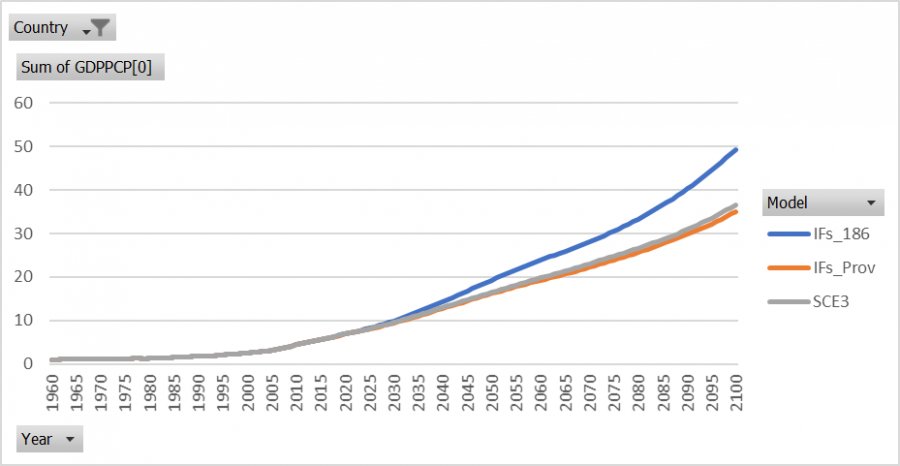
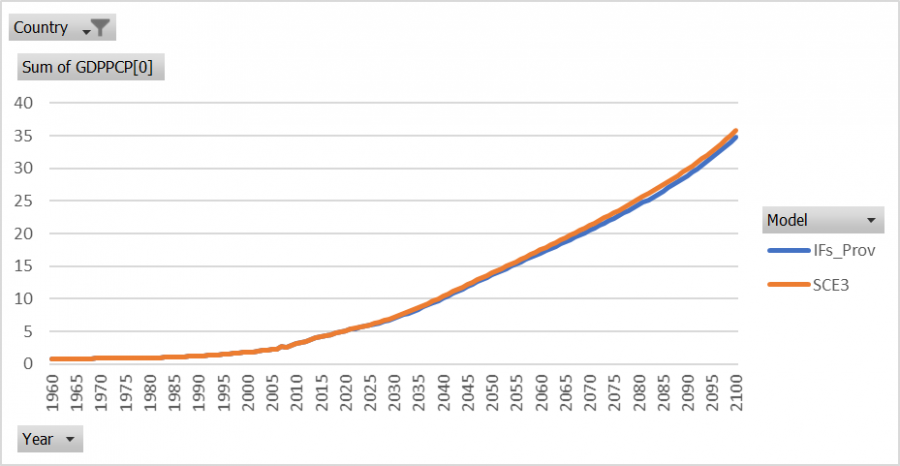
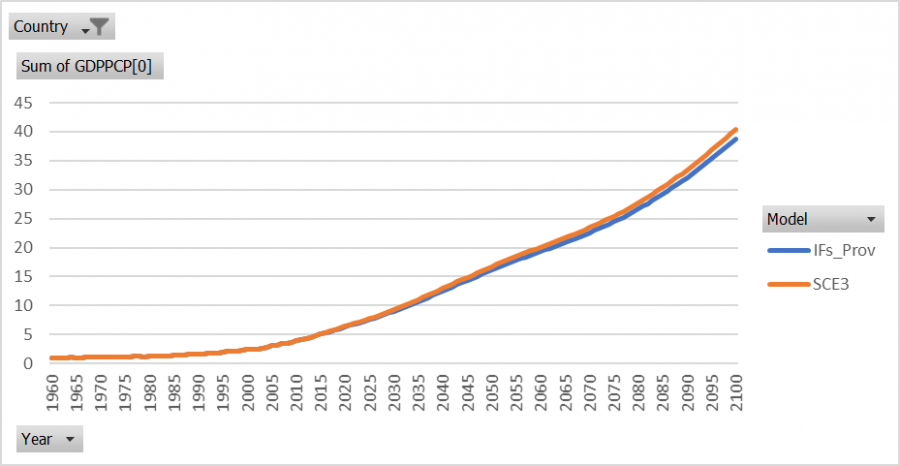
[[File:IndiaGDPPCSCE3.png|900px|IndiaGDPPCSCE3.png]] | |||
=== Andaman and Nicobar Island's GDP per Capita === | |||
[[File:AndamanandNicobarIsGDPPCSCE3.png|900px|AndamanandNicobarIsGDPPCSCE3.png]] | |||
=== Andhra Pradesh's GDP per Capita === | |||
[[File:AndhraPradeshGDPPCSCE3.png|900px|AndhraPradeshGDPPCSCE3.png]] | |||
=== Arunanchal Pradesh's GDP per Capita === | |||
[[File:AruananchalPradeshGDPPCSCE3.png|900px|AruananchalPradeshGDPPCSCE3.png]] | |||
=== Assam's GDP per Capita === | |||
[[File:AssamGDPPCSCE3.png|900px|AssamGDPPCSCE3.png]] | |||
=== Bihar's GDP per Capita === | |||
[[File:BiharGDPPCSCE3.png|900px|BiharGDPPCSCE3.png]] | |||
=== Chandigarh's GDP per Capita === | |||
This halving of GDP per capit appears dramatic, but Chandigarh's population is quite low and was increased by a significant proportion in the scenario. | |||
[[File:ChandigarhGDPPCSCE3.png|900px|ChandigarhGDPPCSCE3.png]] | |||
=== Chhatisgarh's GDP per Capita === | |||
[[File:ChhatisgarhGDPPCSCE3.png|900px|ChhatisgarhGDPPCSCE3.png]] | |||
=== Dadra and Nagar Haveli's GDP per Capita === | |||
[[File:DadraandNagarHaveliGDPPCSCE3.png|900px|DadraandNagarHaveliGDPPCSCE3.png]] | |||
=== Daman and Diu's GDP per Capita === | |||
[[File:DamanandDiuGDPPCSCE3.png|900px|DamanandDiuGDPPCSCE3.png]] | |||
=== Delhi's GDP per Capita === | |||
[[File:DelhiGDPPCSCE3.png|900px|DelhiGDPPCSCE3.png]] | |||
=== Goa's GDP per Capita === | |||
[[File:GoaGDPPCSCE3.png|900px|GoaGDPPCSCE3.png]] | |||
=== Gujarat's GDP per Capita === | |||
[[File:GujaratGDPPCSCE3.png|900px|GujaratGDPPCSCE3.png]] | |||
=== Haryana's GDP per Capita === | |||
[[File:HaryanaGDPPCSCE3.png|900px|HaryanaGDPPCSCE3.png]] | |||
=== Himachal Pradesh's GDP per Capita === | |||
[[File:HimachalPradeshGDPPCSCE3.png|900px|HimachalPradeshGDPPCSCE3.png]] | |||
=== Jammu and Kashmir's GDP per Capita === | |||
[[File:JammuKashmirGDPPCSCE3.png|900px|JammuKashmirGDPPCSCE3.png]] | |||
=== Jharkhand's GDP per Capita === | |||
[[File:JharkhandGDPPCSCE3.png|900px|JharkhandGDPPCSCE3.png]] | |||
=== Karnataka's GDP per Capita === | |||
[[File:KarnatakaGDPPCSCE3.png|900px|KarnatakaGDPPCSCE3.png]] | |||
=== Kerala's GDP per Capita === | |||
[[File:KeralaGDPPCSCE3.png|900px|KeralaGDPPCSCE3.png]] | |||
=== Lakshadweep's GDP per Capita === | |||
[[File:LakshadweepGDPPCSCE3.png|900px|LakshadweepGDPPCSCE3.png]] | |||
=== Madhya Pradesh's GDP per Capita === | |||
[[File:MadhyaPradeshGDPPCSCE3.png|900px|MadhyaPradeshGDPPCSCE3.png]] | |||
=== Maharashtra's GDP per Capita === | |||
[[File:MaharashtraGDPPCSCE3.png|900px|MaharashtraGDPPCSCE3.png]] | |||
=== Manipur's GDP per Capita === | |||
[[File:ManipurGDPPCSCE3.png|900px|ManipurGDPPCSCE3.png]] | |||
=== Meghalaya's GDP per Capita === | |||
[[File:MeghalayaGDPPCSCE3.png|900px|MeghalayaGDPPCSCE3.png]] | |||
=== Mizoram's GDP per Capita === | |||
[[File:MizoramGDPPCSCE3.png|900px|MizoramGDPPCSCE3.png]] | |||
=== Nagaland's GDP per Capita === | |||
[[File:NagalandGDPPCSCE3.png|900px|NagalandGDPPCSCE3.png]] | |||
=== Orissa's GDP per Capita === | |||
[[File:OrissaGDPPCSCE3.png|900px|OrissaGDPPCSCE3.png]] | |||
=== Pondicherry's GDP per Capita === | |||
[[File:PondicherryGDPPCSCE3.png|900px|PondicherryGDPPCSCE3.png]] | |||
=== Punjab's GDP per Capita === | |||
[[File:PunjabGDPPCSCE3.png|900px|PunjabGDPPCSCE3.png]] | |||
=== Rajasthan's GDP per Capita === | |||
[[File:RajasthanGDPPCSCE3.png|900px|RajasthanGDPPCSCE3.png]] | |||
=== Sikkim's GDP per Capita === | |||
[[File:SikkimGDPPCSCE3.png|900px|SikkimGDPPCSCE3.png]] | |||
=== Tamil Nadu's GDP per Capita === | |||
[[File:TamilNaduGDPPCSCE3.png|900px|TamilNaduGDPPCSCE3.png]] | |||
=== Telangana's GDP per Capita === | |||
[[File:TelanganaGDPPCSCE3.png|900px|TelanganaGDPPCSCE3.png]] | |||
=== Tripura's GDP per Capita === | |||
[[File:TripuraGDPPCSCE3.png|900px|TripuraGDPPCSCE3.png]] | |||
=== Uttaranchal's GDP per Capita === | |||
[[File:UttaranchalGDPPCSCE3.png|900px|UttaranchalGDPPCSCE3.png]] | |||
=== Uttar Pradesh's GDP per Capita === | |||
[[File:UttarPradeshGDPPCSCE3.png|900px|UttarPradeshGDPPCSCE3.png]] | |||
=== West Bengal's GDP per Capita === | |||
[[File:WestBengalGDPPCSCE3.png|900px|WestBengalGDPPCSCE3.png]] | |||
== Value Added == | |||
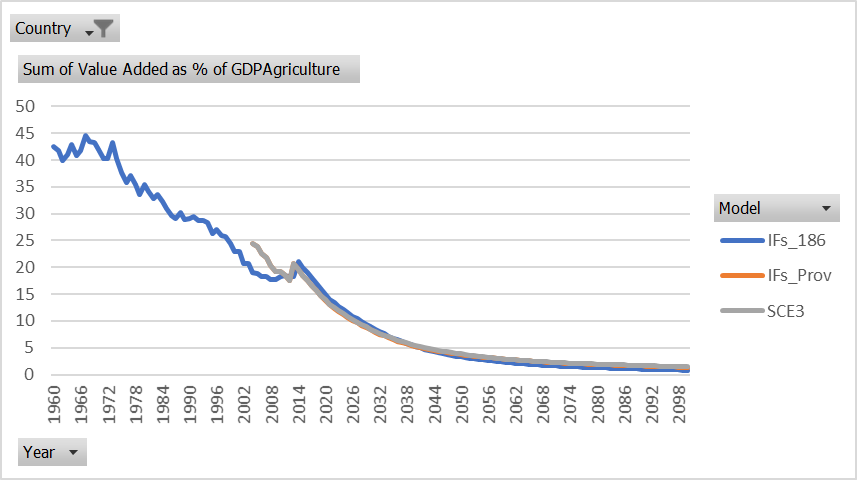
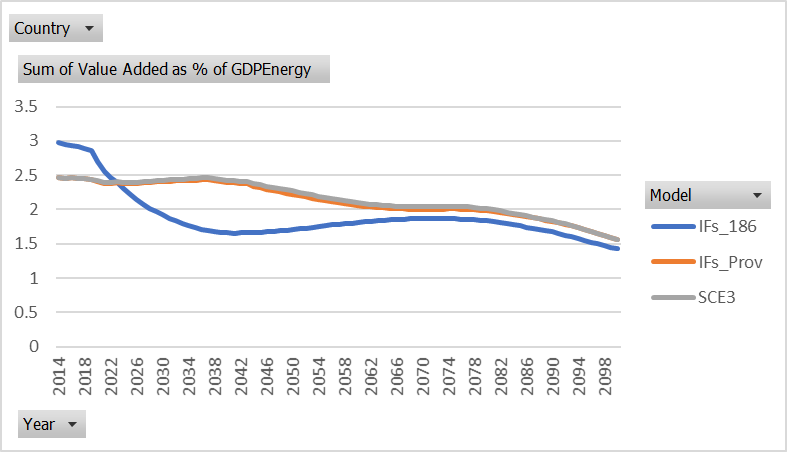
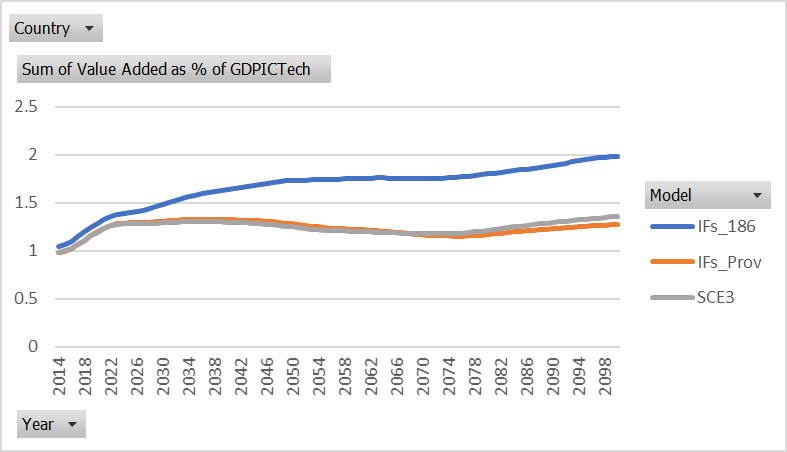
Value added is not the same in the provincial model as it is in the 186 model. The historical data has been carefully vetted and is normalized to the 186 model using ''ApplyMultAll. ''The normalization should prevent historical differences between the provincial and 186 models, but the process does not appear to be working properly. | |||
=== Value Added in Agriculture === | |||
Although the historical data does not match, the forecasts appear to be about the same in all versions. | |||
[[File:IndiaVaddAgSCE3.png|900px|IndiaVaddAgSCE3.png]] | |||
=== Value Added in Energy === | |||
There is not any historical data for this series in either model. The models start at different points and have different behavior throughout the forecasts. The 186 model forecasts a sharp decline from 2014 through 2030, whereas, the provincial model forecasts less change in value added in energy. | |||
[[File:IndiaVaddEnSCE3.png|900px|IndiaVaddEnSCE3.png]] | |||
=== Value Added in ICT === | |||
There is a lack of historical data in ICT. The 186 version of IFs forecasts a steady increase in value added through the end of the time horizon, whereas the provincial model forecasts are relatively flat and decline from 2020 through 2070. | |||
[[File:IndiaVaddICTSCE3.png|900px|IndiaVaddICTSCE3.png]] | |||
=== Value Added in Manufacturing === | |||
The historical data in the two models are close, but not identical. IFs pushes value added in manufacturing up dramatically after model initialization in both the 186 and provincial models. The forecasts are similar with the provincial model declining steadily through the forecasts. | |||
[[File:IndiaVaddManSCE3.png|900px|IndiaVaddManSCE3.png]] | |||
=== Value Added in Materials === | |||
Value added in materials is forecast to increase as a greater proportion of GDP in the 186 model than in the provincial model over time. | |||
[[File:IndiaMFPMatSCE3 5.png|900px|IndiaMFPMatSCE3 5.png]] | |||
=== Value Added in Services === | |||
The historical data does not match, but it is close. There is a drop at model initialization in the 186 model that does not occur in the provincial model. The two models are close in both history and forecast. | |||
=== [[File:IndiaVaddSerSCE3.png|900px|IndiaVaddSerSCE3.png]] === | |||
== Government Consumption == | |||
All government consumption data is normalized in the model using ''ApplyMultAll'' and yet the historical values in the 186 model and the provincial model do not match. | |||
=== Government Consumption in Education === | |||
Education spending is much higher in the provincial historical data and declines to values closer to the 186 model. | |||
[[File:IndiaGDSEdSCE3.png|900px|IndiaGDSEdSCE3.png]] | |||
=== Government Consumption in Health === | |||
Health spending is historically greater than the 186 model and is forecast to increase by a greater margin. India's health spending appears to be significantly lower than the rest of the world's, even when comparing the provincial data. | |||
[[File:IndiaGDSHealthSCE3.png|900px|IndiaGDSHealthSCE3.png]] | |||
=== Government Consumption in Infrastructure === | |||
There is not any historical data in the provincial model for infrastructure spending. Both models have a high peak at model initialization and then the proportion of government consumption relative to GDP is forecast to decline over time, with both models quite close together. | |||
[[File:IndiaGDSInfraSCE3.png|900px|IndiaGDSInfraSCE3.png]] | |||
=== Government Consumption in InfraOther === | |||
The two models have the same starting point in 2014, but there is a forecast decline in the provincial model until around 2025. The 186 model steadily increases through the end of the time horizon. | |||
[[File:IndiaGDSInfraOtherSCE3 5.png|900px|IndiaGDSInfraOtherSCE3 5.png]] | |||
=== Government Consumption in Military === | |||
The provincial model starts at the same point as the 186 model in 2014, but is forecast to decline until around 2025. The 186 forecasts are relatively flat, but are increasing when the provincial model is decreasing and then decreasing when the provincial model is increasing. | |||
[[File:IndiaGDSMilSCE3.png|900px|IndiaGDSMilSCE3.png]] | |||
=== Government Consumption in Research and Development === | |||
The two models start at the same point in 2014, but the provincial model is forecast to see a decline in the proportion of R & D spending relative to GDP in the first few years of forecast. After 2025, the provincial model forecasts growing R & D spending, but the growth does not out pace the 186 models' growth by enough to reach the same amount of spending. | |||
[[File:IndiaGDSInfraOtherSCE3.png|900px|IndiaGDSInfraOtherSCE3.png]] | |||
=== Government Consumption in Other === | |||
There is a significant proportion of spending relative to GDP that is attributed to the Other category in the provincial model. This is in contrast to the 186 model that forecasts a much lower amount. | |||
[[File:IndiaGDSOtherSCE3.png|900px|IndiaGDSOtherSCE3.png]] | |||
== MultiFactor Productivity == | |||
The dramatic difference in India's provincial GDP as compared to the 186 model appears to be driven by MFP, and more specifically, physical capital's contribution to annual growth. | |||
=== MultiFactor Productivity in Agriculture === | |||
MFP in agriculture is about the same in all models at model initialization in 2014, but the three versions diverge. Overall, the difference is relatively small. | |||
[[File:IndiaMFPAGSCE3.png|900px|IndiaMFPAGSCE3.png]] | |||
=== MultiFactor Productivity in Energy === | |||
[[File:IndiaMFPEnSCE3 5.png|900px|IndiaMFPEnSCE3 5.png]] | |||
=== MultiFactor Productivity in ICT === | |||
[[File:IndiaMFPICTSCE3.png|900px|IndiaMFPICTSCE3.png]] | |||
=== MultiFactor Productivity in Materials === | |||
[[File:IndiaMFPMatSCE3 5.png|900px|IndiaMFPMatSCE3 5.png]] | |||
=== MultiFactor Productivity in Manufacturing === | |||
[[File:IndiaMFPMatSCE3.png|900px|IndiaMFPMatSCE3.png]] | |||
=== MultiFactor Productivity in Services === | |||
[[File:IndiaMFPServSCE3.png|900px|IndiaMFPServSCE3.png]] | |||
=== Total MultiFactor Productivity === | |||
[[File:IndiaMFPTotalSCE3.png|900px|IndiaMFPTotalSCE3.png]] | |||
=== Growth Accounting === | |||
==== Capital ==== | |||
===== Capital in the Provincial Model ===== | |||
[[File:IndiaGACapitalProv.png|900px|IndiaGACapitalProv.png]] | |||
===== Capital in the 186 Model ===== | |||
[[File:IndiaGACapital.png|900px|IndiaGACapital.png]] | |||
==== Labor ==== | |||
Labor's contribution to growth is greater in agriculture and services in the provincial model. | |||
===== Labor in the Provincial Model ===== | |||
[[File:IndiaGALaborProv.png|900px|IndiaGALaborProv.png]] | |||
===== Labor in the 186 Model ===== | |||
[[File:IndiaGALabor186.png|900px|IndiaGALabor186.png]] | |||
==== MultiFactor Productivity ==== | |||
MFP is lower in the provincial model than in the 186 model. | |||
===== MFP in the Provincial Model ===== | |||
[[File:IndiaGAMFPProv.png|900px|IndiaGAMFPProv.png]] | |||
===== MFP in the 186 Model ===== | |||
[[File:IndiaGAMFP186.png|900px|IndiaGAMFP186.png]] | |||
==== Technology Base MFP ==== | |||
===== Technology Base MFP in the Provincial Model ===== | |||
[[File:IndiaGATechMFPProv.png|900px|IndiaGATechMFPProv.png]] | |||
===== Technology Base MFP in the 186 Model ===== | |||
[[File:IndiaGATechMFP186.png|900px|IndiaGATechMFP186.png]] | |||
==== Knowledge Base MFP ==== | |||
The Knowledge Base MFP is greater in the 186 model. | |||
==== | ===== Knowledge Base MFP in the Provincial Model ===== | ||
[[File: | [[File:IndiaGAKnowledgeMFPProv.png|900px|IndiaGAKnowledgeMFPProv.png]] | ||
==== | ===== Knowledge Base MFP in the 186 Model ===== | ||
[[File:IndiaGAKnowledgeMFP186.png|900px|IndiaGAKnowledgeMFP186.png]] | |||
==== Human Capital MFP ==== | |||
==== | ===== Human Capital MFP in the Provincial Model ===== | ||
[[File:IndiaGAHumanCapitalMFPProv.png|900px|IndiaGAHumanCapitalMFPProv.png]] | |||
===== Human Capital MFP in the 186 Model ===== | |||
[[File:IndiaGAHumanCapitalMFP186.png|900px|IndiaGAHumanCapitalMFP186.png]] | |||
==== Social Capital MFP ==== | |||
Social Capital is significantly different between the two models. | |||
==== | ===== Social Capital MFP in the Provincial Model ===== | ||
[[File:IndiaGASocialCapitalMFPProv.png|900px|IndiaGASocialCapitalMFPProv.png]] | |||
===== Social Capital MFP in the 186 ===== | |||
[[File:IndiaGASocialCapitalMFP186.png|900px|IndiaGASocialCapitalMFP186.png]] | |||
==== Physical Capital MFP ==== | |||
Physical capital is negative in the provincial model, with the exception of ICT at the end of the time horizon. The 186 model is positive from 2020 through 2060. | |||
==== | ===== Physical Capital MFP in the Provincial Model ===== | ||
[[File:IndiaGAPhysicalCapMFPProv.png|900px|IndiaGAPhysicalCapMFPProv.png]] | |||
===== Physical Capital in the 186 Model ===== | |||
[[File:IndiaGAPhysicalCapMFP186.png|900px|IndiaGAPhysicalCapMFP186.png]] | |||
==== Correction MFP ==== | |||
There is a large disparity between the two models in Agriculture and ICTech. | |||
===== Correction MFP in the Provincial Model ===== | |||
[[File: | [[File:IndiaGACorrectionProv.png|900px|IndiaGACorrectionProv.png]] | ||
==== | ===== Correction MFP in the 186 Model ===== | ||
[[File:IndiaGACorrection186.png|900px|IndiaGACorrection186.png]] | |||
== Foreign Direct Investment == | |||
There is not any provincial historical data for FDI in India, but the model appears to estimate historical data for all of the provinces based upon the 186 model. The forecasts are less than the 186 after 2050. | |||
[[File: | [[File:IndiaFDISCE3.png|900px]] | ||
Latest revision as of 22:16, 3 July 2017
Overview
India's sub-regional model has a total of 69 preprocessor series. Although there are 652 preprocessor series in the IFs model, there are many that are not applicable to sub-regional models or do not significantly impact forecasts. Therefore, only 355 preprocessor series are sought for sub-regionalization. Thus India's sub-regional model has nearly 19.4% coverage at this point. There are a 31 preprocessor series that have been identified that could be pulled into the model. If this data was to be pulled the the total coverage of the model would increase to nearly 28.2%.
| IFs Module | Series Pulled | Total Series Pulled | Coverage |
| Population | 8 | 8 | 100% |
| Economy | 24 | 55 | 43.6% |
| Agriculture | 8 | 36 | 22.2% |
| Education | 17 | 91 | 18.7% |
| Energy | 4 | 66 | 6.1% |
| Socio-Political | 3 | 12 | 25% |
| Infrastructure | 0 | 21 | 0% |
| Environment | 0 | 9 | 0% |
| Health | 5 | 57 | 8.8% |
| Total | 69 | 355 | 19.4% |
| Potential Coverage | 100 | 355 | 28.2% |
The population module is completely covered, however there are some problems with migration which are detailed in the population section. The economy module has the second highest module coverage in the India sub-national module with almost 44% coverage. Infrastructure, Environment, Energy, and Health are areas of relative weakness in the model. Of the potential preprocessor series, most are in the infrastructure and agricultural modules. Therefore, infrastructure's coverage could be improved significantly.
Population Module
IFs population module may have some problems in sub-regional migration, that require further research in the future. Migration is an exogenous variable based upon UNPD forecasts of net migration rates in the model. In the case of sub-regional models it is difficult to find sub-regional forecasts of migration. IIASA was generous enough to grant the Pardee Center access to their preliminary migration forecasts for the states and union territories of India, which has resolved the issue of access to reliable forecasts. Additionally, there is two errors that occur when the model is broken out with sub-regional migration forecast data. The first is this:
Followed by this error:
In IFsHistSeries.mdb the ForecastNetMigrationUNPD table and the ForecastNetMigrationRateUNPD table are filled with zeroes where the data should be nulls for all sub-regions. This may be part of the cause of the error. The error may be caused by the logic for migration, where foreign population is a function of migration. There may be some limitations to the amount of intranational migration based upon the aggregated foreign population for a given country. This is only conjecture and requires further analysis in the future.
Due to the errors that occur when the model is broken out with subnational migration data, migration forecasts are not included in the model's breakout. This leaves population forecasts unimpacted by migration and all provincial migration rates are zero in the base case. A scenario is used to calibrate IFs' population forecasts in India to introduce migration to the model without causing model error.
Model Vetting Using IIASA's India Model
India's subnational population was rigorously vetted and one of the tools available was subnational population forecasts that were developed by IIASA. These forecasts were compared with each state and territory in India, as were the components of these forecasts. The components include births, deaths, and migration. Below is a state-by-state comparison of the IFs base case (without migration) with IIASA's forecasts for population, births, deaths, and migration.
This comparison is followed by graphs that document population model calibration. First migration rates and then population for each state after scenarios using the migrater parameter in IFs. There are two scenarios for the subnational population in India. The first scenario has migration rates for all provinces that are directly from IIASA. The second scenario is an adjustment of the first scenario where each province's migration rates from IIASA are excluded, included, doubled, or halved. These decisions for this scenario are based upon how the population forecasts looked after the first migration scenario. The third scenario is a slightly adjusted version of the second scenario that was run with the final China migration scenario.
Two states are missing from this analysis, Andhra Pradesh and Telangana. These states were not included because IIASA's forecasts only have Andhra Pradesh, which includes Telangana. Whereas, the IFs model has Andhra Pradesh and Telangana separated.
India
Population
Below is a graph of the population sum of the states and terrritories for IIASA, IFs without migration, and the three IFs migration scenarios. These are all compared to the 186 version of IFs. As shown below, IFs without migration and IFs migration scenario 1 are significantly higher than the other population models. IIASA's subnational model's population summed is almost identical to IFs' 186 model. Migration scenario 2 is in between the two models. The third and final migration scenario is the closest to IIASA and the 186 version of IFs. The third migration scenario has about 19 million more people than the 186 version of IFs in 2100, where as the second scenario has about 78 million more people and the first migration scenario has about 172 million more people.
Crude Birth Rates
Crude Death Rates
Migration Rates
Total Fertility Rates
Andaman and Nicobar Islands
Population
In 2010 the IFs model's population is about 2% greater than IIASA's, but in 2015 Andaman and Nicobar Islands's population drops below IIASA's by about 9%. The IFs model's population forecasts are less than IIASA's by an increasing rate and by 2095 IFs's population forecast is by about 94%.
Crude Birth Rates
Andaman and Nicobar Island's Crude Birth Rates in IFs are close to IIASA's forecasts. In 2075 and 2080 IFs is less than IIASA by about 10%, but all other years the two models are less than 10% in difference.
Crude Death Rates
The IFs model's CDRs are significantly greater than IIASA's forecasts. In 2015 the IFs model's CDRs are about 9% greater than IIASA's and by 2095 the difference grows to around 23%.
Migration
The net migration rate from IIASA in Andaman and Nicobar Islands starts out high in 2010 at about 8.5 per thousand and steadily declines to just below 3 per thousand by 2095.
Total Fertility Rates
IIASA's TFR forecasts are greater than IFs' forecasts for all years. The two models are relatively close.
Migration Scenario 1 Results
Migration Rate After Migration Scenario 1
Population After Migration Scenario 1
Migration Scenario 2 Results
Although there is some visible difference between the IIASA and IFs model with the first scenario, the difference is very small is absolute terms. The population in Andaman and Nicobar Islands is small and the difference is minimal.
Migration After Scenario 2
The second migration scenario is almost identical to the first scenario. In the first few years of forecast, Andaman and Nicobar Islands are identical to IIASA in the second scenario, whereas, in the first scenario the migration rates are at zero.
Population After Migration Scenario 2
Although migrater was not changed between the two scenarios, the migration rate and the population did change. The slight change in the first years of migration increased population sufficiently to bring Andaman and Nicobar Islands up to almost IIASA's population forecast.
Migration Scenario 3 Results
The migration rates are the same for Andaman and Nicobar Islands as they were in the second scenario.
Migration Rates After Migration Scenario 3
Population After Migration Scenario 3
Arunanchal Pradesh
Population
Arunanchal Pradesh's population forecast in IFs is close to IIASA's. IFs is less than IIASA by an increasing amount from about 2040 to 2080. In 2080, the difference between the two model's forecasts peaks at about a 4.3% difference. From 2080 through the end of the time horizon the difference between the two models decreases slightly to around 4%.
Crude Birth Rates
Arunanchal Pradesh's CBRs in the IFs model jump up in 2014 at model initialization. The IFs model's forecasts are significantly higher than IIASA's, ranging between 18% and 36% difference.
Crude Death Rate
Arunanchal Pradesh's CDRs in IFs are greater than in IIASA's by 36% initially. Overtime, the two models become closer and closer until 2090 when IIASA's forecasts for CDR pass IFs.
Migration
Total Fertility Rates
TFR in IFs' forecasts for Arunanchal Pradesh is significantly greater than IIASA's forecasts.
Migration Scenario 1 Results
Migration Rate After Migration Scenario 1
The first time the scenario was run this province's migration data was dropped from the scenario after the scenario file was run. The cause of this error is not known, but it was remedied by copying and pasting the scenario data into another scenario file. Upon rerunning the scenario with the fixed scenario file, the migration rate is identical.
Population After Migration Scenario 1
Arunanchal Pradesh's population is significantly greater after the introduction of migration into the model.
Migration Scenario 2 Results
Births are greater in the IFs model which causes population to increase by too much when migration is introduced. Therefore, migration is removed for Arunanchal Pradesh in the second scenario.
Migration Rate After Migration Scenario 2
Population After Migration Scenario 2
After the second scenario with the removal of migration rates, Arunanchal Pradesh's population is identical to the base case and close to IIASA's population forecast.
Migration Scenario 3 Results
Arunanchal Pradesh's migration rates were unchanged in the third and final scenario.
Migration Rates After Migration Scenario 3
Population After Migration Scenario 3
Assam
Population
The IFs model's population forecasts are slightly greater than IIASA's by less than 5% in all years. The average difference between the two models is around a 3%. 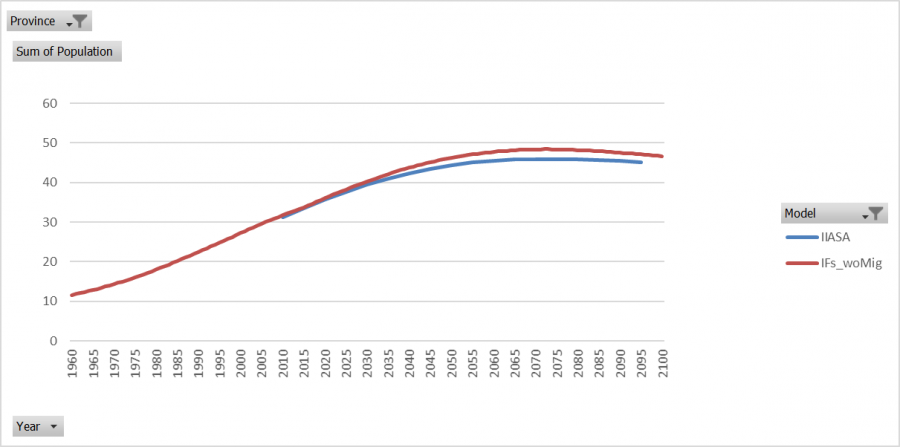
Crude Birth Rates
CBRs are relatively close in the two models. The largest difference is in 2095 where IFs's population forecast is nearly 8% lower than IIASA's. 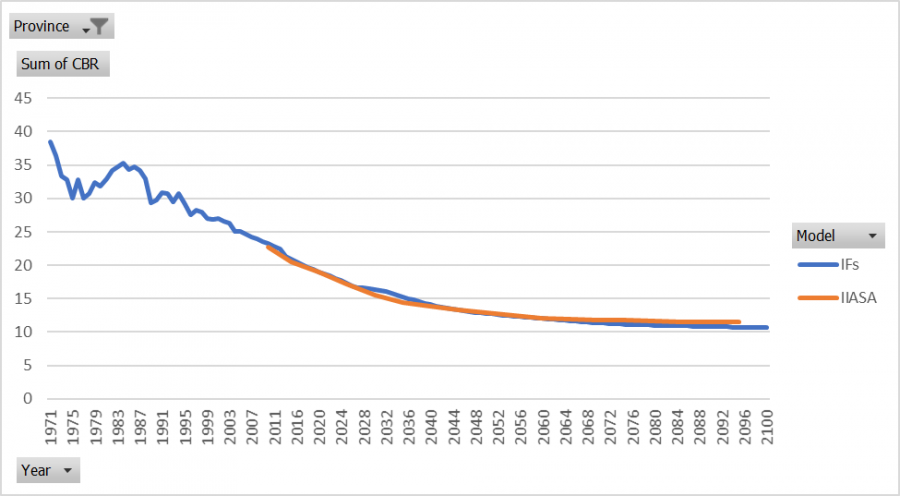
Crude Death Rates
In 2010 there is an 18% difference between IIASA and IFs's historical data. By 2015 the two models are very close and IIASA is greater than IFs until around 2070. After 2070 IFs' CDRs are greater than IIASA's by an increasing rate. From 2015 through 2100 there is not a difference between the two models that is greater than 5.5%.
Migration
Total Fertility Rates
IIASA's forecasts of TFR for Assam are slightly greater than IFs' forecasts, but both models are relatively close to one another.
Migration Scenario 1 Results
Migration Rate After Migration Scenario 1
Population After Migration Scenario 1
Migration Scenario 2 Results
Assam's population forecasts in the first scenario with IIASA's migration rates are quite close to IIASA's population forecasts and therefore do not require any adjustment in the second scenario. Migration rates are included and remain the same in the second scenario as they were in the first scenario.
Migration Rates After Migration Scenario 2
Although the migration rates are unchanged in the second scenario, the migration rates are greater in the second scenario than in the first.
Population After Migration Scenario 2
Assam's migration rates do not change significantly in absolute terms and the population forecasts in the second scenario is quite close to IIASA's and the first scenario's population forecasts.
Migration Scenario 3 Results
Assam's migration rates are unchanged in the third scenario from the previous iteration.
Migration Rates After Migration Scenario 3
Population After Migration Scenario 3
Bihar
Population
Bihar is one of the largest provinces in India and IFs is forecasting greater population growth than what is seen in IIASA's forecasts by about 70 million by the end of the time horizon. In 2095, IFs forecasts Bihar's population to be about 31% greater than IIASA's forecast.
Crude Birth Rate
IFs forecast of Bihar's CBRs are greater than IIASA's. IFs forecasts rise and fall two times in the forecasts. IIASA's forecasts are smoother than IFs and steadily decline over time. In 2030 the difference between the two models is at its' greatest reaching about a 24% difference. In 2095 the difference between the two model's declines to its' lowest point at about 3% difference.
Crude Death Rate
In 2010 the two model's have their greatest difference, with IFs's CDR being 20% greater than IIASA's. From IFs model initialization in 2014 through 2060 the two models are quite close, with less than 10% difference in all years. After 2060, IIASA's forecasts are greater than IFs by about 10% to 13%.
Migration
Total Fertility Rates
IFs' forecasts of TFR for Bihar are significantly greater than IIASA's until 2045. After 2045, TFR remains flat at 1.9 births per woman through the end of the time horizon in both models.
Migration Scenario 1 Results
Bihar has significant outward migration in IIASA's forecasts and this appears to be the main driver that is pushing Bihar's population forecast much higher than IIASA's. To remedy this, IIASA's migration data for Bihar was put into a scenario file using the parameter migrater.
Below is a graph showing Bihar's migration rates from the IIASA model (in orange), the IFs provincial model without migration (in blue), and the migration scenario with migration rates from IIASA (in grey). Despite the migration data being identical in the scenario file to the IIASA data, the results from the migration scenario's run are not identical to IIASA. This graph shows migration rates in Bihar when the scenario file only had migration rates for Bihar, the rest of the provinces were not affected.
Below is the population forecasts from IIASA (in blue), IFs without migration (in red), and IFs with the migration scenario (in green).
Migration Scenario Results 2
This migration scenario is the one represented in all other provinces, where all provinces have migration data from IIASA in the migrater parameter.
Migration Rate After Migration Scenario 2
With all provinces' migration rates adjusted, Bihar responds as expected where migration rates match IIASA's.
Population After Migration Scenario 2
Migration Scenario 3 Results
Bihar is the only province that has been changed three times, and the third scenario in Bihar is from the same scenario that is referred to as Scenario 2 throughout the rest of this document. The third scenario in Bihar is labeled as SCE2 in the graphs for consistency across scenario versions and provinces. Because the population did not significantly change between the first Bihar migration scenario and the second, net migration rates were doubled in the third migration scenario.
Migration Rates After Scenario 3
The doubling of migration rates in 2014 shifts the migration rate line in the scenario down. After 2085, migration rates are forecast to decline to the same level that is in IIASA and the previous scenario.
Population After Migration Scenario 3
After the third migration scenario, Bihar's population forecasts have sufficiently declined to levels that are close to IIASA's population forecasts. There is a decline in population by about 80 million in 2100 from the base case to the third scenario.
Migration Scenario 4 Results
Bihar's migration scenario 4 is the equivalent of migration scenario 3 for all other provinces in India. Bihar's migration rates were unchanged in the final scenario from the previous version.
Migration Rates After Migration Scenario 4
Population After Migration Scenario 4
Chandigarh
Population
IFs forecast of Chandigarh's population is significantly less than IIASA's forecast by an increasing amount throughout the forecasts. By 2095 IFs is less than IIASA by 129%.
Crude Birth Rate
IFs and IIASA's forecasts of CBR are similar, with IFs forecasts being greater than IIASA's by between 2% and just under 11% in 2095.
Crude Death Rate
IFs forecast of CDRs are significantly greater than IIASA's forecast by between 19% and 36%. The two model's starting points in 2010 are close and have about a 5% difference.
Migration
Total Fertility Rates
Chandigarh's historical data is surprisingly low, but has been verified. IIASA's forecasts are even lower than the IFs' model by about 0.2 births per woman.
Migration Scenario 1 Results
Migration Rate After Migration Scenario 1
Population After Migration Scenario 1
Migration Scenario 2 Results
The migration scenario in Chandigarh has the same data in the first scenario and the second scenario.
Migration Rate After Migration Scenario 2
The migration rates are larger in the second scenario, in spite of identical data in both scenarios.
Population After Migration Scenario 2
Chandigarh's population in the second scenario is about the same as IIASA's until about 2050. After 2050, the second scenario's population forecast is greater than IIASA's.
Migration Scenario 3 Results
Chandigarh's migration rates were unchanged in the third and final scenario.
Migration Rates After Migration Scenario 3
Population After Migration Scenario 3
Chhatisgarh
Population
The IFs model's forecast of population in Chhatisgarh is greater than IIASA's population forecasts by an increasing margin. By 2095 IFs' population is about 11% greater than IIASA's.
Crude Birth Rates
From 2010 through 2030 the two models' forecasts of CBRs have the greatest difference, ranging from 4% in 2015 to 11% in 2025. From 2030 through the end of the time horizon, the two models are similar with less than 3% difference in any given year.
Crude Death Rates
IFs' and IIASA's CDRs in 2010 are at their greatest difference, with IFs being about 13% greater than IIASA. In 2025 IFs' CDRs drop below IIASA's forecast of CDR until 2080. Between 2025 and 2080, IFs is between 0% and 8% less than IIASA's forecast. After 2080, IFs' CDRs increase beyond IIASA's and by 2095 IFs is about 4% greater than IIASA's.
Migration
Total Fertility Rates
The IFs model's historical TFR are greater than IIASA's, but IFs' rates decline more quickly than IIASA's. Both models reach 1.9 births per woman by 2045 and remain at that rate until the end of the time horizon.
Migration Scenario 1 Results
Migration Rate After Migration Scenario 1
Population After Migration Scenario 1
Migration Scenario 2 Results
The population forecasts from the first scenario were close to IIASA with the inclusion of migration and therefore the migration rates remain unchanged for Chhatisgarh in the second scenario.
Migration Rates After Migration Scenario 2
The migration rates in the second scenario are identical to the migration rates from IIASA and the first scenario. However after the second scenario was run migration rates are greater for all years.
Population After Migration Scenario 2
The greater migration rates makes population slightly greater in the second scenario, but the difference is small.
Migration Scenario 3 Results
Chhatisgarh's migration rates were doubled, which means they were lowered from -0.12 to -0.24 in 2014.
Migration Rates After Migration Scenario 3
Population After Migration Scenario 3
Dadra and Nagar Haveli
Population
Dadra and Nagar Haveli's population forecast in IFs is significantly lower than IIASA's. By 2095 IFs forecast is about 111% lower than IIASA's forecast.
Crude Birth Rates
IFs forecasts of CBRs are significantly greater than IIASA's. By 2095 IFs forecasts of CBRs is 33% greater than IIASA's. There is a noticable shift up in IFs' forecast in 2014 when the model initializes.
Crude Death Rates
CDRs in the IFs model are significantly greater than IIASA's in all years. There is a significant jump in CDR in the IFs model at model initialization in 2014. The difference between the two models is greatest in magnitude in 2015 with IFs being 62% greater than IIASA's CDR. The models have the least difference in total in 2010 with about 0.75 deaths per thousand difference.
Migration
Total Fertility Rates
The historical data in the IFs model is significantly greater than the IIASA model's initialization in 2010. IFs forecasts TFR to drop down to 1.9 in 2035 and remain there through the end of the time horizon. IIASA forecasts TFR to drop to 1.75 in 2045 and the rate remains flat through 2095.
Migration Scenario 1 Results
Migration Rate After Migration Scenario 1
Population After Migration Scenario 1
Migration Scenario 2 Results
The first scenario places population forecasts to be almost identical to IIASA's population forecasts. Therefore, there is no change in migration rates in the second scenario for Dadra and Nagar Haveli.
Migration Rates After Migration Scenario 2
Although the migration rates within the second scenario are identical to IIASA's and the first scenario, after the scenario is run the migration rates are greater in the second scenario.
Population After Migration Scenario 2
The increased migration rates in the second scenario causes the population forecasts to overshoot IIASA's. The total population is really small in all models.
Migration Scenario 3 Results
Dadra and Nagar Haveli's migration rates were unchanged.
Migration Rates After Migration Scenario 3
Population After Migration Scenario 3
Daman and Diu
Population
IFs population forecasts for Daman and Diu are significantly less than the IIASA population forecasts. The magnitude of difference between the population forecasts in the IFs model and IIASA's model is at its greatest in 2095 with the IFs population being 268% less than the IIASA population.
Crude Birth Rates
IFs' CBRs are greater than IIASA's for all years but for the first 15 years of forecasts, from 2010 through 2025, are very close. IIASA's forecasts have CBR declining more rapidly after 2025 than IFs' forecasts. By 2095 IFs' CBRs are about 39% greater than IIASA's.
Crude Death Rates
IFs forecasts CDRs to be much higher than IIASA does. There is a noticable upward shift in IFs' CDR in 2014 at the model initialization, then CDRs decline until around 2020. After 2020 IFs forecasts CDRs to rise more rapidly than IIASA until it peaks in 2070, then CDRs decline in the IFs model until the end of the time horizon in 2100. IIASA's forecast is smooth and steadily increases until it plateaus around 2090. The magnitude of difference ranges from around 11% to 62%.
Migration
Total Fertility Rates
IIASA's model forecasts TFR to drop to 1.75 in 2030 and remain there through the end of the time horizon. Alternatively, the IFs model drops to 1.9 in 2005 and it remains there through 2100.
Migration Scenario 1 Results
Migration Rate After Migration Scenario 1
Daman and Diu's migration rate is almost identical to IIASA's, as expected. There is a small drop in migration rates from 2040 to 2050 below IIASA's rates.
Population After Migration Scenario 1
Migration Scenario 2 Results
The first migration scenario results were satisfactory and no changes are made to migration rates in the second scenario.
Migration Rates After Migration Scenario 2
Although there was no change to the migration rate data between the first and second scenario, the second scenario has larger migration rates after the scenario was run.
Population After Migration Scenario 2
The population forecasts are greater than in the first scenario and overshoots IIASA's forecasts by about 4 hundred thousand people at the end of the time horizon.
Migration Scenario 3 Results
Daman and Diu's migration rates have not changed from the previous scenario.
Migration Rates After Migration Scenario 3
Population After Migration Scenario 3
Delhi
Population
IIASA's population forecast for Delhi is significantly greater than IFs' population forecast. By 2095, IIASA forecasts a population of about 45 million. Alternatively, in IFs the population is forecast to be around 22 million. This difference between the two models is around 106% in 2095.
Crude Birth Rates
CBRs in the two models are relatively close with less than an 11% difference in any given year. IFs' forecast of CBR are greater than IIASA's in all years.
Crude Death Rates
CDRs in the IFs model are greater than IIASA's forecasts in all years. The difference increases every year up until 2075 where the difference between the two models peaks at 27%.
Migration
Total Fertility Rates
IIASA's forecasts of TFR drop down as low as 1.5 from 2025 through 2045 and then increase to 1.7. IFs forecasts TFR to steadily increase from 1.8 to 1.9.
Migration Scenario 1 Results
Migration Rate After Migration Scenario 1
Population After Migration Scenario 1
Migration Scenario 2 Results
Due to the success of introducing IIASA's migration rates in improving Delhi's population forecasts there is no change in the migration data in the second scenario versus the first scenario.
Migration Rates After Migration Scenario 2
Migration rates in the second scenario are greater than in the first, despite the same migration data being in both scenarios.
Population After Migration Scenario 2
Due to the increase in migration rates after the second scenario was run, the population forecasts are greater in the second scenario by about 10 million in 2100.
Migration Scenario 3 Results
Delhi's migration rates were not changed from the previous iterations.
Migration Rates After Migration Scenario 3
Population After Migration Scenario 3
Goa
Population
Goa's population in IFs is significantly less than the population in IIASA's model. By 2095 IFs population is 59% less than IIASA's.
Crude Birth Rates
Goa's CBRs are greater in the IFs model than the IIASA model for all years by about 1.5 births per thousand. The magnitude of difference between the two models ranges from 11% to 17%.
Crude Death Rates
There is a significant downward shift in IF's forecast of CDR in 2014 at model initialization. This shift results in a 43% magnitude of difference between IFs and IIASA's models, despite the two models having very close starting points in 2010. IFs' forecasts of CDRs increase more rapidly than IIASA's, and by 2070 IFs' CDRs become greater than IIASA's through the end of the time horizon.
Migration
Total Fertility Rates
IIASA's forecasts of TFR drop below 1.4 from 2015 through 2045. After 2045 IIASA forecasts TFR to steadily increase to 1.6. IFs forecasts TFR to start at 1.6 births per woman and then steadily increase to 1.9.
Migration Scenario 1 Results
Migration Rate After Migration Scenario 1
Population After Migration Scenario 1
Migration Scenario 2 Results
The first scenario overshoots IIASA's population because births are greater and deaths are lower (in the earlier years) in IFs. Therefore, the migration rate in Goa is halved in the second scenario.
Migration Rate in Migration Scenario 2
The migration rate in Goa was halved starting in 2014 in the second migration scenario. However, the first few years are close to zero after the scenario was run. These zeroes are not in the data in the scenario, rather it is some push back from within the model.
Population After Migration Scenario 2
The halving of migration rates in Goa in the second scenario brings population forecasts down to IIASA's population forecasts.
Migration Scenario 3 Results
Goa's migration rates were unchanged from the previous scenario.
Migration Rates After Migration Scenario 3
Population After Migration Scenario 3
Gujarat
Population
The population forecasts of Gujarat are similar in the two models, with IFs' forecasts being greater than IIASA's in all years. The magnitude of difference between the two models is less than 5% in all years.
Crude Birth Rates
IFs' CBRs are greater than IIASA's for all years, but the two models are within 4 births per thousand or less of each other. The magnitude of difference ranges from 7% to 11%.
Crude Death Rates
IIASA's CDR forecasts are greater than IFs from 2015 through the end of the time horizon in 2095. IFs appears to have a jump down in CDRs at model initialization in 2014. The largest magnitude of difference between the two models was in 2020 with IFs being 21% less than IIASA's.
Migration
Total Fertility Rates
IFs' forecasts TFR to be greater than IIASA for all years. IIASA forecasts TFR to level off at 1.8 children per woman, whereas IFs forecasts TFR to level off at 1.9 children per woman.
Migration Scenario 1 Results
Migration Rate After Migration Scenario 1
Population After Migration Scenario 1
Migration Scenario 2 Results
It appears that Gujarat is forecast to have fewer deaths in IFs and more births than in IIASA's forecasts. Because of this difference the introduction of migration forces population forecasts to overshoot IIASA's. Therefore, migration is removed for Gujarat in the second scenario run.
Migration Rates After Scenario 2
Population After Migration Scenario 2
Population drops down to close to IIASA's forecasts when migration data is not used for Gujarat in the second scenario.
Migration Scenario 3 Results
Gujarat's migration rates were unchanged from the previous scenario version.
Migration Rates After Migration Scenario 3
Population After Migration Scenario 3
Haryana
Population
Population forecasts in Haryana are different between the two models, with IFs being significantly less than IIASA's. By 2095 IFs' population forecast is about 33% less than IIASA's, which translates into a difference of about 11 million people.
Crude Birth Rates
IFs' forecasts of CBRs are greater than IIASA's for all years, but are relatively close with the magnitude of difference ranging from 3% to 6%.
Crude Death Rates
As has been observed previously, there is an upward shift in CDRs in the IFs model in 2014 at model initialization. IF's forecasts are greater than IIASA's for all years. The magnitude of difference ranges from 3% to 12%.
Migration
Total Fertility Rates
Haryana's TFR forecasts are similar in the two models. IFs is greater than IIASA in all years. IFs forecasts TFR to level off at 1.9, whereas in IIASA's model forecasts TFR to level off at 1.83.
Migration Scenario 1 Results
Migration Rate After Migration Scenario 1
Population After Migration Scenario 1
Migration Scenario 2 Results
The first scenario's forecasts look good, therefore the migration data does not change in the second scenario for Haryana.
Migration Rate After Migration Scenario 2
There is some push back in the model on the migration rates, but they are close to the desired values.
Population After Migration Rate Scenario 2
Population is even closer in the second scenario to IIASA's forecasts, than it was in the first.
Migration Scenario 3 Results
Haryana's migration rates are unchanged from the previous scenario.
Migration Rates After Migration Scenario 3
Population After Migration Scenario 3
Himachal Pradesh
Population
The population forecasts in the two models are quite close with IIASA's forecasts are slightly larger from 2060 through the end of the time horizon.
Crude Birth Rates
IFs forecasts CBRs to be higher than IIASA for all years by a decreasing margin. In 2030 the magnitude of difference between the two models peaks at 13% and by 2095 the magnitude of difference declines to 7.5%.
Crude Death Rates
IIASA's forecasts of CDRs are greater than IFs until 2085. The magnitude of difference between the two models ranges from -10% to 5%.
Migration
Total Fertility Rates
IFs' forecasts of TFR are greater than IIASA in every year except 2014. IFs' forecasts a steady rise in TFR that approaches 1.9, but does not reach it at the end of the time horizon. IIASA forecasts a steady increase in TFR reaching 1.84 in 2095.
Migration Scenario 1 Results
Migration Rate After Migration Scenario 1
Population After Migration Scenario 1
Migration Scenario 2 Results
Because IFs has more births and less deaths than IIASA when migration is brought into the model in scenario 1, the first scenario has forecasts of population that are too large. Therefore, migration is removed from Himachal Pradesh in the second scenario run.
Migration Rate After Scenario 2
Population After Migration Scenario 2
Migration Scenario 3 Results
Himachal Pradesh's migration rates are unchanged from the previous scenario.
Migration Rates After Migration Scenario 3
Population After Migration Scenario 3
Jammu and Kashmir
Population
Jammu and Kashmir's population is forecast to be about 2 million more in IFs than in the IIASA model. The magnitude of difference reaches around 15% in 2095.
Crude Birth Rates
IFs' forecast of CBRs for Jammu and Kashmir is greater than IIASA's forecasts for all years. There is an absolute difference of about 2 births per thousand. The magnitude of difference between the two models is greatest in 2055 with IFs being about 29% greater than IIASA.
Crude Death Rates
There is a noticable upward shift in CDR in the IFs model in 2014 at model initialization. The IFs forecasts of CDRs are greater than IIASA's for all years, but by a decreasing margin over time.
Migration
Total Fertility Rates
IFs' forecasts TFR to rise to 1.9 in 2020 and births per woman remain there through the end of the time horizon. IIASA forecasts TFR to steadily decline to 1.56 in 2030 and then steadily rise through the end in 2095, where TFR reaches 1.77.
Migration Scenario 1 Results
Migration Rate After Migration Scenario 1
Population After Migration Scenario 1
Migration Scenario 2 Results
Deaths are greater in IIASA's model and births are greater in the IFs model, which causes population to not come down sufficiently when migration was introduced in the first scenario. Therefore, migration rates are doubled in the second scenario.
Migration Rates After Migration Scenario 2
The migration rates are read into the model properly from the scenario file, there is not any model push back on migration rates in the second scenario run.
Population After Migration Scenario 2
After the doubling of migration rates in the second scenario, population forecasts in IFs is closer to IIASA's. However, Jammu and Kashmir's population forecasts is about 1.5 million greater in IFs than in IIASA at the end of the time horizon.
Migration Scenario 3 Results
Jammu and Kashmir's migration rates were tripled from the calculated migration rate from IIASA in the third and final iteration.
Migration Rates After Migration Scenario 3
Population After Migration Scenario 3
Jharkhand
Population
Jharkhand's population forecasts are about 8.5 million more in IFs than in IIASA. The magnitude of difference is just under 15% by 2095.
Crude Birth Rates
IFs' forecasts of CBRs are greater than IIASA's for all years. The IFs model does not decline at the same rate throughout the time horizon. IIASA's decline in CBR is smoother and steadier.
Crude Death Rates
There is an upward shift in CDRs in IFs at model initialization in 2014. Until around 2045 IFs' forecast of CDRs is significantly greater than IIASA's, by a magnitude of 5% to 23%. After 2045 the CDRs in the two models are very close.
Migration
Total Fertility Rates
IFs has significantly greater TFR from 2010 through 2035. After 2035, IFs forecasts TFR to be 1.9 births per female and IIASA forecasts TFR to be 1.85 or 1.84 through the end of the time horizon.
Migration Scenario 1 Results
Migration Rate After Migration Scenario 1
Population After Migration Scenario 1
Migration Scenario 2 Results
Jharkhand's population was improved in the first scenario, but not by enough because births are greater in IFs than in IIASA. Therefore, the migration rate in Jharkhand is doubled in the second scenario.
Migration Rates After Migration Scenario 2
Population After Migration Scenario 2
The second scenario forecasts Jharkhand's population to be close to IIASA's forecasts.
Migration Scenario 3 Results
Jharkhand's migration rates are unchanged from the last scenario.
Migration Rates After Migration Scenario 3
Population After Migration Scenario 3
Karnataka
Population
IFs' forecast of population is greater than IIASA's for all years. By 2095, IFs is greater than IIASA by about 10% which equates to about 8 million people.
Crude Birth Rates
IFs' forecasts of CBRs are greater than IIASA's for all years by a decreasing margin. The greatest magnitude of difference was in 2025 by about 16%.
Crude Death Rates
Crude death rates are higher in IIASA's forecasts from 2015 through 2090. There is about 1 less death per thousand in the IFs forecasts with magnitudes of difference ranging from -12% to 7%.
Migration
Total Fertility Rates
IFs forecasts TFR at 1.9 from 2015 through the end of the time horizon. IIASA forecasts a slight decline in TFR from 2010 through 2025, followed by a steady increase to 1.86.
Migration Scenario 1 Results
Migration Rate After Migration Scenario 1
Population After Migration Scenario 1
Migration Scenario 2 Results
Migration in the first scenario increases population in Karnataka, when IFs is already forecasting population to be larger than IIASA. Therefore, the migration parameter is turned off in the second scenario.
Migration Rates After Scenario 2
Population After Migration Scenario 2
Karnataka's population is about 8 million greater than IIASA's at the end of the time horizon.
Migration Scenario 3 Results
Karnataka's migration rates were lowered to -0.4, despite the fact that IIASA forecasts there to be positive net migration into Karnataka. The negative migration rates are to offset the greater rate of deaths forecasts in Karnataka by the IIASA model.
Migration Rates After Migration Scenario 3
Population After Migration Scenario 3
Kerala
Population
Kerala's population is forecast to be significantly higher in the IFs forecasts verus the IIASA forecasts. By 2095 IFs forecasts about 10 million more people than IIASA, with is about a 25% difference.
Crude Birth Rates
IFs forecasts CBRs for Kerala to be greater than what was forecast by IIASA for all years. In 2095 IFs is about 14% greater than IIASA's forecast.
Crude Death Rates
IFs has a noticable downward shift in CDRs in 2014 at model initialization. IFs forecasts CDRs to be less than IIASA's forecasts by about 2 deaths per thousand for most years. The magnitude of difference decreases over time, with a range of 33% to 9%.
Migration
Total Fertility Rates
IFs' forecasts TFR to steadily increase and approach 1.9, but does not reach the value at the end of the time horizon. IIASA forecasts a decline in TFR from 2010 through 2030. After 2030, IIASA forecasts a steady increase in TFR reaching 1.71 in 2075 where TFR remains through the end of the time horizon.
Migration Scenario 1 Results
Migration Rate After Migration Scenario 1
Population After Migration Scenario 1
Migration Scenario 2 Results
Migration rates in Kerala are doubled in the second scenario to improve population forecasts.
Migration Rates After Migration Scenario 2
There is some model push back in the latter years of forecasts in migration rates where migration rates decline to around IIASA's level.
Population After Migration Scenario 2
After doubling migration rates in the second scenario, IFs population forecasts in Kerala are closer to IIASA's but they are still about 3 million greater at the end of the time horizon.
Migration Scenario 3 Results
Kerala's migration rates are increased in the third and final scenario. They are tripled from the first scenario.
Migration Rates After Migration Scenario 3
Population After Migration Scenario 3
Lakshadweep
Population
IFs' forecast for population in Lakshadweep is significantly lower than IIASA's forecast. The magnitude of difference between the two models in 2095 is 64%.
Crude Birth Rates
There is a upward shift in CBRs in the IFs model in 2014 at model initialization. IFs' forecasts are greater than IIASA's for all years by about 4 births per thousand with an overall magnitude varying from 31% to 45%.
Crude Death Rates
There is an upward shift in CDRs in 2014 in the IFs model. From 2010 through 2055 IFs' forecasts of CDRs are greater than IIASA's. After 2055 IFs forecasts are less than IIASA's. The range of magnitude of difference varies from -18% to 36%.
Migration
Total Fertility Rates
IFs forecasts TFR to drop to 1.9 in 2020, where it remains through the end of the time horizon. IIASA forecasts a decline in TFR from 2010 through 2030, where it reaches 1.31. After 2030, IIASA forecasts of TFR steadily rise to 1.52 in 2095.
Migration Scenario 1 Results
Migration Rate After Migration Scenario 1
Lakshadweep's migration rates have a slight departure from IIASA's between 2040 through 2050, but overall they match.
Population After Migration Scenario 1
Migration Scenario 2 Results
The first scenario overshoots IIASA's population and the migration rates are halved in the second scenario.
Migration Rates After Migration Scenario 2
Population After Migration Scenario 2
The second scenario is much closer to IIASA's forecasts of population.
Migration Scenario 3 Results
Lakshadweep's migration rates are the same in the third scenario as they were in the second scenario.
Migration Rates After Migration Scenario 3
Population After Migration Scenario 3
Madhya Pradesh
Population
Madhya Pradesh's population is close in the two models, with IFs' forecasts being slightly less than IIASA's. The difference between the two models increases over time. By 2095, IFs' population forecast is about 4% less than IIASA's.
Crude Birth Rates
IFs' forecast of CBRs decline at different rates throughout the forecasts, whereas IIASA's CBRs decline more steadily. IFs forecasts are greater than IIASA's for most years, but get rather close to IIASA's in 2035 and 2065.
Crude Death Rates
Madhya Pradesh's CDRs have a significant spike in 2014 when the model initializes. IFs' forecasts of CDRs are greater than IIASA's for all years by about 1.5 deaths per thousand.
Migration
Total Fertilty Rates
IFs' forecasts of TFR decline more rapidly than IIASA, but both models reach 1.9 by 2050. After 2050, both models remain there through the end of the time horizon.
Migration Scenario 1 Results
Migration Rate After Migration Scenario 1
Population After Migration Scenario 1
Migration Scenario 2 Results
The same migration rates are used in the second scenario as were used in the first scenario.
Migration Rates After Migration Scenario 2
Even though the same migration rates were used in the scenario, there is a difference between the two scenarios. The second scenario's migration rates are larger than the first scenario because of some model pushback.
Population After Migration Scenario 2
This difference in migration rates is not apparent in the population forecasts because the migration rates are so small.
Migration Scenario 3
Madhya Pradesh's migration rates are unchanged in the third scenario from the second scenario.
Migration Rates After Migration Scenario 3
Population After Migration Scenario 3
Maharashtra
Population
IFs' forecast of Maharashtra's population is significantly less than IIASA's by an increasing margin. In 2095, there is a nearly 40 million difference between the two models. The magnitude of difference reaches 31% in 2095.
Crude Birth Rates
IFs' forecasts are greater than IIASA's for all years by a magnitude of 6% to 14%.
Crude Death Rates
IFs' forecast for CDRs looks bizarre, there is a massive jump in CDR in 2030. IFs' forecasts for CDRs are greater than IIASA's for all years.
Migration
Total Fertility Rates
IIASA forecasts TFR to drop below IFs' forecast in 2020, which is where the forecasts remain through the end of the time horizon.
Migration Scenario 1 Results
Migration Rate After Migration Scenario 1
Population After Migration Scenario 1
Migration Scenario 2 Results
The second scenario has the same migration data as the first scenario.
Migration Rates After Migration Scenario 2
Although the same data is used in the second scenario as was in the first, the model pushes migration rates up above what is in the scenario.
Population After Migration Scenario 2
The increase in migration rates in the second scenario causes an increase in population in Maharashtra by about 10 million at the end of the time horizon.
Migration Scenario 3 Results
Madhya Pradesh's migration rates are unchanged from the second scenario.
Migration Rates After Migration Scenario 3
Population After Migration Scenario 3
Manipur
Population
IFs' population forecast for Manipur are greater than IIASA's by an increasing margin through the end of the time horizon. The magnitude of difference reaches 28% in 2095.
Crude Birth Rates
IFs' forecasts of CBRs are greater than IIASA's for all years by about 5 births per thousand.
Crude Death Rates
In IFs' forecast of CDRs there is an upward shift in 2014 at model initialization which leads to a 40% magnitude of difference between the two models. IFs' CDRs increase throughout the forecasts, but at a lower rate than IIASA's. By 2070, IIASA's CDRs surpass IFs'.
Migration
Total Fertility Rates
IIASA's forecasts of TFR are significantly lower than IFs' forecasts. Both models forecast a steady increase in TFR.
Migration Scenario 1 Results
Migration Rate After Migration Scenario 1
Manipur's migration rates are identical to IIASA's until 2065. After 2065, the rates fall to zero in the scenario.
Population After Migration Scenario 1
Migration Scenario 2 Results
The same migration data is used in Manipur in the second scenario as was used in the first scenario.
Migration Rates After Migration Scenario 2
There is the same increase away from IIASA's data in migration rates to zero in the second scenario as is in the first scenario during the latter years. However, the second scenario has higher migration rates than the first.
Population After Migration Scenario 2
The population forecasts in the second scenario are about the same as the first.
Migration Scenario 3 Results
Manipur's migration scenario is the same as in the first and second scenarios.
Migration Rates After Migration Scenario 3
Population After Migration Scenario 3
Population in IFs is still about half a million more people than in IIASA's forecasts at the end of the time horizon.
Meghalaya
Population
Meghalaya's population forecasts differ significantly between the two models. IFs' forecast is greater than IIASA's by nearly 2.5 million.
Crude Birth Rates
IFs' forecasts of CBRs are greater than IIASA's for all years by a decreasing margin.
Crude Death Rates
There is a significant drop in CDRs in the IFs model in 2014 at model initialization. From 2015 through 2095 IFs' forecast is less than IIASA's by an increasing margin.
Migration
Total Fertility Rates
Total fertility rates in the IFs model are initially greater than IIASA's by about 1 birth per woman. This tremendous gap declines over time, but never completely closes. IFs levels off at 1.9 around 2035. Alternatively, IIASA's forecasts of TFR decline from 2010 through 2035 and then increases steadily to 1.8 in 2095.
Migration Scenario 1 Results
Migration Rate After Migration Scenario 1
Population After Migration Scenario 1
Migration Scenario 2 Results
The migration parameter is turned off in the second scenario in Meghalaya.
Migration Rates After Migration Scenario 2
Population After Migration Rate Scenario 2
The population forecasts in IFs for Meghalaya are about 2.5 million greater than IIASA's forecasts at the end of the time horizon.
Migration Scenario 3 Results
Meghalya's migration rates were significantly reduced in the third and final scenario. The IIASA forecasts of migration in Meghalaya are positive but because their forecasts for deaths are significantly greater than what is in IFs, IIASA's population forecasts are much lower than what is in IFs without migration. Therefore, migration rates are lowered to -1.25 in 2014 in the third scenario to bring population in-line with IIASA's forecasts.
Migration Rates After Migration Scenario 3
Population After Migration Scenario 3
Population after the third scenario run, is about 2 million less at than it was in the previous scenarios at the end of the time horizon.
Mizoram
Population
IFs' population forecast for Mizoram is larger than IIASA by an increasing margin throughout the time horizon. By 2095, there are about 500 thousand more people in the IFs model than in IIASA's.
Crude Birth Rates
Mizoram's CBRs in the IFs model are significantly greater than the CBRs in the IIASA model by about 6 or 7 births per thousand.
Crude Death Rates
There is a jump up in CDR in the IFs model in 2014 at model initialization. IFs' forecasts start out being greater than IIASA's, but the IFs CDRs are increasing at a lower rate than IIASA's CDRs are. Thus by 2065, IIASA's CDRs surpass IFs and are greater than IFs by an increasing margin through the end of the time horizon.
Migration
Total Fertility Rates
IFs' forecasts of TFR are greater than IIASA's for all years. IFs forecasts TFR to drop to 1.9 around 2020, where it remains through the end of the time horizon. IIASA's forecasts of TFR is more than 0.5 lower than IFs for all years. IIASA's forecasts a steady decline in TFR from 1.44 to 1.26 in 2040. After 2040, IIASA forecasts TFR to increase steadily to 1.39 in 2095.
Migration Scenario 1 Results
Migration Rate After Migration Scenario 1
Population After Migration Scenario 1
Migration Scenario 2 Results
The migration rates in the second scenario are twice what where in the first scenario.
Migration Rates After Migration Scenario 2
Population After Migration Scenario 2
The second scenario's forecast of population are closer to IIASA's forecast.
Migration Scenario 3
Mizoram's migration rates are the same in the third scenario as they were in the second.
Migration Rates After Migration Scenario 3
Population After Migration Scenario 3
Nagaland
Population
IFs' forecast of population in Nagaland is significantly greater than IIASA's forecast. By 2095 IFs' population forecast is about 38% greater than IIASA's.
Crude Birth Rates
IFs forecasts of CBRs in Nagaland are greater than IIASA's by about 5 births per thousand.
Crude Death Rates
There is a shift up in 2014 in CDRs in the IFs model. IIASA's CDRs are forecast to increase at a faster rate than IFs' model and by 2045 IIASA's forecasts of CDRs are greater than IFs'. By 2095 the difference between the two models is greatest with IFs being about 36% less than IIASA.
Migration
Total Fertility Rates
IFs' historical data for Nagaland starts off at 1.7 and then rises up to 2 around 2010. IIASA's model is significantly lower in 2010 at 1.42. IFs forecasts TFR to drop down to 1.9 around 2020, which is where is remains through the end of the time horizon. IIASA forecasts TFR to decline to 1.32 by 2035 and then it steadily increases up to 1.53 by the end of the time horizon.
Migration Scenario 1 Results
Migration Rate After Migration Scenario 1
Population After Migration Scenario 1
Migration Scenario 2 Results
The migration rate for Nagaland is doubled in the second scenario.
Migration Rates After Migration Scenario 2
Population After Migration Scenario 2
Population is slightly lower in the second scenario, but there is not a significant improvement in the population forecast for Nagaland.
Migration Scenario 3 Results
Migration rates were lowered to three times what IIASA forecasts for Nagaland, which is -0.175.
Migration Rates After Migration Scenario 3
Population After Migration Scenario 3
Nagaland's population is still significantly greater than IIASA's forecasts, but Nagaland's total population is relatively small compared to the rest of India.
Orissa
Population
IFs' population forecasts are greater than IIASA's by an increasing margin. By 2095, there is about 3 million more people in the IFs' population model than IIASA's.
Crude Birth Rates
IFs' forecast of CBRs is slightly more than IIASA's but the two models are quite close.
Crude Death Rates
CDRs are almost identical except for in the first year, 2010, and the last year, 2095.
Migration
Total Fertility Rates
In 2010, when IIASA's data begins, IFs' TFR is greater than IIASA's by 0.3. IFs forecasts TFR to decline to 1.9 by 2025. IIASA's forecasts TFR to drop slightly below 1.9 from 2025 through 2060. After 2060, IIASA's forecasts TFR to increase to 1.94 by 2095.
Migration Scenario 1 Results
Migration Rate After Migration Scenario 1
Population After Migration Scenario 1
Migration Scenario 2 Results
The migration parameter for Orissa was doubled in the second scenario.
Migration Rates After Migration Scenario 2
Population After Migration Scenario 2
The population forecasts in the second scenario are improved and are close to IIASA's.
Migration Scenario 3 Results
Orissa's migration rates are the same in the third scenario as they were in the previous iterations.
Migration Rates After Migration Scenario 3
Population After Migration Scenario 3
Pondicherry
Population
IFs' forecast of population in Pondicherry is less than IIASA's forecast by an increasing margin over time. By 2095, about 0.7 million less people are forecast to be in Pondicherry in the IFs model than in the IIASA model.
Crude Birth Rates
Pondicherry's CBRs are lower in IFs' forecasts than in IIASA's for most years. Both models are relative close.
Crude Death Rates
CDRs in the IFs' model are greater than IIASA's model from 2010 through 2060 by about 0.5 deaths per thousand. From 2060 on, IFs' forecast of CDRs are greater than IIASA's by an increasing margin. By 2095, IFs' CDRs are greater than IIASA's by almost 2 deaths per thousand.
Migration
Total Fertility Rates
In 2010 IFs' TFR is about 0.2 less than IIASA's. From 2014 through the end of the time horizon, IFs forecasts TFR to increase steadily to 1.86 by 2100. IIASA forecasts TFR to decline from 2010 through 2025, where it reaches 1.64 and remains there through 2035. After 2035, IIASA forecasts TFR to steadily increase to 1.69 by 2065, where TFR remains through the end of the time horizon.
Migration Scenario 1 Results
Migration Rate After Migration Scenario 1
Population After Migration Scenario 1
Migration Scenario 2 Results
The same migration rates are used in the second scenario as were used in the first scenario.
Migration Rates After Migration Scenario 2
Despite the same data having been used in the second scenario as was in the first, the model pushed back and increased migration rates somewhat in the second scenario.
Population After Migration Scenario 2
The change in migration rates pushed population forecasts up. The second scenario overshoots IIASA's population forecasts by about a half a million at the end of the time horizon.
Migration Scenario 3 Results
Pondicherry's migration rates are the same in the third scenario as they were in the previous scenarios.
Migration Rates After Migration Scenario 3
Population After Migration Scenario 3
Punjab
Population
IFs forecasts Punjab's population to be lower than IIASA's by an increasing margin. Punjab's population is forecast to be about 5 million less in the IFs model than in IIASA's model by 2095.
Crude Birth Rates
IFs forecasts CBRs to be greater than IIASA's model by about 11% to 15%.
Crude Death Rates
IFs forecasts CDRs to be greater than IIASA's by about 1 death per thousand.
Migration
Total Fertility Rates
IFs forecasts TFR to decline to 1.8 by 2015. After 2015, IFs forecasts TFR slowly approaches 1.9, but never reaches it by the end of the time horizon. IIASA starts in 2010 at 1.67 where it then declines to 1.64 by 2025. After 2025, IIASA forecasts a steady increase in TFR to 1.79 by 2095.
Migration Scenario 1 Results
Migration Rate After Migration Scenario 1
Population After Migration Scenario 1
Migration Scenario 2 Results
The first scenario's forecasts of population in Punjab overshoots IIASA's population. Therefore, the second scenario has migration rates that are half of what was in the first scenario.
Migration Rates After Migration Scenario 2
Population After Migration Scenario 2
The second scenario improves population forecasts and Punjab's population is in line with what we see at IIASA.
Migration Scenario 3
Punjab's migration rates are unchanged in the third scenario.
Migration Rates After Migration Scenario 3
Population After Migration Scenario 3
Rajasthan
Population
IF's forecast of Rajasthan's population is greater than IIASA's for all years by an increasing margin. By 2095 the difference is about 10 million people.
Crude Birth Rates
IFs' forecasts of CBRs in Rajathan are greater than IIASA's by a decreasing margin. By 2060, both model's forecasts are basically the same.
Crude Death Rates
For the most part IFs' forecasts of CDRs are lower than IIASA's by 2% to 12%.
Migration
Total Fertilty Rates
IFs starts off about 0.5 above IIASA and is above IIASA through 2030. After 2035, IFs forecasts TFR to be 1.9 through the end of time horizon. IIASA forecasts TFR to be steadily declines from 1.97 to 1.89 by 2095.
Migration Scenario 1 Results
Migration Rate After Migration Scenario 1
Population After Migration Scenario 1
Migration Scenario 2 Results
The first scenario did not cause a sufficient decline in population forecasts. Therefore, the second scenario has doubled the migration rate from the first scenario.
Migration Rates After Migration Scenario 2
Population After Migration Scenario 2
The second scenario forecasts population to be closer to IIASA's population forecasts, but there is still a difference by about 4 million people.
Migration Scenario 3 Results
In the third and final scenario, Rajasthan's migration rates were tripled from the first scenario.
Migration Rates After Migration Scenario 3
Population After Migration Scenario 3
Sikkim
Population
The two models forecasts of population in Sikkim are quite close but differ by an increasing margin.
Crude Birth Rates
CBRs are greater in the IFs model. 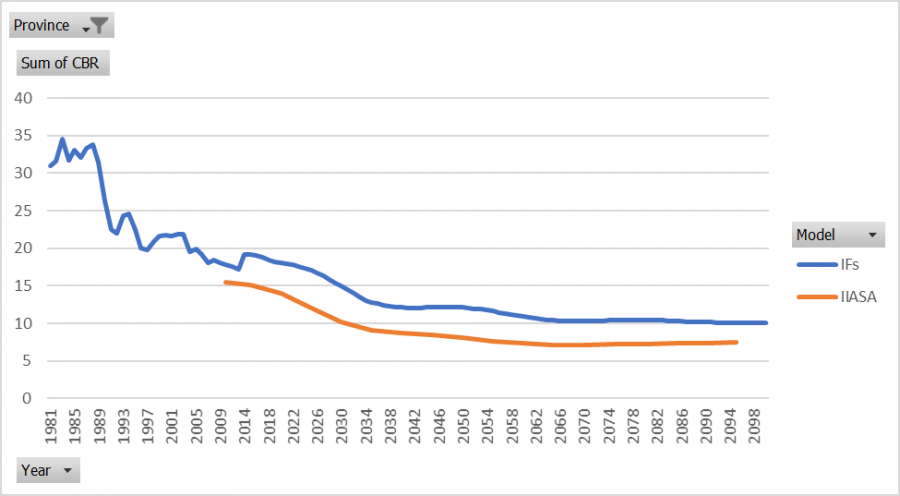
Crude Death Rates
CDRs in the two models are close together from 2010 through 2050. After 2050, IIASA's CDRs are greater than IFs by an increasing margin. 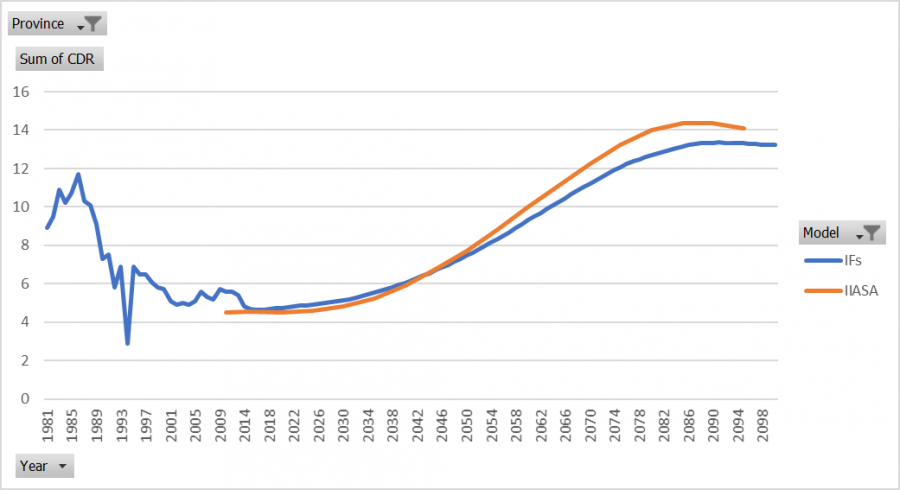
Migration
Total Fertilty Rates
In 2010 IFs' TFR is 2 births per female, whereas IIASA's TFR is about 0.5 less. IFs forecasts TFR to decline to 1.9 by 2020, where it remains through the end of the time horizon. IIASA's forecasts TFR to decline through 2035. After 2035, IIASA's TFR steadily increases to 1.66 by 2095.
Migration Scenario 1 Results
Migration Rate After Migration Scenario 1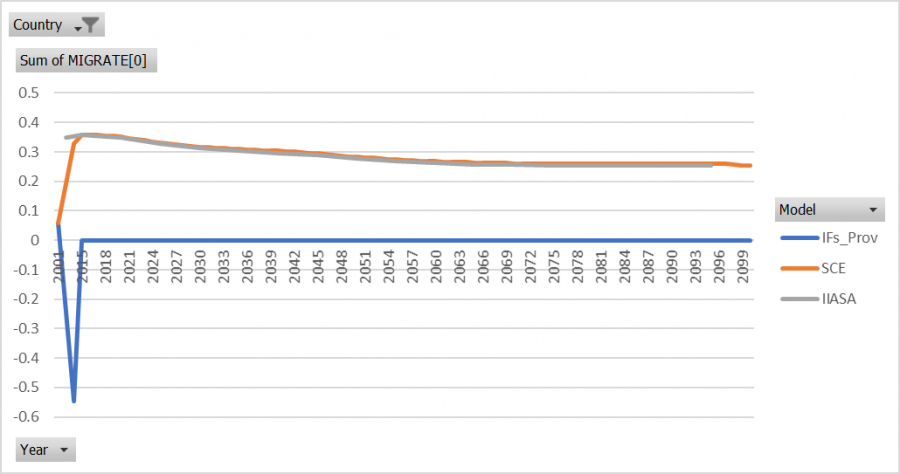
Population After Migration Scenario 1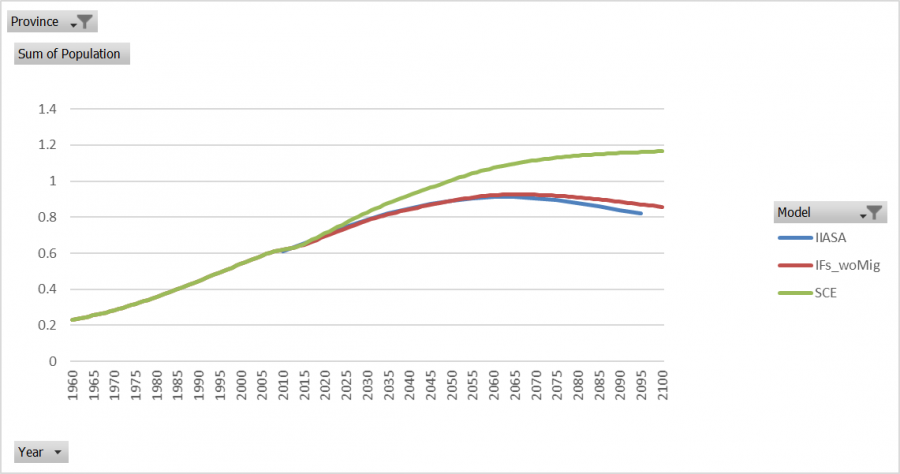
Migration Scenario 2 Results
The inclusion of migration in the first scenario made population forecasts further away from IIASA's forecasts. Therefore, the migration parameter is turned off in the second scenario.
Migration Rates After Migration Scenario 2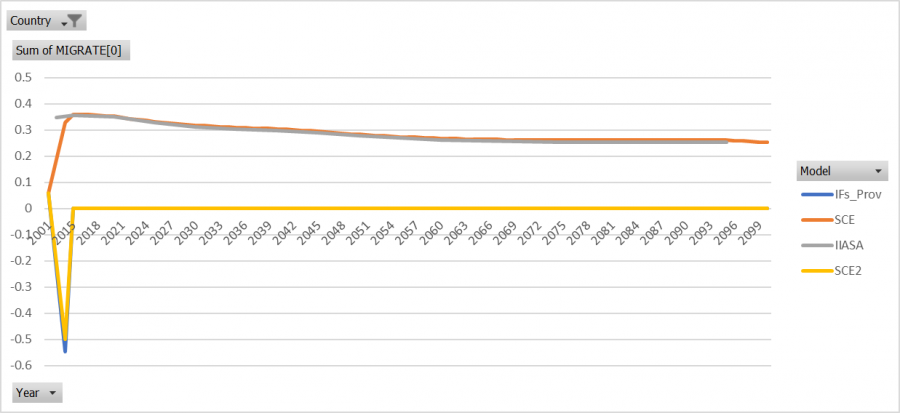
Population After Migration Scenario 2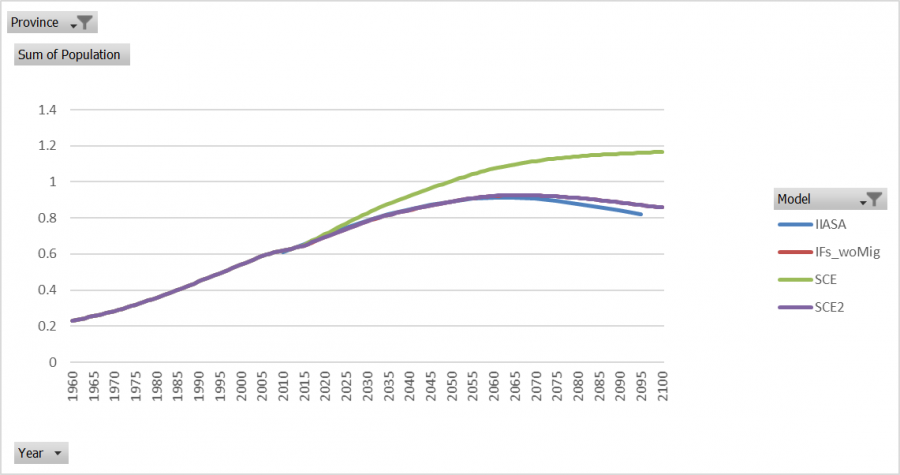
Migration Scenario 3 Results
Sikkim's migration rates remain at zero in the third scenario.
Migration Rates After Scenario 3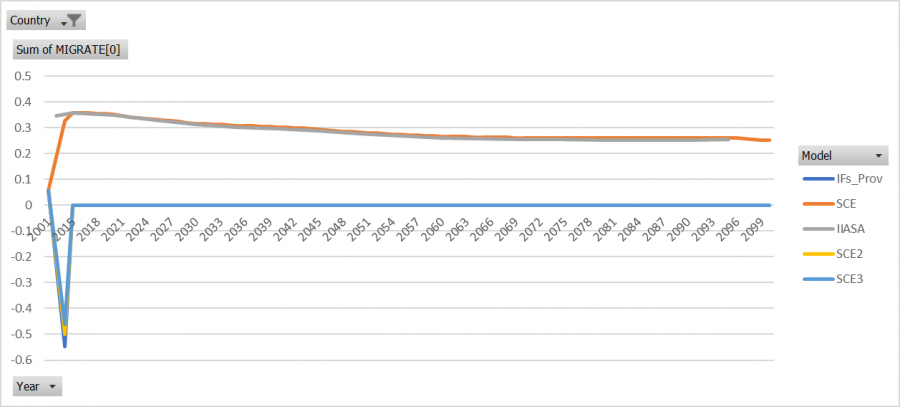
Population After Scenario 3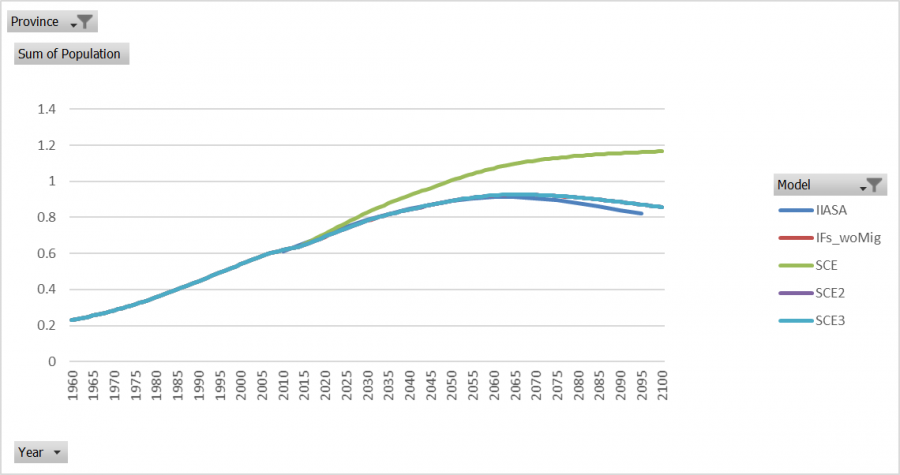
Tamil Nadu
Population
IFs' forecast for population in Tamil Nadu is greater than IIASA's by 2% to 6%.
Crude Birth Rate
CBRs are relatively close in both models.
Crude Death Rate
CDRs are close in the two models until 2070. After 2070, the IFs model forecast is greater than IIASA's by an increasing margin. By 2095, IFs CDRs are about 8% greater than IIASA's.
Migration
Total Fertility Rates
In 2010, IIASA's TFR is about 0.11 greater than IFs'. IIASA forecasts TFR to be 1.81 for most years. IFs forecasts TFR to steadily increase approaching 1.9, but never reaches it.
Migration Scenario 1 Results
Migration Rate After Migration Scenario 1
Population After Migration Scenario 1
Migration Scenario 2 Results
The first migration scenario improved population forecasts by getting IFs forecasts closer to IIASA's. However, the population in IFs was still greater than IIASA's by several million. Therefore, the second scenario has a doubled migration rate in Tamil Nadu.
Migration Rates After Migration Scenario 2
There is some push back in the model, which causes migration rates to increase from 2070 through 2085 and then decline again through the end of the time horizon.
Population After Migration Scenario 2
Tamil Nadu's population is improved in the second scenario and is close to IIASA's forecasts.
Migration Scenario 3 Results
Tamil Nadu's migration rates are unchanged in the third scenario.
Migration Rates After Migration Scenario 3
Population After Migration Scenario 3
Tripura
Population
Population in Tripura is forecast to be greater in the IFs model than in the IIASA model by an increasing margin. By 2095, IFs' population forecast is greater than IIASA's by about 1.2 million people.
Crude Birth Rates
The IFs' model forecasts CBRs to be greater than IIASA's model by about 5 births per thousand throughout the end of the time horizon.
Crude Death Rates
There is a jump up in CDRs in the IFs' model in 2014 at the model initialization. From 2015 through 2050, IFs' forecast of CDR is greater than IIASA's at a decreasing rate over time. After 2050, IIASA's CDRs surpass the IFs' forecasts and the difference between the two models increases. By 2095, IIASA's CDRs are about 6 more deaths per thousand.
Migration
Total Fertility Rates
IFs' TFR is about 0.3 greater than IIASA's in 2010. From 2010 through 2100, IFs forecasts a steady increase in TFR from 1.7 to 1.87. IIASA forecasts TFR to decline from around 1.38 to about 1.23 from 2010 to 2050. After 2050, IIASA forecasts TFR to rise to 1.41 by 2095.
Migration Scenario 1 Results
Migration Rate After Migration Scenario 1
Population After Migration Scenario 1
Migration Scenario 2 Results
The inclusion of migration rates in the first scenario made population forecasts worse. Therefore, migration was removed for Tripura in the second scenario.
Migration Rates After Migration Scenario 2
Population After Migration Scenario 2
Migration is closer to IIASA, but population is forecast to be greater in the IFs model by about 1.25 million at the end of the time horizon.
Migration Scenario 3
Despite IIASA's migration forecasts have a positive net inward migration in Tripura, Tripura's migration rates were lowered to -0.5 in 2014 in the third scenario. This was done to counteract the the lower death rates and higher birth rates in IFs as compared to IIASA.
Migration Rates After Migration Scenario 3
Population After Migration Scenario 3
Uttaranchal
Population
IFs' forecast of Uttaranchal's population is greater than IIASA's by an increasing margin. By 2095, IFs' population forecast is about 7% greater than IIASA's
Crude Birth Rate
There is a jump up in 2014 in IFs' CBR forecast when the model initializes. This jump produces a 25% difference between the two models. This difference declines until 2030, then there is an increase until 2045. From 2045 on the difference between the two models decreases until the end of the time horizon. IFs' forecasts of CBRs are greater than IIASA's for all years.
Crude Death Rate
The two models start at different points, with the IFs model being about 20% greater than IIASA. By 2055, the two models' forecasts of CDRs converge and stay together until 2085.
Migration
Total Fertility Rates
IFs' TFR is about 0.6 greater than IIASA's in 2010. IFs forecasts TFR to decline from 2.8 to 1.9 from 2014 through 2033. IIASA forecasts TFR to decline from 2.1 to 1.82 from 2010 to 2040. After 2040, IIASA's TFR increase to 1.84 by 2090 and then declines to 1.83 in 2095.
Migration Scenario 1 Results
Migration Rate After Migration Scenario 1
Population After Migration Scenario 1
Migration Scenario 2 Results
The introduction of net inward migration in the first scenario pushed IFs population further away from IIASA's forecasts. Therefore, migration was removed from the model in the second scenario.
Migration Rate After Migration Scenario 2
Population After Migration Scenario 2
Uttaranchal's population is closer to IIASA's in the second scenario without migration, but the population is still about 1.5 million greater than in IIASA's model.
Migration Scenario 3 Results
Uttaranchal's migration rates are the same in third scenario as they were in the second.
Migration Rates After Migration Scenario 3
Population After Migration Scenario 3
Uttar Pradesh
Population
IFs forecast of population in Uttar Pradesh is greater than IIASA's by an increasing margin. By 2095, Uttar Pradesh is forecast to have about 80 million more people in the IFs forecasts.
Crude Birth Rates
IFs' forecast of CBRs in Uttar Pradesh is greater than IIASA's for all years by a shifting margin. The difference between the two model's peaks in 2025 with about a 19% difference. By the end of the time horizon in 2095, the two models are almost the same. IIASA's CBRs are forecast to decline steadily.
Crude Death Rates
There is a jump up in CDRs in 2014 in the IFs model when the model initializes. From 2010 through 2040 IFs' forecasts of CDRs are greater than IIASA's by a decreasing margin. From 2040 through the end of the time horizon, the two models are about the same.
Migration
Total Fertility Rates
IFs' TFR is greater than IIASA by about 0.3 in 2010. Both models steadily decline and reach about 1.9 by 2050 through the end of the time horizon.
Migration Scenario 1 Results
Migration Rate After Migration Scenario 1
Population After Migration Scenario 1
Migration Scenario 2 Results
The first migration scenario was not aggressive enough to bring population in IFs down sufficiently. Therefore, the migration rates for Uttar Pradesh were doubled in the second scenario.
Migration Rates After Migration Scenario 2
There was some model push back on migration rates towards the end of the time horizon.
Population After Migration Scenario 2
Population forecasts in the second scenario are almost identical to IIASA's.
Migration Scenario 3 Results
Uttar Pradesh's migration rates are unchanged in the third scenario from the second.
Migration Rates After Migration Scenario 3
Population After Migration Scenario 3
West Bengal
Population
IFs' population forecast of West Bengal is greater than IIASA's by an increasing margin. By 2095, IFs forecasts about 15 million more people in West Bengal than in the IIASA model.
Crude Birth Rates
IFs forecasts CBRs to be greater than IIASA's forecast by about 2 births per thousand.
Crude Death Rates
There is a spike in CDRs in the IFs model in 2014, when the model initializes. From 2020 on the IIASA model's CDRs are greater than the IFs model.
Migration
Total Fertility Rates
IFs and IIASA's TFR are about the same for the first few years until 2020. After 2020, IIASA declines below IFs by about 0.2 and then rises. IFs' forecasts of TFR steadily increase from 2010 through the end of time horizon where TFR approaches by does not reach 1.9. IIASA's forecast of TFR reaches 1.72 by 2095.
Migration Scenario 1 Results
Migration Rate After Migration Scenario 1
Population After Migration Scenario 1
Migration Scenario 2 Results
The introduction of migration rates in the model with the first scenario made the population forecasts larger and further from the desired value. Therefore, the migration parameter was removed in the second scenario.
Migration Rates After Migration Scenario 2
Population After Migration Scenario 2
Population is too high, with about 10 million more people than IIASA at the end of the time horizon.
Migration Scenario 3 Results
Although IIASA forecasts net inward migration, migration rates in West Bengal were lowered to -0.5 in 2014 in the third scenario. This is to offset the lower deaths and higher births in the IFs model versus the IIASA model to bring population inline with IIASA's forecasts.
Migration Rates After Scenario 3
Population After Migration Scenario 3
Economy Module
India's GDP
India's GDP in the provincial model is significantly lower than in the 186 model. This has been a problem since the beginning of this project, but the problem has gotten significantly worse after data updates and the inclusion of new series in spring of 2017.
Andaman and Nicobar Islands's GDP
Andhra Pradesh's GDP
Arunanchal Pradesh's GDP
Assam's GDP
Bihar's GDP
Chandigarh's GDP
Chhatisgarh's GDP
Dadra and Nagar Haveli's GDP
Daman and Diu's GDP
Delhi's GDP
Goa's GDP
Gujarat's GDP
Haryana's GDP
Himachal Pradesh's GDP
Jammu and Kashmir's GDP
Jharkhand's GDP
Karnataka's GDP
Kerala's GDP
Lakshadweep's GDP
Madhya Pradesh's GDP
Maharashtra's GDP
Manipur's GDP
Meghalaya's GDP
Mizoram's GDP
Nagaland's GDP
Orissa's GDP
Pondicherry's GDP
Punjab's GDP
Rajasthan's GDP
Sikkim's GDP
Tamil Nadu's GDP
Telangana's GDP
Tripura's GDP
Uttaranchal's GDP
Uttar Pradesh's GDP
West Bengal's GDP
India's GDP per Capita
Andaman and Nicobar Island's GDP per Capita
Andhra Pradesh's GDP per Capita
Arunanchal Pradesh's GDP per Capita
Assam's GDP per Capita
Bihar's GDP per Capita
Chandigarh's GDP per Capita
This halving of GDP per capit appears dramatic, but Chandigarh's population is quite low and was increased by a significant proportion in the scenario.
Chhatisgarh's GDP per Capita
Dadra and Nagar Haveli's GDP per Capita
Daman and Diu's GDP per Capita
Delhi's GDP per Capita
Goa's GDP per Capita
Gujarat's GDP per Capita
Haryana's GDP per Capita
Himachal Pradesh's GDP per Capita
Jammu and Kashmir's GDP per Capita
Jharkhand's GDP per Capita
Karnataka's GDP per Capita
Kerala's GDP per Capita
Lakshadweep's GDP per Capita
Madhya Pradesh's GDP per Capita
Maharashtra's GDP per Capita
Manipur's GDP per Capita
Meghalaya's GDP per Capita
Mizoram's GDP per Capita
Nagaland's GDP per Capita
Orissa's GDP per Capita
Pondicherry's GDP per Capita
Punjab's GDP per Capita
Rajasthan's GDP per Capita
Sikkim's GDP per Capita
Tamil Nadu's GDP per Capita
Telangana's GDP per Capita
Tripura's GDP per Capita
Uttaranchal's GDP per Capita
Uttar Pradesh's GDP per Capita
West Bengal's GDP per Capita
Value Added
Value added is not the same in the provincial model as it is in the 186 model. The historical data has been carefully vetted and is normalized to the 186 model using ApplyMultAll. The normalization should prevent historical differences between the provincial and 186 models, but the process does not appear to be working properly.
Value Added in Agriculture
Although the historical data does not match, the forecasts appear to be about the same in all versions.
Value Added in Energy
There is not any historical data for this series in either model. The models start at different points and have different behavior throughout the forecasts. The 186 model forecasts a sharp decline from 2014 through 2030, whereas, the provincial model forecasts less change in value added in energy.
Value Added in ICT
There is a lack of historical data in ICT. The 186 version of IFs forecasts a steady increase in value added through the end of the time horizon, whereas the provincial model forecasts are relatively flat and decline from 2020 through 2070.
Value Added in Manufacturing
The historical data in the two models are close, but not identical. IFs pushes value added in manufacturing up dramatically after model initialization in both the 186 and provincial models. The forecasts are similar with the provincial model declining steadily through the forecasts.
Value Added in Materials
Value added in materials is forecast to increase as a greater proportion of GDP in the 186 model than in the provincial model over time.
Value Added in Services
The historical data does not match, but it is close. There is a drop at model initialization in the 186 model that does not occur in the provincial model. The two models are close in both history and forecast.
Government Consumption
All government consumption data is normalized in the model using ApplyMultAll and yet the historical values in the 186 model and the provincial model do not match.
Government Consumption in Education
Education spending is much higher in the provincial historical data and declines to values closer to the 186 model.
Government Consumption in Health
Health spending is historically greater than the 186 model and is forecast to increase by a greater margin. India's health spending appears to be significantly lower than the rest of the world's, even when comparing the provincial data.
Government Consumption in Infrastructure
There is not any historical data in the provincial model for infrastructure spending. Both models have a high peak at model initialization and then the proportion of government consumption relative to GDP is forecast to decline over time, with both models quite close together.
Government Consumption in InfraOther
The two models have the same starting point in 2014, but there is a forecast decline in the provincial model until around 2025. The 186 model steadily increases through the end of the time horizon.
Government Consumption in Military
The provincial model starts at the same point as the 186 model in 2014, but is forecast to decline until around 2025. The 186 forecasts are relatively flat, but are increasing when the provincial model is decreasing and then decreasing when the provincial model is increasing.
Government Consumption in Research and Development
The two models start at the same point in 2014, but the provincial model is forecast to see a decline in the proportion of R & D spending relative to GDP in the first few years of forecast. After 2025, the provincial model forecasts growing R & D spending, but the growth does not out pace the 186 models' growth by enough to reach the same amount of spending.
Government Consumption in Other
There is a significant proportion of spending relative to GDP that is attributed to the Other category in the provincial model. This is in contrast to the 186 model that forecasts a much lower amount.
MultiFactor Productivity
The dramatic difference in India's provincial GDP as compared to the 186 model appears to be driven by MFP, and more specifically, physical capital's contribution to annual growth.
MultiFactor Productivity in Agriculture
MFP in agriculture is about the same in all models at model initialization in 2014, but the three versions diverge. Overall, the difference is relatively small.
MultiFactor Productivity in Energy
MultiFactor Productivity in ICT
MultiFactor Productivity in Materials
MultiFactor Productivity in Manufacturing
MultiFactor Productivity in Services
Total MultiFactor Productivity
Growth Accounting
Capital
Capital in the Provincial Model
Capital in the 186 Model
Labor
Labor's contribution to growth is greater in agriculture and services in the provincial model.
Labor in the Provincial Model
Labor in the 186 Model
MultiFactor Productivity
MFP is lower in the provincial model than in the 186 model.
MFP in the Provincial Model
MFP in the 186 Model
Technology Base MFP
Technology Base MFP in the Provincial Model
Technology Base MFP in the 186 Model
Knowledge Base MFP
The Knowledge Base MFP is greater in the 186 model.
Knowledge Base MFP in the Provincial Model
Knowledge Base MFP in the 186 Model
Human Capital MFP
Human Capital MFP in the Provincial Model
Human Capital MFP in the 186 Model
Social Capital MFP
Social Capital is significantly different between the two models.
Social Capital MFP in the Provincial Model
Social Capital MFP in the 186
Physical Capital MFP
Physical capital is negative in the provincial model, with the exception of ICT at the end of the time horizon. The 186 model is positive from 2020 through 2060.
Physical Capital MFP in the Provincial Model
Physical Capital in the 186 Model
Correction MFP
There is a large disparity between the two models in Agriculture and ICTech.
Correction MFP in the Provincial Model
Correction MFP in the 186 Model
Foreign Direct Investment
There is not any provincial historical data for FDI in India, but the model appears to estimate historical data for all of the provinces based upon the 186 model. The forecasts are less than the 186 after 2050.
