Use IFs (Download): General Performance Analysis: Difference between revisions
No edit summary |
CamrynDreyer (talk | contribs) No edit summary |
||
| Line 1: | Line 1: | ||
= <span style="font-size:xx-large;">Performance and Risk Analysis</span> = | = <span style="font-size:xx-large;">Performance and Risk Analysis</span> = | ||
Performance and Risk Analysis is located under the Specialized Display sub-option, as well as on the [ | Performance and Risk Analysis is located under the Specialized Display sub-option, as well as on the [[Main_Menu_Map|Main Menu Map]]. This feature is a tool to forecast the level of risk and performance of a given country or group over a time horizon of nearly one hundred years. | ||
The first step in using this feature is to decide whether to examine a [ | The first step in using this feature is to decide whether to examine a [[Country/Region,_Group_or_G-List|country or a group]]. For this example, we shall use the country Venezuela. | ||
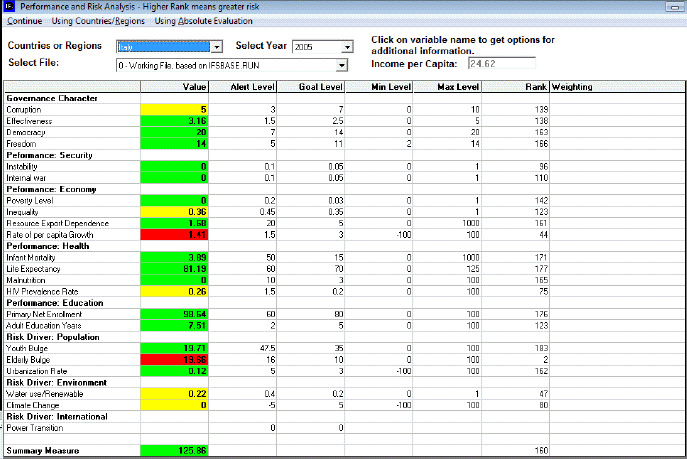
[[File:Genperf.gif|center|Example of a performance and risk evaluation for Venezuela]]Next, decide which year to examine. The year for the example above is set at 2010, but the user can view any year up to 2100. Next, decide which file to use. The example above is using the Policy First file. | [[File:Genperf.gif|center|Example of a performance and risk evaluation for Venezuela]]Next, decide which year to examine. The year for the example above is set at 2010, but the user can view any year up to 2100. Next, decide which file to use. The example above is using the Policy First file. | ||
| Line 11: | Line 11: | ||
Notice that the example above has one variable highlighted in red. The value for corruption is 2.4216, which is below the alert level value of 3. Now, adjust the selected year to 2005. Instead of two variables highlighted in green and one in red, each of the values for the variables is highlighted in a different color. The value for the youth bulge is 0.4046, which is between the alert level value of 0.5 and the goal level of 0.4. The value of the variable is accordingly highlighted in yellow. | Notice that the example above has one variable highlighted in red. The value for corruption is 2.4216, which is below the alert level value of 3. Now, adjust the selected year to 2005. Instead of two variables highlighted in green and one in red, each of the values for the variables is highlighted in a different color. The value for the youth bulge is 0.4046, which is between the alert level value of 0.5 and the goal level of 0.4. The value of the variable is accordingly highlighted in yellow. | ||
To look at a variable in greater detail, click on the variable. A box appears that allows the user to select from two options: either to show the variable over time, or to view the variable cross-sectionally. Choosing the first option will bring up a [ | To look at a variable in greater detail, click on the variable. A box appears that allows the user to select from two options: either to show the variable over time, or to view the variable cross-sectionally. Choosing the first option will bring up a [[General Display Options#Table Use|table]] with several columns, each representing the different run files the user can choose from. Choosing the second option brings up a graph, with the selected variable shown in relation with the GDPPCPPP for that country or group. | ||
= <span style="font-size:xx-large;">Evaluate Priorities</span> = | = <span style="font-size:xx-large;">Evaluate Priorities</span> = | ||
Revision as of 13:30, 25 July 2017
Performance and Risk Analysis
Performance and Risk Analysis is located under the Specialized Display sub-option, as well as on the Main Menu Map. This feature is a tool to forecast the level of risk and performance of a given country or group over a time horizon of nearly one hundred years.
The first step in using this feature is to decide whether to examine a country or a group. For this example, we shall use the country Venezuela.
Next, decide which year to examine. The year for the example above is set at 2010, but the user can view any year up to 2100. Next, decide which file to use. The example above is using the Policy First file.
The calculation of the performance and risk is based on a number of variables, such as Corruption, Youth Bulge, and State fragility, divided into categories, such as Governance, Population, and Social/Political. The variables are highlighted in green, yellow or red. The color indicates whether or not the variable has met the goal level set for that variable. If it has, the variable will be highlighted in green. If it has not, it will either be highlighted in yellow, if the value for the variable is between the alert level and the goal level, or in red, if the value for the variable has crossed the threshold for the alert level.
Notice that the example above has one variable highlighted in red. The value for corruption is 2.4216, which is below the alert level value of 3. Now, adjust the selected year to 2005. Instead of two variables highlighted in green and one in red, each of the values for the variables is highlighted in a different color. The value for the youth bulge is 0.4046, which is between the alert level value of 0.5 and the goal level of 0.4. The value of the variable is accordingly highlighted in yellow.
To look at a variable in greater detail, click on the variable. A box appears that allows the user to select from two options: either to show the variable over time, or to view the variable cross-sectionally. Choosing the first option will bring up a table with several columns, each representing the different run files the user can choose from. Choosing the second option brings up a graph, with the selected variable shown in relation with the GDPPCPPP for that country or group.
Evaluate Priorities
Evaluate Priorities can be found under the Specialized Display sub-option under the Display option on the Main Menu. It is also located under the Main Menu Map options.
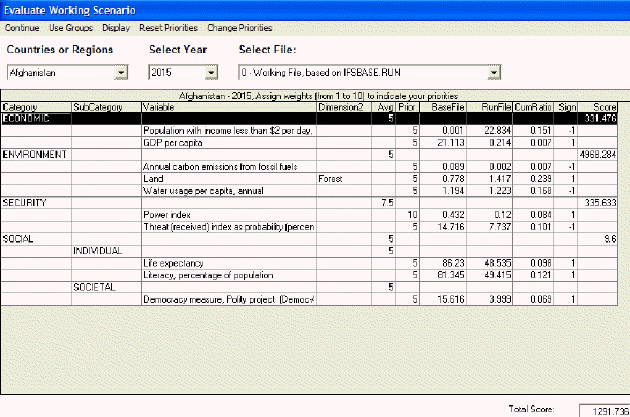
This display feature of IFs allows users to analyze and evaluate any Run-Result-File normatively. Users can set evaluative criterion and assign them numerical weights. The model is then run and each criterion is evaluated with respect to what variables most heavily affected the resulting number.
When this option is selected from the Display option on the Main Menu and the Specialized Display sub-option, a window opens that asks for your name. You are then guided to a menu that allows you to flexibly evaluate your Run-Result-File to your needs and goals.
On the Evaluate Priorities menu, you are able to toggle between countries/regions or groups. The next option is a Display option. This allows you to access some of the display features of IFs. The next option on the menu of Evaluate Priorities is the Reset Priorities option. This allows users to clear all priority changes that were previously made.
The final option allows users to Change Priorities. Choosing this option opens up a secondary window where users can individualize their evaluative criteria. For example, if you were interested in emphasizing GDP per capita, double click on the number found in the column labeled “Weight”. This will bring up a smaller window that allows you to increase or decrease the numeric priority assigned to GDP per capita. The average priority for all variables is 5. From this screen, users can choose Define Priorities. This brings up a new window that allows for many different variables to be added to the main priorities menu.
If a user is interested in agricultural yield figures but it is currently not displayed on the Main Menu of Evaluate Priorities, they can click on the “No” that is found under the Guided Use column on the Define Priorities menu. Users can also delete any changes made to this list by selecting the Reset G.U. option found at the bottom of the Define Priorities menu.
Returning to the Evaluate Priorities form, users are able to see and change the weight allotted to certain variables by double clicking on the number located under the column labeled “Prior”. Also, if you would like to display the result of one variable over time, double-click on the number located under the column labeled Run-File. This will bring up a new table.
From the scroll-down lists located at the top of the Evaluate Priorities screen just below the menu, users can change the countries/regions or groups, the year that is being displayed and the Run-Result-File that is used as the source of results.

