Flexible Displays (Download): Difference between revisions
No edit summary |
No edit summary |
||
| (One intermediate revision by the same user not shown) | |||
| Line 3: | Line 3: | ||
This display feature of IFs allows users more flexibility than the [[Geographically-fixed_Displays_(Download)|Geographically-fixed Displays]] by allowing for the display of data sets by specific country or group. | This display feature of IFs allows users more flexibility than the [[Geographically-fixed_Displays_(Download)|Geographically-fixed Displays]] by allowing for the display of data sets by specific country or group. | ||
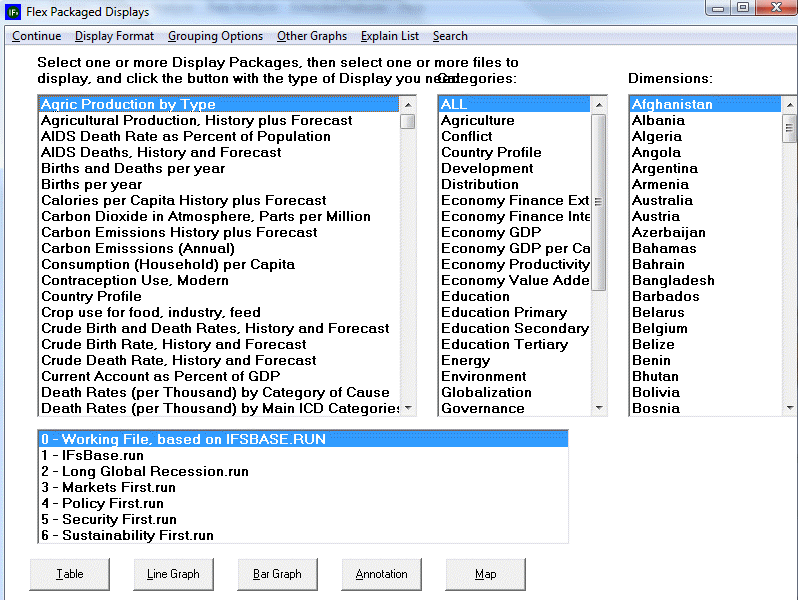
[[File:Flexibledisplay.gif| | [[File:Flexibledisplay.gif|frame|right|Example of the Flexible Display window in IFs]]The Flexible Displays is designed to allow users to graph information on a specific [[Country/Region,_Group_or_G-List|country/region or group]]. | ||
The display variables are located in a list on the left hand side of the screen. To the right of this list of variables is a list of general categories. Each display belongs to one of the broader categories. If you are interested in one specific category, click on it and the general list of displays will be reduced to only those that pertain to the category you have selected. [[Self-Managed_Display_(Download)|Learn how to incorporate your own categories]]. | The display variables are located in a list on the left hand side of the screen. To the right of this list of variables is a list of general categories. Each display belongs to one of the broader categories. If you are interested in one specific category, click on it and the general list of displays will be reduced to only those that pertain to the category you have selected. [[Self-Managed_Display_(Download)|Learn how to incorporate your own categories]]. | ||
Revision as of 22:37, 26 July 2017
The Flexible Displays can be found under Display on the Main Menu.
This display feature of IFs allows users more flexibility than the Geographically-fixed Displays by allowing for the display of data sets by specific country or group.
The Flexible Displays is designed to allow users to graph information on a specific country/region or group.
The display variables are located in a list on the left hand side of the screen. To the right of this list of variables is a list of general categories. Each display belongs to one of the broader categories. If you are interested in one specific category, click on it and the general list of displays will be reduced to only those that pertain to the category you have selected. Learn how to incorporate your own categories.
To the right of the general categories is a list of every country. If, instead of displaying countries/regions, you would like to display groups, simply click on the Using Countries/Regions option on the Flexible Displays' Main Menu. The list at the very bottom of the screen is of the different Run-Result-Files that accompanied your version of the software. If you would like to learn more about specifically what parameters and variables are affected by these Run-Result-Files, simply highlight one and click on the Annotation button.
Certain variables and categories, such as education, when selected, will cause other windows to appear that display different dimensions, or ways of disaggregating the data. For example, selecting the file Education Tertiary Student Flow brings up another dimension, in this case gender, from which the user is able to choose.
The user is also able to select more than one country or more than one Run-Result-File for graphing. Simply click on one country/region, hold in the control button (ctrl), and click on another country/region. Do the same to see a graph displaying results as the product of more than one Run-Result-File.
When the user has chosen the display to graph and the countries/regions or groups that you to display, click on Line Graph or Bar Graph. The user is also able to display pie charts and radial graphs, located under the Other Graphs heading. For an explanation on how to use the Map feature, click on Map Use.
Additionally, choosing the Display Format option located on the Flexible Displays menu allows the user to more professionally tailor the graphs as needed. Firstly, the user can change the titles for tables and graphs, and the titles of the X and Y axes for graphs. The user can also edit the table display interval, as well as edit the year for a pie chart, scatterplot, or map. Secondly, the user is able to select the currency in which to display data that is otherwise displayed in US dollars. Thirdly, the user can set the limits of the run horizon, with a maximum horizon of 2100 and a minimum of 1960. Fourthly, check the “Use all historic data” feature, and the model will provide the most up to date historical data available. The last option, the “Use Estimation” option, tells the model to extrapolate from the historic data to fill in any possible holes in the data that exist.
The Explain List in the heading is an option that, when selected, will provide a definition, show the historic formula, and list any dimensions available for any selected variable.
Clicking on the the Search option in the heading allows the user to search for any variable in the IFs database, and add that variable to the list of available variables in the Flexible Displays.
The user is able to edit the variables listed in Flexible Displays by first selecting Self-Managed Display, and then selecting Edit Variable Lists.
