Basic Report for Countries/Regions or Groupings: Difference between revisions
No edit summary |
No edit summary |
||
| (5 intermediate revisions by 2 users not shown) | |||
| Line 1: | Line 1: | ||
Basic Report for Countries/Regions or Groupings (henceforth "Basic Report") can be found as a sub-option under Display on the Main Menu, as well as in the list of options that pop-up upon clicking on counties in the map of the main menu (see [ | Basic Report for Countries/Regions or Groupings (henceforth "Basic Report") can be found as a sub-option under Display on the Main Menu, as well as in the list of options that pop-up upon clicking on counties in the map of the main menu (see [[Main_Menu_Map_Pop-up|Main Menu Map]] options). This display option of IFs allows users to present important information for a country or group in one summary table. As the name suggests, this display feature presents a basic report of various important variables across all of the IFs modules for selected countries or groups, for the base model year and several forecasted years. Basic Report has a great deal in common with the [[Country_Profile|Country Profile]] option, which users can access by going to the Main Menu Map, clicking on the desired country, and selecting County Profile. The Country Profile form is newer within IFs and most users will look to it rather than Basic Report; Country Profile allows the user to call up all forecast years and also to see historical values when available for IFs variables. Advantages of Basic Report are display of basic values from alternative scenarios comparison of them with the Base Case. | ||
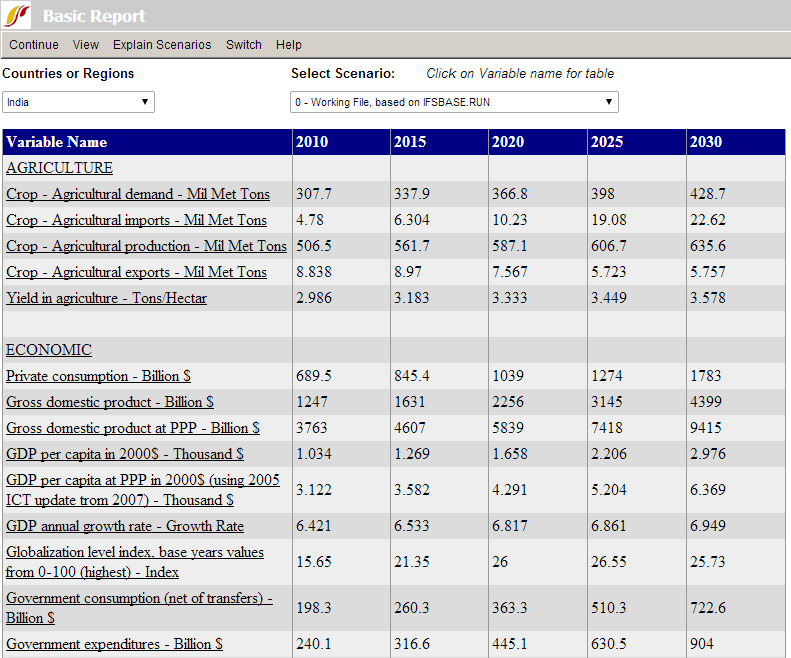
A sample Basic Report (below) shows you a selection of variables from the model in key issue areas for India. | A sample Basic Report (below) shows you a selection of variables from the model in key issue areas for India. | ||
[[File:Useifs7.PNG| | [[File:Useifs7.PNG|frame|right|Example of Basic Report in IFs]] | ||
The left-most column (Variable Name) lists variables by category – Agriculture, Economic, Energy, Environment, Political (domestic and international), Population, and Social. The five remaining columns hold a historic value for 2010, and forecast values for the years 2015, 2020, 2025 and 2030. Note that, for each variable, units are listed along with descriptions in the Variable Name column. | The left-most column (Variable Name) lists variables by category – Agriculture, Economic, Energy, Environment, Political (domestic and international), Population, and Social. The five remaining columns hold a historic value for 2010, and forecast values for the years 2015, 2020, 2025 and 2030. Note that, for each variable, units are listed along with descriptions in the Variable Name column. | ||
At the top of the grid table, there are two list boxes . Click on the down-arrow attached to the [ | At the top of the grid table, there are two list boxes . Click on the down-arrow attached to the [[Repeated_Features#Country/Region,_Group_or_Geography-List|Countries or Regions]] box. A list of the countries/regions used in IFs will appear. Click on one of interest to you and see the report change to that country/region. You can similarly change the scenario being displayed. | ||
Under the Switch option of the menu bar are two sub-options. The first allows you to toggle between Use Groups and Use Countries/Regions in the list box described above. The second allows you to toggle or switch between two different versions of the report. | Under the Switch option of the menu bar are two sub-options. The first allows you to toggle between Use Groups and Use Countries/Regions in the list box described above. The second allows you to toggle or switch between two different versions of the report. | ||
| Line 17: | Line 17: | ||
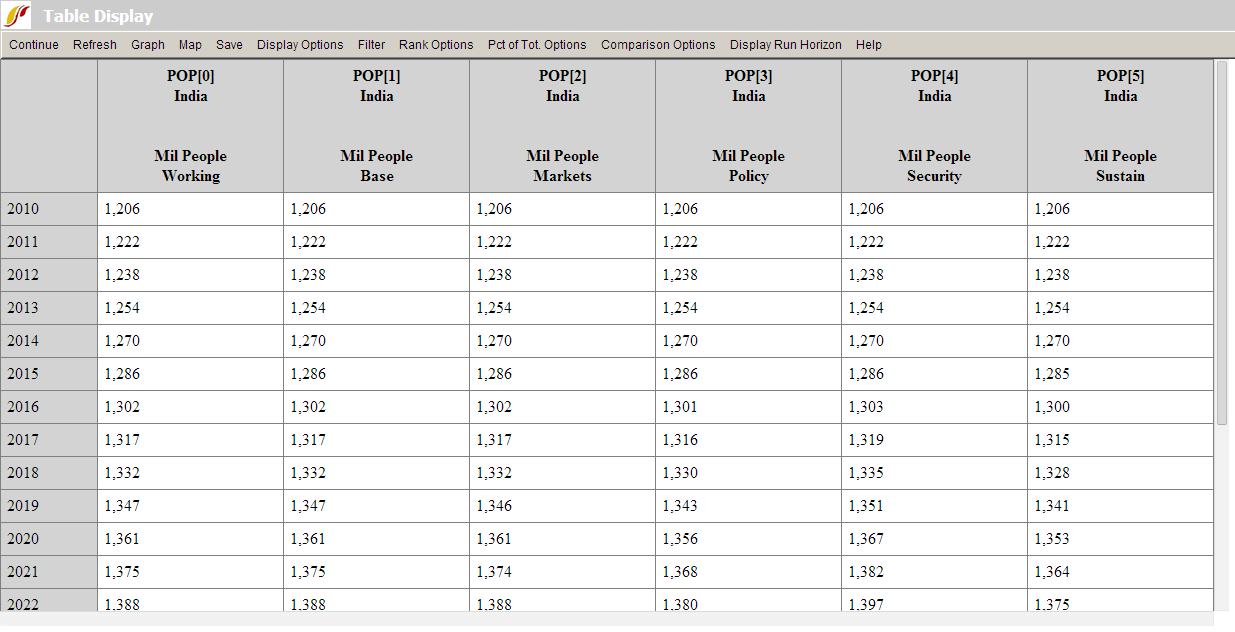
The grid itself allows the display of any variable in either report across all active scenarios. As a demonstration, generate a basic report for India for a variable of special interest to you in a grid table, for instance, Population – Mil People (total population in millions). Left click on the variable name. That will call up a table of the variable over time, starting from the base year (2010) and across all scenarios. Each column header will show the name of the variable, and the number in brackets after the variable name identifies the Scenario File. For instance, the number 1 always identifies the Base Case. | The grid itself allows the display of any variable in either report across all active scenarios. As a demonstration, generate a basic report for India for a variable of special interest to you in a grid table, for instance, Population – Mil People (total population in millions). Left click on the variable name. That will call up a table of the variable over time, starting from the base year (2010) and across all scenarios. Each column header will show the name of the variable, and the number in brackets after the variable name identifies the Scenario File. For instance, the number 1 always identifies the Base Case. | ||
[[File:Useifs8.PNG|center]] | [[File:Useifs8.PNG|frame|center|Example of Basic Report in grid table in IFs]] | ||
With the table on your screen, there are many [ | With the table on your screen, there are many [[Repeated_Features#Table_Use|additional options]]. For instance, go to the Graph option and select the [[Repeated_Features#Line_Graph,_Bar_Graph,_Pie_Chart_and_Scatter_Plot|Line graph or Bar graph]] sub-option. | ||
Latest revision as of 18:32, 27 July 2017
Basic Report for Countries/Regions or Groupings (henceforth "Basic Report") can be found as a sub-option under Display on the Main Menu, as well as in the list of options that pop-up upon clicking on counties in the map of the main menu (see Main Menu Map options). This display option of IFs allows users to present important information for a country or group in one summary table. As the name suggests, this display feature presents a basic report of various important variables across all of the IFs modules for selected countries or groups, for the base model year and several forecasted years. Basic Report has a great deal in common with the Country Profile option, which users can access by going to the Main Menu Map, clicking on the desired country, and selecting County Profile. The Country Profile form is newer within IFs and most users will look to it rather than Basic Report; Country Profile allows the user to call up all forecast years and also to see historical values when available for IFs variables. Advantages of Basic Report are display of basic values from alternative scenarios comparison of them with the Base Case.
A sample Basic Report (below) shows you a selection of variables from the model in key issue areas for India.
The left-most column (Variable Name) lists variables by category – Agriculture, Economic, Energy, Environment, Political (domestic and international), Population, and Social. The five remaining columns hold a historic value for 2010, and forecast values for the years 2015, 2020, 2025 and 2030. Note that, for each variable, units are listed along with descriptions in the Variable Name column.
At the top of the grid table, there are two list boxes . Click on the down-arrow attached to the Countries or Regions box. A list of the countries/regions used in IFs will appear. Click on one of interest to you and see the report change to that country/region. You can similarly change the scenario being displayed.
Under the Switch option of the menu bar are two sub-options. The first allows you to toggle between Use Groups and Use Countries/Regions in the list box described above. The second allows you to toggle or switch between two different versions of the report.
The sub-options under the View option allow examination of percentage changes from the initial year or the percentage difference between a selected Scenario File and the base case. Click on View and then on Percent Change from First Year or Percent Change from Base Case sub-option.
The menu option next to View is Explain Scenarios and has two sub-options. The first is Explain Selected Scenario, which explains the premises and assumptions of the selected scenario. The numbering of the various scenarios is explained by a function in the sub-option, Explain File Numbering.
The grid itself allows the display of any variable in either report across all active scenarios. As a demonstration, generate a basic report for India for a variable of special interest to you in a grid table, for instance, Population – Mil People (total population in millions). Left click on the variable name. That will call up a table of the variable over time, starting from the base year (2010) and across all scenarios. Each column header will show the name of the variable, and the number in brackets after the variable name identifies the Scenario File. For instance, the number 1 always identifies the Base Case.
With the table on your screen, there are many additional options. For instance, go to the Graph option and select the Line graph or Bar graph sub-option.

